Activated Carbon Price Update: Sustained Growth Across Key Markets in Q1 2026
08-Dec-2025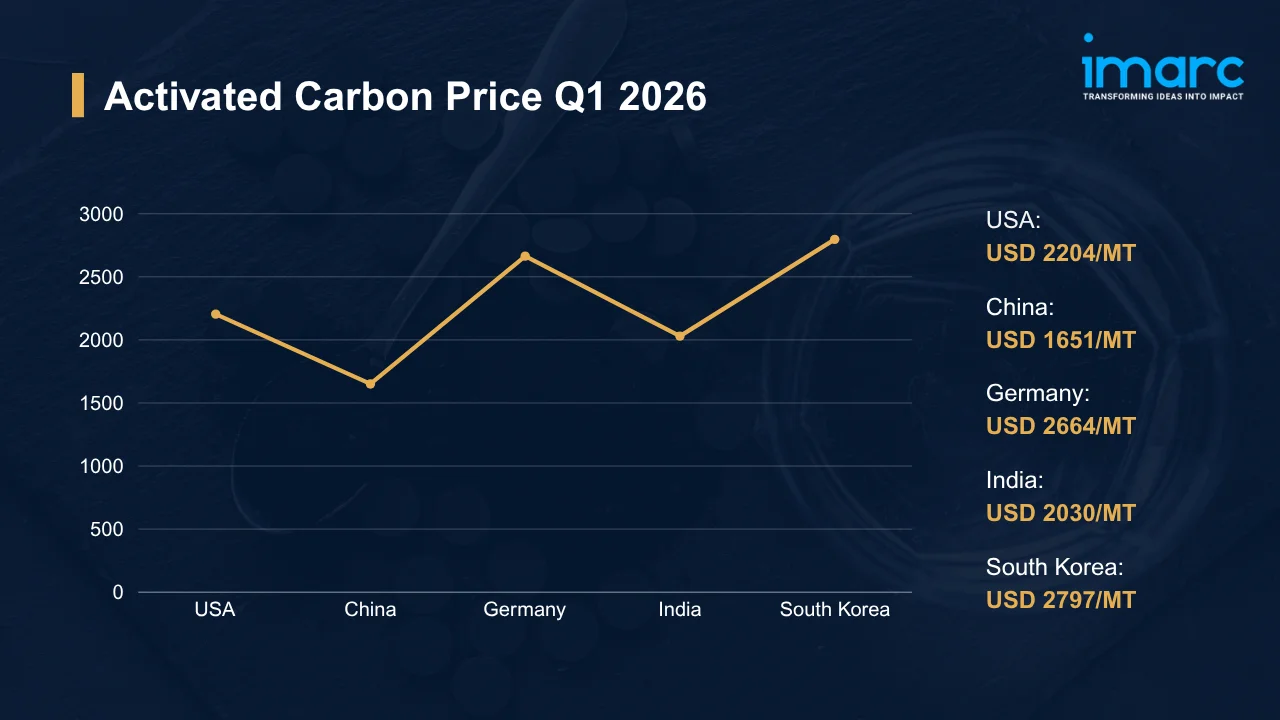
Produced through physical or chemical activation of coal, coconut shell, and wood, activated carbon is a carbonaceous material defined by its extraordinary surface area and adsorption capacity. Activated carbon prices respond to upstream feedstock cost movements across both coal-based and biomass supply chains, energy expenditure in carbonization and activation stages, and demand cycles in water treatment, air purification, pharmaceutical, and food processing industries. Ocean freight conditions on principal import corridors and tightening environmental compliance obligations across key consuming markets add further pricing layers.
Global Market Overview:
Globally, the activated carbon industry was valued at USD 4.77 Billion in 2025. Market projections indicate steady growth, with the industry expected to reach USD 7.72 Billion by 2034, with a compound annual growth rate (CAGR) of 5.51% during 2026-2034. Municipal water infrastructure expansion and broadening industrial emissions control requirements anchor baseline demand, though the activated carbon price trend is increasingly shaped by pharmaceutical-grade filtration growth and semiconductor-sector gas purification requirements. Regulatory tightening across North America, the EU, and Asian economies continues diversifying the addressable demand base.
Activated Carbon Price Trend Q1 2026:
Regional prices (USD per MT) and QoQ changes Q1 2026 vs Q4 2025:
| Region | Price (USD/MT) | QoQ Change | Direction |
|---|---|---|---|
| USA | 2,204 | +2.32% | ↑ |
| China | 1,651 | +1.21% | ↑ |
| Germany | 2,664 | +1.09% | ↑ |
| India | 2,030 | +2.12% | ↑ |
| South Korea | 2,797 | +3.21% | ↑ |
To access real-time prices Request Sample
What Moved Prices:
USA:
- At USD 2,204/MT in Q1 2026, activated carbon prices in the USA gained 2.32% QoQ as municipal water utilities and industrial air purification operators expanded procurement volumes. Compliance-driven treatment obligations, rather than inventory restocking, drove buying activity through the quarter, sustaining contract and spot demand concurrently.
- Domestic output held steady, with import volumes supplementing supply without creating surplus. Feedstock cost stability prevented escalation at the producer level. The activated carbon price chart for Q1 2026 traced a controlled upward path, reflecting structural demand tied to regulatory filtration requirements rather than cyclical buying patterns.
China:
- In Q1 2026, activated carbon prices in China reached USD 1,651/MT, recovering modestly after Q4 2025 softness as downstream environmental filtration and chemical processing demand firmed. Export inquiry from Southeast Asian and European buyers tightened domestic availability, pushing prices upward despite broadly adequate production levels.
- Raw material supply remained sufficient, preventing sharp input cost escalation. Outbound shipments to established trade partners maintained their pace, while CNY exchange rate stability against key buyer currencies kept landed-cost calculations predictable. Competitive export pricing from Chinese producers sustained active overseas inquiry across both GAC and PAC grade segments.
Germany:
- Prices in Germany reached USD 2,664/MT in Q1 2026, rising 1.09% QoQ as water treatment facilities, emissions control operators, and specialty industrial filtration buyers maintained steady offtake. Regulatory frameworks governing industrial discharge and municipal water quality continued to anchor procurement volumes, limiting buyer flexibility to defer purchases.
- Asian-origin imports covered a substantial share of domestic demand, with stable Asia-Europe container logistics enabling consistent inbound supply through the quarter. Energy cost normalization at European reactivation facilities reduced upward margin pressure on domestic producers. Procurement patterns leaned toward contract-based sourcing aligned with compliance schedules, keeping price movement orderly.
India:
- During Q1 2026, activated carbon prices in India rose to USD 2,030/MT, gaining 2.12% QoQ as municipal water treatment programs and pharmaceutical-sector filtration applications expanded procurement. Government-backed clean water initiatives channeled incremental volume into public utility procurement, while active export shipments reduced available domestic supply.
- Coconut-shell feedstock availability from southern producing states held adequate through the period, preventing raw material cost pressure from filtering into finished pricing. Port operations at key import gateways ran without notable disruption. Buyers across industrial filtration and water treatment clusters aligned purchasing closely with operational requirements, showing little evidence of speculative buffer-building.
South Korea:
- At USD 2,797/MT, South Korea posted the sharpest QoQ gain across all tracked markets at 3.21% in Q1 2026, driven by semiconductor manufacturing, specialty gas purification, and industrial wastewater treatment applications. Constrained imports of key precursor materials from Southeast Asia tightened supply margins, intensifying upward price pressure beyond what demand alone would have generated.
- Domestic producers operated efficiently, though precursor feedstock lead times introduced procurement sensitivity at the facility level. Energy costs for carbonization and activation remained elevated relative to prior quarters, compressing margins and contributing to end-product price increases. Advanced manufacturing buyers absorbed cost escalation given the stringent specification requirements of semiconductor-adjacent filtration applications.
Drivers Influencing the Market:
Several factors continue to shape activated carbon pricing and market behavior:
- Water Treatment and Environmental Filtration Demand: Water treatment represents a significant end use segment in global activated carbon consumption, with procurement volumes anchored by public infrastructure spending and compliance cycles. In May 2025, the US EPA upheld enforceable Maximum Contaminant Level standards for PFOA and PFOS in drinking water, requiring public water system compliance by 2029, which directly sustains GAC demand from North American utilities. Urbanization across South Asia and Southeast Asia continues expanding the addressable municipal treatment base.
- Upstream Coal and Biomass Feedstock Cost Dynamics: Coal-based and coconut-shell-based feedstocks play a critical role in determining raw material costs for activated carbon producers worldwide. Fluctuations in coal markets, energy costs, and transportation expenses can directly influence production economics, while seasonal variations in biomass availability across key producing regions contribute to feedstock supply uncertainty and periodic pricing pressure, particularly for coconut-shell-based activated carbon grades.
- Energy Expenditure in Carbonization and Activation: Carbonization and activation are energy-intensive stages, making electricity and natural gas tariffs primary cost levers for activated carbon producers. European facilities face structurally higher utility costs relative to Asian counterparts, which contributes to the persistent pricing premium observed in German and broader EU assessments. The activated carbon price index across producing regions partially reflects these regional energy cost asymmetries, with differentials widening during periods of elevated gas pricing.
- Ocean Freight and Logistics Economics: Trade flows predominantly move from Asian producing countries toward North American and European consumers, exposing landed costs to container shipping rate conditions on transpacific and Asia-Europe corridors. Port congestion events and vessel capacity constraints introduce procurement lead time risk, pushing buyers toward buffer inventory positions that temporarily amplify demand signals. Normalized logistics windows enable tighter purchasing cycles and reduce the spot premiums buyers otherwise pay during supply urgency.
- Environmental and Regulatory Compliance: Regulatory frameworks governing chemical handling, effluent discharge, and hazardous waste disposal raise operational compliance costs for activated carbon producers and distributors across multiple jurisdictions. Reactivation facility investments required under sustainability mandates represent substantial capital commitments that eventually pass through into commercial pricing. Compliance cost burdens vary by region, creating pricing disparities between markets with stringent frameworks and those with lighter enforcement regimes.
- Trade Policy and Currency Dynamics: Tariff structures, export licensing regimes, and exchange rate movements between the USD, CNY, EUR, INR, and KRW shape competitive positioning across sourcing regions and influence landed cost outcomes. Currency depreciation in major Asian supplier economies compresses USD-denominated export prices, intensifying import competition against domestic producers in North American and European markets. Policy shifts on import duties can redirect trade flows within short lead times, altering regional supply balances and price formation dynamics accordingly.
Recent Highlights & Strategic Developments:
Recent strategic moves within the industry further illustrate evolving dynamics:
- In September 2025, Kemira received investment approval for a new activated carbon reactivation facility at its Helsingborg site in Sweden. The project targeted expanded water treatment capacity across the Nordic region, addressing rising demand for micropollutant removal solutions.
Outlook & Strategic Takeaways:
Looking ahead, the activated carbon market is expected to sustain its expansion through 2034, driven by water infrastructure investment across emerging economies, tightening industrial emissions standards, and growing semiconductor and pharmaceutical filtration requirements. Upstream feedstock cost trajectories, water treatment regulatory requirements, and freight rate conditions on key import corridors will shape the activated carbon price forecast over the medium-to-long term.
To navigate this complex landscape, stakeholders should:
- Monitor Regional Price Differentials: Track quarterly pricing variations across the USA, Germany, China, India, and South Korea to identify cost-saving procurement windows. Establish benchmarking protocols that compare landed costs against prevailing contract rates for optimal sourcing decisions.
- Assess Freight Market Developments: Monitor container shipping rate trends on Asia-Europe and transpacific corridors to anticipate landed cost movements. Negotiate flexible logistics contracts incorporating rate adjustment mechanisms tied to prevailing spot market conditions.
- Evaluate Downstream Demand Indicators: Track water treatment infrastructure spending, environmental permitting activity, and pharmaceutical procurement cycles across principal consumption regions. Correlate demand signals with procurement planning to optimize inventory positioning.
- Review Regulatory Compliance Expenditures: Audit current compliance costs for handling, storage, and environmental discharge requirements across operating jurisdictions. Benchmarking activated carbon price per MT against compliance-adjusted procurement budgets helps identify sourcing efficiencies.
- Strengthen Currency Exposure Management: Implement hedging strategies for procurement denominated in volatile currencies to stabilize landed cost projections. Coordinate treasury and procurement functions to align foreign exchange coverage with anticipated import payment timelines.
- Explore Emerging Application Segments: Investigate growth potential within semiconductor-grade gas purification, advanced pharmaceutical filtration, and biogas upgrading applications for portfolio diversification. Engage with technical partners to assess commercial viability and specification requirements for next-generation activated carbon grades.
Subscription Plans & Customization:
IMARC offers flexible subscription models to suit varying needs:
- Monthly Updates: 12 deliverables/year
- Quarterly Updates: 4 deliverables/year
- Biannual Updates: 2 deliverables/year
Each includes detailed datasets (Excel + PDF) and post-report analyst support.

Get in Touch With Us
UNITED STATES
Phone: +1-201-971-6302
INDIA
Phone: +91-120-433-0800
UNITED KINGDOM
Phone: +44-753-714-6104
Email: [email protected]
Client Testimonials


.webp)


