Liquid Carbon Dioxide Price Update: Sustained Growth Across Key Markets in Q2 2026
28-Jul-2026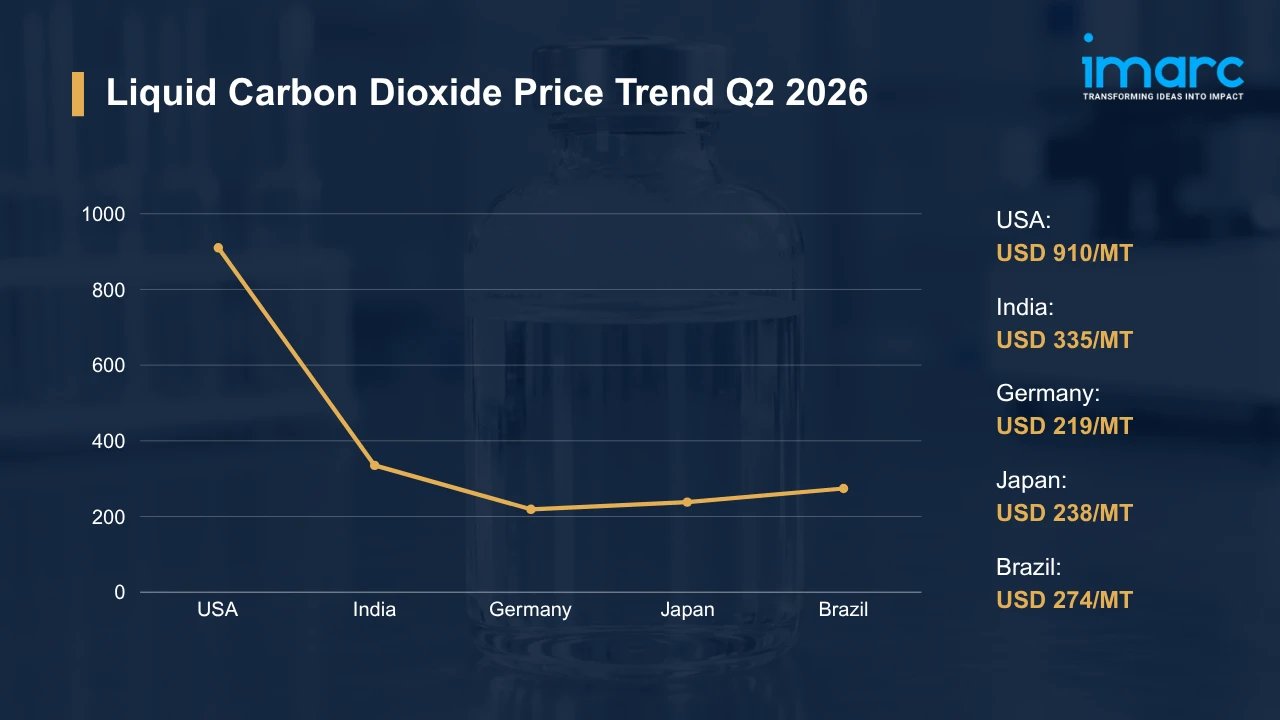
Liquid carbon dioxide is the condensed, pressurized form of carbon dioxide gas, held in insulated vessels and consumed across beverage carbonation, food freezing, cryotherapy, and precision cleaning. Between industrial and food grades, purity specifications differ sharply. Recovered gas availability from ammonia and bioethanol plants, energy expenditure during compression and liquefaction, and cryogenic tanker logistics jointly govern liquid carbon dioxide prices.
Global Market Overview:
Globally, the liquid carbon dioxide industry reached a volume of 9.3 Million Tons in 2025. Market projections indicate steady growth, with the industry expected to reach a volume of 14.4 Million Tons by 2034, with a compound annual growth rate (CAGR) of 4.98% during 2026-2034. Across emerging economies, cold chain expansion underpins steady volume growth. Medical gas consumption and carbon capture deployment together shape the liquid carbon dioxide price trend.
Liquid Carbon Dioxide Price Trend Q2 2026:
Regional prices (USD per MT) and QoQ changes Q2 2026 vs Q1 2026:
| Region | Price (USD/MT) | QoQ Change | Direction |
|---|---|---|---|
| USA | 910 | +7.87% | ↑ |
| India | 335 | +3.11% | ↑ |
| Germany | 219 | +5.21% | ↑ |
| Japan | 238 | +0.17% | ↑ |
| Brazil | 274 | +6.21% | ↑ |
To access real-time prices Request Sample
What Moved Prices:
USA:
- In Q2 2026, liquid carbon dioxide prices in the USA climbed to USD 910/MT, a 7.87% QoQ advance driven by tightened merchant supply across the Gulf Coast. Ammonia plant turnarounds curtailed byproduct recovery through May. Ahead of the summer bottling season, beverage carbonation demand accelerated sharply, lifting contract settlements.
- Across inland corridors, rail and tanker capacity remained stretched. Distributors competing for medical grade and food grade volumes accepted higher netbacks, while dry ice producers absorbed material that would normally reach industrial buyers at lower valuations. Through the quarter, the liquid carbon dioxide price chart reflected consistent upward pressure.
India:
- During Q2 2026, liquid carbon dioxide prices in India advanced to USD 335/MT as pre-monsoon beverage bottling and cold chain offtake absorbed available merchant volumes across western states. Fertilizer plant scheduling governed regional byproduct availability. At inland depots, delays in tanker turnaround hindered deliveries, prompting buyers to obtain forward commitments.
- Domestic producers held firm on quarterly contract renewals. Rising cold storage capacity across horticultural clusters lifted baseline consumption, while nitrogenous fertilizer output remained the decisive variable governing how much recovered gas reached merchant channels. Freight costs on inter-state routes added modest pressure to landed valuations.
Germany:
- In Q2 2026, liquid carbon dioxide prices in Germany rose to USD 219/MT, reflecting a 5.21% QoQ increase as scheduled maintenance at ammonia and bioethanol facilities trimmed recovery volumes. Brewing and meat processing demand strengthened into summer. Rebuilding inventories early, beverage fillers competed directly with industrial consumers for limited cylinder allocations.
- Across the region, electricity tariffs weighed on liquefaction cost structures. Suppliers passed through higher compression expenses, and cross-border movements from Benelux producers proved insufficient to loosen a market already running with thin seasonal inventory buffers. Tied to emissions reporting frameworks, compliance costs added further overhead for regional producers.
Japan:
- In the second quarter of 2026, liquid carbon dioxide prices in Japan held near USD 238/MT, edging up 0.17% QoQ as semiconductor cleaning demand offset softer food processing offtake. Domestic production ran at consistent utilization rates. Managing inventories tightly, distributors limited any meaningful movement in assessed spot values.
- For negotiations, import parity remained a central reference point. Yen weakness raised landed costs on incoming cargoes, though ample domestic recovery from chemical and refining operations kept buyers insulated from the sharper increases recorded elsewhere. Through the period, beverage carbonation volumes tracked seasonal norms without notable acceleration.
Brazil:
- During Q2 2026, liquid carbon dioxide prices in Brazil rose to USD 274/MT, a 6.21% QoQ gain as inter-harvest scheduling at bioethanol mills reduced recoverable fermentation gas. Beverage producers accelerated procurement ahead of contract renewals. In São Paulo, cold chain operators competed for the same constrained merchant volumes.
- Alongside domestic demand, export commitments diverted material from local channels. Currency swings against the dollar complicated import parity calculations, and long inland haulage distances from southern production hubs continued to inflate delivered costs for northern buyers. Across industrial gas supply contracts, traders reported firmer tendering activity.
Drivers Influencing the Market:
Several factors continue to shape liquid carbon dioxide pricing and market behavior:
- Food and Beverage Sector Demand: Carbonated soft drink bottling, brewing, and rapid freezing of meat and seafood together account for a significant share of merchant consumption worldwide across both mature and emerging markets. Within warmer months, seasonal consumption peaks concentrate sharply. Cold chain buildout across emerging economies adds a structural layer of demand that persists regardless of quarterly beverage cycles.
- Upstream Ammonia and Ethanol Feedstock Availability: Merchant liquid carbon dioxide is primarily recovered as a byproduct of ammonia production and bioethanol fermentation. Stable expansion in these industries supports reliable carbon dioxide availability, while maintenance shutdowns, production fluctuations, and changing demand in upstream sectors can periodically tighten supply and influence market stability.
- Energy Expenditure in Compression and Liquefaction: Compression, purification, and refrigeration to cryogenic temperatures consume substantial electricity and natural gas at every liquefaction plant. According to the EIA's July 2026 Short-Term Energy Outlook, Henry Hub natural gas spot prices are projected to average USD 3.67 per MMBtu across the full year. Regional power tariffs widen those cost gaps further. Operating under higher electricity pricing, European producers carry structurally weaker margins than Gulf Coast competitors.
- Cryogenic Freight and Distribution Economics: Insulated cryogenic tankers, pressurized cylinders, and specialized road haulage carry material from recovery sites to end users, and each leg adds cost. Over long delivery distances, boil-off losses impose measurable penalties. Fuel prices, driver availability, and depot turnaround times feed directly into the liquid carbon dioxide price index, particularly across markets where production sits far from consumption centers.
- Environmental and Regulatory Compliance: Food grade and medical grade certification requires documented purity testing, traceability records, and periodic facility audits that raise operating overhead for producers. Beyond certification, pressure vessel rules govern storage and transport. Carbon capture incentives introduce a countervailing force, since subsidized capture projects can expand merchant availability in regions where policy support proves durable enough to attract investment.
- Trade Policy and Currency Dynamics: Import duties, export licensing, and cross-border movement restrictions shape how freely recovered gas travels between adjacent markets. For import dependent buyers, currency depreciation raises landed costs. Producers quoting in dollars gain pricing advantage when local currencies weaken, though procurement teams in those markets often respond by shortening contract tenors and hedging exposure more aggressively.
Recent Highlights & Strategic Developments:
Recent strategic moves within the industry further illustrate evolving dynamics:
- In December 2025, Air Products South Africa obtained SANAS accreditation covering verification and repair of cryogenic and liquid carbon dioxide flowmeters. The approval strengthened locally available compliant measurement capability for liquid CO2 systems.
- In November 2025, Technip Energies Loading Systems secured a contract to supply three fully electric marine loading arms qualified for liquid carbon dioxide transfer duties. Phase 2 of the Northern Lights transport and storage project at Øygarden, Norway would deploy the equipment.
Outlook & Strategic Takeaways:
Looking ahead, the liquid carbon dioxide market is expected to expand steadily through 2034, supported by cold chain investment, medical gas consumption, and growing carbon capture utilization streams. Byproduct availability from ammonia and bioethanol producers will remain the decisive variable shaping the liquid carbon dioxide price forecast.
To navigate this complex landscape, stakeholders should:
- Monitor Regional Price Differentials: Track quarterly movements across the USA, Germany, India, Japan, and Brazil to locate favorable sourcing windows. Establish benchmarking protocols that compare landed cost against prevailing regional contract settlements.
- Track Feedstock Plant Schedules: Map planned turnarounds at regional ammonia and bioethanol facilities that supply recovered merchant gas. Align inventory builds with the published maintenance calendar to avoid exposure during predictable supply gaps.
- Assess Distribution Cost Structures: Evaluate haulage distances, boil-off allowances, and depot turnaround performance across current suppliers. Renegotiate delivery terms where transport inefficiency inflates landed cost without improving service reliability.
- Evaluate Downstream Demand Signals: Monitor beverage bottling schedules, cold storage utilization, and semiconductor fabrication activity across principal consuming regions. Correlate those indicators with the liquid carbon dioxide price per MT recorded in each market before timing purchases.
- Review Certification and Compliance Costs: Audit purity testing, traceability documentation, and pressure vessel inspection expenditure across the supply base. Identify duplicated procedures that raise overhead without strengthening food grade or medical grade assurance.
- Strengthen Currency Exposure Management: Implement hedging cover for purchases denominated in volatile currencies to stabilize budgeted landed costs. Coordinate treasury and procurement calendars so foreign exchange coverage matches anticipated payment schedules.
Subscription Plans & Customization:
IMARC offers flexible subscription models to suit varying needs:
- Monthly Updates: 12 deliverables/year
- Quarterly Updates: 4 deliverables/year
- Biannual Updates: 2 deliverables/year
Each includes detailed datasets (Excel + PDF) and post-report analyst support.

.webp)
Get in Touch With Us
UNITED STATES
Phone: +1-201-971-6302
INDIA
Phone: +91-120-433-0800
UNITED KINGDOM
Phone: +44-753-714-6104
Email: [email protected]
Client Testimonials




.webp)




.webp)












