EDTA Prices Update 2026: Latest Regional Trends and Pricing Outlook Revealed
27-Aug-2026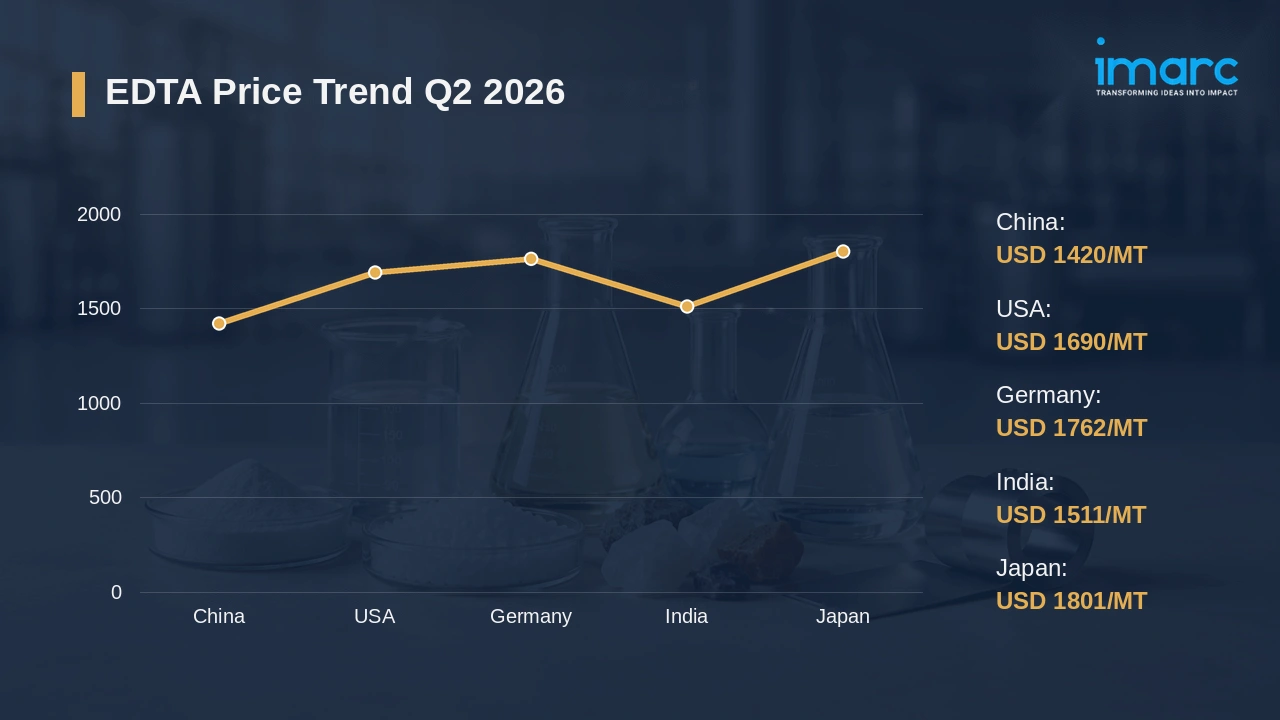
EDTA is a chelating agent used to bind metal ions, commonly found in industrial, pharmaceutical, and medical applications. Available as crystalline or liquid form, EDTA is derived from ethylenediamine, formaldehyde, and sodium cyanide. Key end-use sectors include agriculture, water treatment, personal care, and food preservation. Electricity and natural gas are significant energy inputs in its production, influencing EDTA prices alongside upstream feedstock costs, environmental compliance, and market demand trends.
Global Market Overview:
Globally, the EDTA industry was valued at USD 2.2 Billion in 2025. Market projections indicate steady growth, with the industry expected to reach USD 3.2 Billion by 2034, with a compound annual growth rate (CAGR) of 4.65% during 2026-2034. Consistent demand from agriculture, water treatment, and food industries anchors the EDTA price trend. Expanding application in environmental and health sectors steadily broadens demand. Regulatory compliance and sustainable solutions sustain momentum across regions.
EDTA Price Trend Q2 2026:
Regional prices (USD per MT) and QoQ changes Q2 2026 vs Q1 2026:
| Region | Price (USD/MT) | QoQ Change | Direction |
|---|---|---|---|
| China | 1,420 | +2.92% | ↑ |
| USA | 1,690 | +2.43% | ↑ |
| Germany | 1,762 | +2.44% | ↑ |
| India | 1,511 | +2.79% | ↑ |
| Japan | 1,801 | +2.31% | ↑ |
To access real-time prices Request Sample
What Moved Prices:
China:
- During Q2 2026, EDTA prices in China ascended to USD 1,420/MT driven by firm agricultural and industrial uptake. The continued expansion of environmental and health initiatives bolstered demand, reinforcing higher pricing across diverse sectors.
- Manufacturers ramped up production to match the rising demand, maintaining competitive value propositions. Price stabilization efforts aligned with ongoing market expansion, reflecting supportive economic and policy environments. Market interest remained robust, underpinning the quarterly price advance.
USA:
- In Q2 2026, EDTA prices in the USA rose to USD 1,690/MT as the water treatment and pharmaceutical sectors stimulated purchase volumes. Robust industrial activity and increased application in new sectors drove a positive pricing trend across domestic markets through the quarter.
- Strong demand growth supported higher spot activity as buyers sought stable supply channels. Rising production costs pushed offers upward, and suppliers capitalized on buoyant demand levels. The EDTA price chart reflected a clear upward trajectory as producers observed sustained order flow.
Germany:
- In the second quarter of 2026, EDTA prices in Germany edged higher to USD 1,762/MT amid steady industrial and water treatment demand. Strategic sourcing and inventory planning aligned with broader sectoral growth, supporting healthy procurement practices.
- Sustainable local manufacturing and consistent supply facilitated strategic purchasing decisions. Increased input costs and regulatory shifts drove upward pricing adjustments, strengthening supplier relationships. Diversity in end-use applications encouraged price competitiveness while nurturing consistent market growth.
India:
- During Q2 2026, EDTA prices in India went up to USD 1,511/MT, fueled by dynamic demand in agriculture and water treatment. Expansion in core sectors sustained elevated procurement, driving active market participation and price escalation.
- Solid domestic distribution networks ensured steady supply throughout the period, reinforcing EDTA price strength. Progressive sector investment and reform policies aligned with ongoing economic growth, motivating buyers to secure regular volumes and maintain balanced stocks.
Japan:
- In Q2 2026, EDTA prices in Japan increased to USD 1,801/MT as medical and environmental applications reflected heightened demand consistency. Procurement activities mirrored macroeconomic recovery trends, leading to overarching demand strengthening.
- Manufacturers adjusted offers to reflect incremental cost rises, fostering reliable supply chain management. Diversified end-user engagement and rising input costs contributed to the quarterly upward trajectory in pricing dynamics.
Drivers Influencing the Market:
Several factors continue to shape EDTA pricing and market behavior:
- Environmental and Regulatory Compliance: EDTA's role in reducing heavy metal toxicity across sectors drives regulatory adoption, boosting market demand. Compliance-related purchases sustained momentum through 2026, encouraging competitive pricing offers and strategic supplier positioning. Strengthening adherence to environmental policies has fortified EDTA's market presence.
- Upstream Ethylenediamine and Formaldehyde Costs: Feedstock economics anchor EDTA production expenses, with ethylenediamine and formaldehyde values shaping supplier margins. Declining ethylenediamine costs have eased production economics, feeding into lower finished offers. Crude oil movements and related feedstock availability continue to sway the EDTA price index across producing regions.
- Energy Expenditure in Production: Natural gas and electricity costs govern energy-intensive EDTA production stages, including reaction, concentration, crystallization, and spray-drying. Per the EIA's August 2026 Short-Term Energy Outlook, the Henry Hub spot price is projected to average USD 2.87 per Million Btu in Q3 2026, reflecting record inventories that have tempered near-term gas pricing. Regional electricity structures vary considerably. Lower gas costs offer partial margin relief, though electricity rate disparities across producing regions partially offset this benefit.
- Ocean Freight and Logistics: Across key Asia-to-Europe and Transpacific corridors, container shipping rates directly influence EDTA landed costs. Drewry's World Container Index registered USD 4,339 per 40ft container on August 13, 2026, representing elevated freight benchmarks that sustain high CIF-landed cost structures for buyers importing Chinese-origin EDTA. Throughout Q2 2026, freight costs stayed elevated. Route-specific surcharges add to total landed cost calculations, reinforcing pricing floors for import-dependent markets.
- Environmental and Regulatory Compliance: Tightening rules on chemical handling, storage, and emissions raise compliance spending for producers and distributors. Registration, labeling, and worker-exposure requirements under chemical safety frameworks add administrative and testing costs. These expenses filter progressively into pricing, most visibly across jurisdictions enforcing stringent environmental and occupational standards.
- Trade Policy and Currency Dynamics: Import tariffs, export allocations, and shifting trade terms redirect regional supply and influence landed cost competitiveness. Currency swings against the US dollar alter procurement economics for buyers in Asia and Europe. Producers recalibrate offers as exchange-rate volatility and policy adjustments reshape cross-border margins through each quarter.
Recent Highlights & Strategic Developments:
Recent strategic moves within the industry further illustrate evolving dynamics:
- In April 2026, a published review emphasized the growing application of EDTA beyond its conventional function as a chelating agent. Researchers observed that EDTA and its salts exhibit antibacterial, antifungal, and antibiofilm effects against a wide variety of pathogens. The research indicated that EDTA can boost the efficacy of natural treatments and traditional antibiotics, especially towards multidrug resistant bacteria. The analysis also highlighted EDTA’s capacity to decrease heavy metal toxicity via chelation, reinforcing its ongoing significance in medical, industrial, and environmental uses.
Outlook & Strategic Takeaways:
Looking ahead, the EDTA market is expected to expand steadily through 2034, supported by sustained demand in medical, industrial, and environmental sectors alongside broadening applications. Feedstock and energy cost trajectories will remain the pivotal variable shaping the EDTA price forecast across supplier margins and regional competitiveness.
To navigate this complex landscape, stakeholders should:
- Monitor Regional Price Differentials: Track quarterly variations across China, USA, Germany, India, and Japan to locate cost-saving procurement windows. Benchmark landed costs against prevailing contract rates before committing volumes.
- Assess Freight Market Developments: Monitor container rate trends on Asia-Europe and transpacific corridors to anticipate landed cost shifts. Negotiate logistics contracts with adjustment clauses tied to prevailing spot market conditions.
- Evaluate Downstream Demand Indicators: Track medical, industrial, and environmental order books across principal consuming regions. Align procurement cycles with observed demand signals to avoid overstocking during soft periods.
- Review Feedstock and Energy Cost Trends: Monitor ethylenediamine and natural gas benchmarks that steer the EDTA price per MT. Adjust sourcing timing as input cost movements reshape supplier offers.
- Strengthen Currency Exposure Management: Implement hedging for procurement denominated in volatile currencies to stabilize landed cost projections. Coordinate treasury and procurement functions to align coverage with import payment timelines.
- Explore Emerging Application Segments: Investigate growth potential in specialty medical applications and environmental remediation for portfolio diversification. Engage research partners to assess commercial viability of novel formulations.
Subscription Plans & Customization:
IMARC offers flexible subscription models to suit varying needs:
- Monthly Updates: 12 deliverables/year
- Quarterly Updates: 4 deliverables/year
- Biannual Updates: 2 deliverables/year
Each includes detailed datasets (Excel + PDF) and post-report analyst support.

Get in Touch With Us
UNITED STATES
Phone: +1-201-971-6302
INDIA
Phone: +91-120-433-0800
UNITED KINGDOM
Phone: +44-753-714-6104
Email: [email protected]
Client Testimonials




.webp)




.webp)












