Wheat Price Increases 4.6% in USA, 3.2% in Canada — Q1 2026 Update
20-May-2026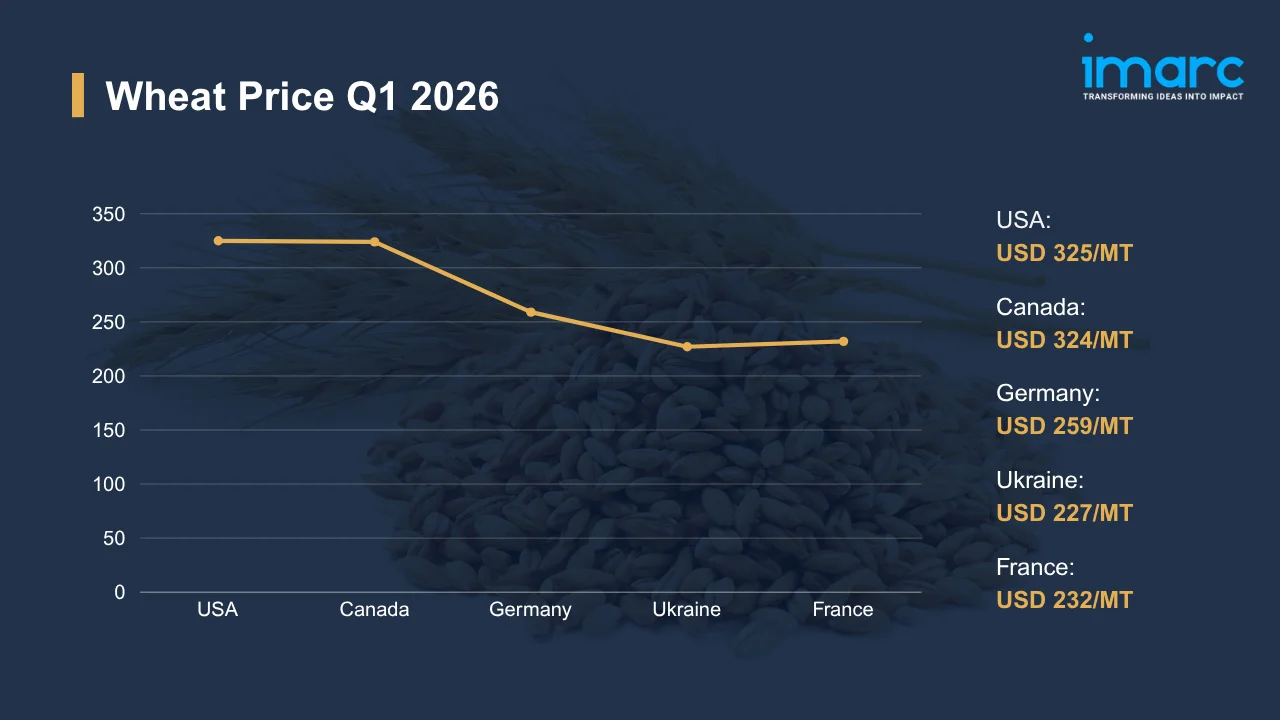
Summary:
Q1 2026 delivered a firmer outcome for wheat, as four of five tracked markets advanced on consistent milling demand. Active export inquiries supported wheat prices through January. Quarter-on-quarter, prices moved between a 1.5% decline and a 4.6% gain across tracked markets. Geopolitical pressures reshaped the broader cost backdrop. Brent crude climbed about 3% in late April 2026 to close at USD 105.07 per barrel, as Strait of Hormuz tensions reignited concerns across global energy benchmarks and grain logistics costs.
Wheat Price Q1 2026:
Regional prices (USD per MT) and QoQ changes Q1 2026 vs Q4 2025:
| Region | Price (USD/MT) | QoQ Change | Direction |
|---|---|---|---|
| USA | 325 | +4.6% | ↑ Growth |
| Canada | 324 | +3.2% | ↑ Growth |
| Germany | 259 | +1.9% | ↑ Growth |
| Ukraine | 227 | -1.5% | ↓ Decline |
| France | 232 | +2.2% | ↑ Growth |
To access real-time prices Request Sample
Kindly note: IMARC’s pricing database tracks wheat price movements across major global markets.
What Moved Prices:
USA:
- At USD 325/MT through Q1 2026, wheat values in the USA gained 4.6% QoQ as flour milling and export-channel pull held firm. Active tender inquiries from Asian and Middle Eastern buyers tightened the spot pipeline. Disciplined farm-gate selling, steady Gulf Coast logistics, and competitive freight benchmarks helped exporters secure offtake commitments.
- Domestic mill draw and steady export offtake kept the spot pipeline tight. The wheat price chart shows a stepwise upward grind through February. Hard Red Winter premiums firmed against alternative origins, Pacific Northwest rail held workable schedules, and converter buyers leaned on contract coverage rather than spot bids to manage rising landed costs.
Canada:
- In Q1 2026, wheat prices in Canada rose to USD 324/MT, marking a 3.2% QoQ gain. Sustained export demand and steady processor draw underpinned momentum. Through the Prairies, disciplined farm deliveries kept the spot pipeline manageable, while strong Asian and Middle Eastern tender inquiries reinforced pricing power for high-protein spring origins.
- Stable CAD dynamics kept landed prices competitive for overseas buyers. Prairie elevator throughput stayed orderly all quarter. With domestic milling demand providing a consistent floor and Vancouver rail capacity supporting timely loadings, buyer sentiment held constructive as international tenders consistently allocated volumes to Canadian-origin high-protein spring wheat.
Germany:
- During Q1 2026, wheat prices in Germany advanced to USD 259/MT, registering a 1.9% QoQ gain. Steady draw from milling, bakery, and food manufacturing supported regional bid levels. Across European origins, balanced supply availability shaped buying cycles, while elevated freight costs and competitive Black Sea offers framed the broader sourcing landscape.
- Mittelstand millers and bakery groups maintained measured procurement throughout the quarter. Sourcing stayed largely within established annual contracts. EU sustainability mandates and grading requirements pushed the buying mix toward higher-protein origins, while Rhine corridor logistics held workable, cushioning landed costs even as pan-European freight surcharges climbed sharply through March.
Ukraine:
- In the first quarter of 2026, wheat prices in Ukraine slipped to USD 227/MT, marking a 1.5% QoQ decline. Softer export buying interest and persistent logistical constraints pressured offers. Across Black Sea corridors, shipping disruptions and cautious procurement sentiment narrowed near-term offtake, with traders prioritizing immediate operational coverage over forward positioning.
- Geopolitical considerations weighed on shipment economics. War-risk insurance premiums and routing complexity stacked onto landed costs. Buyers across North Africa and Asia diversified sourcing toward origins with clearer freight visibility, while subdued bidding from key importers, paired with cautious financing on grain trade letters of credit, kept the Ukrainian market on a softer footing.
France:
- In Q1 2026, wheat prices in France climbed to USD 232/MT, posting a 2.2% QoQ gain. Consistent draw from domestic milling and active export channels lifted quarterly bids. Across the Mediterranean export window, North African tender activity from Algerian and Moroccan buyers reinforced bid intensity for soft milling wheat through January and February.
- Rouen port loadings remained the primary export gateway. Through the quarter, throughput aligned with Algerian and Moroccan tender schedules. Bakery-driven milling cycles kept baseline draw consistent, while elevated EU energy and freight costs trimmed processor margins, and trade flow visibility improved through March, encouraging measured forward contracting by importers in Casablanca and Algiers.
Wheat Price Outlook After the Israel–Iran–USA Conflict:
Rising Energy and Fertilizer Costs Pressuring Wheat Production Economics: Energy and fertilizer cost economics are restructuring rapidly across wheat production zones. FOB granular urea in Egypt jumped from USD 400-490 per metric ton before the war to roughly USD 700 by late March 2026, signaling a sharp reset across nitrogen-intensive farming. Wheat farm-gate values might lift accordingly.
Regional Demand Shifts and Wheat Price Volatility Across Importing Markets: Across import-dependent economies, geopolitical risk premiums might keep wheat values choppy. Buyers across North Africa and the Middle East reliant on Black Sea origins will reassess sourcing geographies as freight, insurance, and routing economics shift, opening the door for North American and Australian origin redirection. Asian milling demand might stay resilient through 2026.
Immediate Market Reaction:
Wheat markets are reacting quickly as the conflict stretches into its second month and shifts maritime risk dynamics across the region. Across Black Sea origins, spot offers are reshaping fast. North African and Middle Eastern buyers are diversifying tender exposure toward North American and European supply. Layered effects from fuel surcharges, slower vessel turnaround, and elevated war-risk insurance premiums are absorbed in the wheat price index. Routes connecting Gulf-region transshipment hubs with East African and South Asian destinations might face the sharpest near-term disruption, with bid-ask spreads widening as importers reassess delivery commitments and vessel schedules.
Impact on Wheat Prices:
The conflict might trigger several key changes in the wheat market:
- Energy-Linked Production Cost Inflation: Higher diesel, natural gas, and fertilizer costs flowing from the conflict will lift on-farm wheat production economics across major grower geographies, including the US Plains and the EU. Margins might tighten across all grower regions. Growers facing squeezed economics might delay sales or hold grain at the farm gate, supporting firmer cash bids as elevators and exporters compete for available physical wheat.
- Shipping Disruption and Risk Premium Widening: Tanker, bulk, and container congestion across the Strait of Hormuz, Red Sea, and Bab el-Mandeb will inflate landed wheat costs for North African and Middle Eastern importers. Carriers might reroute around the Cape of Good Hope. Bulk grain freight from Black Sea origins will tighten as routing adds 10-14 days to transit, pushing CIF wheat values higher across affected destinations through Q2 and beyond.
- Sourcing Diversification and Origin Premiums: Importers might rebalance sourcing toward North American, Australian, and Argentine origins to reduce Black Sea shipping exposure. This rotation will lift origin-specific demand quickly. US Hard Red Winter and Canadian high-protein grades will see firmer FOB premiums at Gulf and Vancouver loadings, while South American supply might tighten as Brazilian and Mexican millers compete for the same alternative volumes.
Layered together, these forces will likely embed a structural premium in wheat through 2026 unless the conflict de-escalates rapidly. The overall risk profile remains structurally elevated. Procurement teams might struggle to lock stable forward pricing as freight, fertilizer, and energy markets reset, while physical wheat flows reorganize around lower-risk corridors and alternative origin suppliers.
Supply Chain Disruptions:
Wheat trade routes are already feeling acute pressure from disrupted shipping nodes. Across the Eastern Mediterranean, Black Sea grain corridors, transshipment hubs, and Suez-routed bulk freight remain heavily exposed to ongoing maritime risk. A large number of merchant vessels remain stranded in the Persian Gulf, while shipping lines face rising operational costs due to ongoing disruptions. These bottlenecks are expected to continue pushing up landed wheat costs for import-dependent markets.
Alternative routing around the Cape of Good Hope is adding 10-14 days to Asia-Europe wheat consignments and inflating bunker fuel costs. Producers might build regional inventory buffers near exporting hubs to cushion delivery rhythm. Importers will lean more heavily on annual rather than spot volumes to control budget exposure, while smaller-scale grain traders might struggle to absorb higher working capital demands, potentially reshaping competitive dynamics across the global grain procurement marketplace through the second half of 2026.
Global Market Overview:
Globally, the wheat industry was valued at USD 52.4 Billion in 2025. Market projections indicate steady growth, with the industry expected to reach USD 76.7 Billion by 2034, with a compound annual growth rate (CAGR) of 4.20% during 2026-2034. Population growth, urbanization, and dietary shifts toward processed staples sustain consumption baselines. Industrial bakery expansion, milling efficiency advances, and biofuel-grade demand are reshaping the wheat price trend, while trade policy and climate volatility frame production decisions across major grower geographies.
Recent Highlights & Strategic Developments:
Recent strategic moves within the industry further illustrate evolving dynamics:
- In October 2025, the Cabinet Committee on Government Purchase of Bangladesh authorized the procurement of around 220,000 metric tons of American wheat via a government-to-government deal. This acquisition was part of a strategy to ease trade conflicts with Washington, which had emerged after the import tariffs set by President Donald Trump’s administration. The agreement was viewed as a tactical step to bolster bilateral ties and guarantee a consistent wheat supply.
Wheat Price Forecast (2026):
Wheat values through mid-to-late 2026 will remain sensitive to evolving energy markets, fertilizer cost trajectories, and the cadence of geopolitical de-escalation. Procurement caution might persist among major importers. Harvest expectations from the Northern Hemisphere will compete with conflict-driven freight premiums, setting near-term price floors and ceilings across global wheat trade lanes.
Should hostilities intensify further, wheat values will likely face renewed upward pressure as fertilizer, fuel, and shipping costs climb in tandem. Growers in conflict-exposed corridors might cut planting acreage. Conversely, a sustained de-escalation might ease landed costs across import-dependent regions and restore Black Sea trade rhythm, allowing wheat to drift back toward pre-conflict ranges by Q4 2026. Procurement teams should track these scenarios closely against the wheat price forecast.
Strategic Takeaways:
Looking ahead, the wheat market is expected to remain volatile through 2026 as conflict-driven cost pressures meet evolving harvest fundamentals across major exporting regions. Procurement strategy must balance near-term cost containment with longer-term resilience, recognizing that energy, fertilizer, and shipping disruptions might reshape global sourcing economics across commodity cycles.
To navigate this complex landscape, stakeholders should:
- Monitor Regional Price Differentials: Track quarterly wheat benchmarks across the major Plains, Prairie, EU, and Black Sea origins to identify cost-saving procurement windows. Establish landed-cost benchmarking that compares CIF and FOB rates across alternative loading ports and entry channels.
- Monitor Geopolitical Risk Exposure: Track escalation dynamics in the current conflict and assess how shifts in hostility levels might affect wheat pricing, feedstock availability, and logistics costs. Establish internal alert thresholds that trigger procurement or hedging action when needed.
- Diversify Supply Chain Routes: Evaluate alternative sourcing geographies and shipping corridors to reduce dependence on conflict-exposed trade lanes. Secondary supplier agreements and contingency freight arrangements will provide resilience if primary routes face sustained disruption across the trading year.
- Adjust Procurement Strategy for Conflict Conditions: Adopt flexible contract structures with price reopener clauses and force majeure provisions to protect against geopolitical price spikes. Precautionary inventory buffers might reduce exposure if supply tightens abruptly across major exporting origins through the year.
- Track Upstream Feedstock Costs: Monitor fertilizer (urea, ammonia, potash), diesel, and natural gas benchmarks that drive farm-gate economics. Building visibility into wheat price per MT correlations against these inputs will sharpen forward procurement decisions and budget planning across cycles.
- Monitor Regulatory and Trade Policy Shifts: Track export quotas, import tariffs, and food security measures from major exporting and importing governments that might reshape wheat flow economics. Regulatory updates can trigger sudden volume reallocations across origins, requiring agile response protocols.
Subscription Plans & Customization:
IMARC offers flexible subscription models to suit varying needs:
- Monthly Updates — 12 deliverables/year
- Quarterly Updates — 4 deliverables/year
- Biannual Updates — 2 deliverables/year
Each includes detailed datasets (Excel + PDF) and post-report analyst support.

.webp)
Get in Touch With Us
UNITED STATES
Phone: +1-201-971-6302
INDIA
Phone: +91-120-433-0800
UNITED KINGDOM
Phone: +44-753-714-6104
Email: [email protected]
Client Testimonials




.webp)




.webp)












