
Oncology Active Pharmaceutical Ingredients (APIs) Market Report by Drug Type (Innovative Oncology APIs, Generic Oncology APIs), Manufacturer Type (Captive Manufacturers, Merchant Manufacturers), Type of Synthesis (Synthetic Oncology APIs, Biotech Oncology APIs), Indication (Lung Cancer, Breast Cancer, Colorectal Cancer, Prostate Cancer, Stomach Cancer, Liver Cancer, Esophagus Cancer, Cervical Cancer, and Others), and Region 2026-2034
Market Overview:
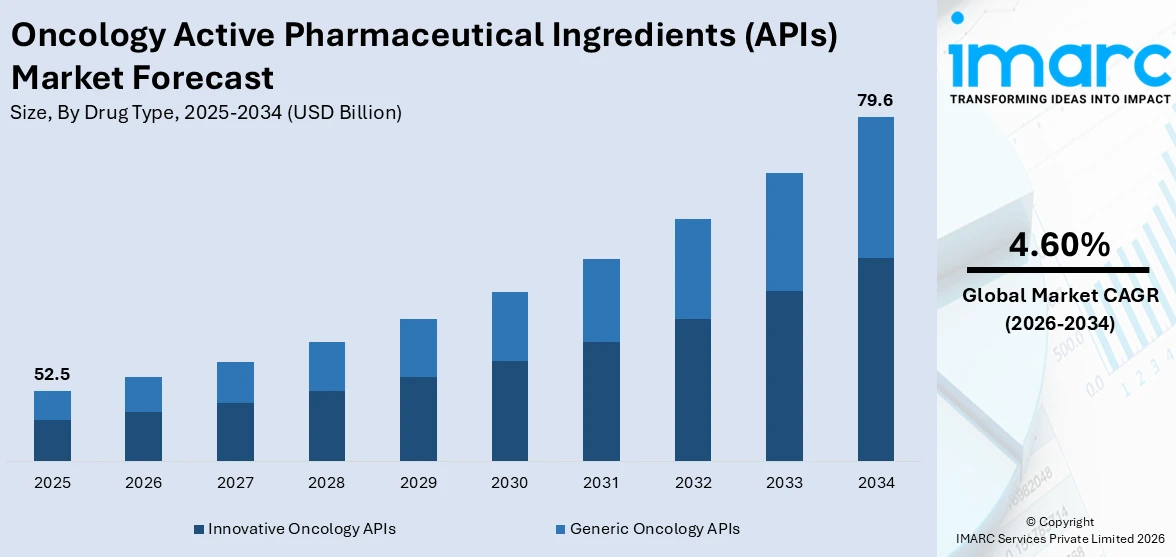
The global oncology active pharmaceutical ingredients (APIs) market size reached USD 52.5 Billion in 2025. Looking forward, IMARC Group expects the market to reach USD 79.6 Billion by 2034, exhibiting a growth rate (CAGR) of 4.60% during 2026-2034. The growing prevalence of cancer, rising preference for target therapies and personalized medicines that tailor the specific needs of patients, and advancements in medical technology for effective outcomes are some of the major factors propelling the market.
|
Report Attribute
|
Key Statistics
|
|---|---|
|
Base Year
|
2025 |
|
Forecast Years
|
2026-2034
|
|
Historical Years
|
2020-2025
|
| Market Size in 2025 | USD 52.5 Billion |
| Market Forecast in 2034 | USD 79.6 Billion |
| Market Growth Rate 2026-2034 | 4.60% |
Oncology active pharmaceutical ingredients (APIs) are essential pharmaceutical products that are designed to treat various forms of cancer. They are the biologically active substances that deliver the intended therapeutic effects. They play a vital role in the development of cancer treatments and serve as the core ingredient responsible for targeting and combating cancer cells. They are carefully developed, synthesized, and tested to ensure safety, efficacy, and compliance with regulatory standards. As they assist in improving the life of individuals suffering from cancer, the demand for oncology APIs is rising across the globe.
To get more information on this market Request Sample
At present, the growing demand for reliable and effective treatment solutions among individuals is offering a positive market outlook. In addition, the rising emergence of immunotherapy that requires specialized APIs to modulate immune responses and ensure effective treatment solutions around the world is propelling the growth of the market. Apart from this, the growing demand for oncology APIs that can address the specific needs of elderly patients while minimizing side effects is positively influencing the market. In line with this, the rising development of advanced biologic therapies that exhibit high specificity and potency against cancer cells is contributing to the growth of the market. Besides this, the increasing number of clinical trials for novel oncology treatments across the globe is supporting the growth of the market. Furthermore, the rising integration of technologies, such as artificial intelligence (AI) and machine learning (ML) in drug discovery is strengthening the growth of the market.
Oncology Active Pharmaceutical Ingredients (APIs) Market Trends/Drivers:
Rising prevalence of cancer
The rising demand for oncology APIs due to the increasing incidence of various cancer types among the masses around the world is contributing to the growth of the market. People are increasingly suffering from cancer due to demographic shifts, lifestyle changes, poor dietary habits, and limited physical activity. In addition, there is an urgent need for effective treatments to address this health challenge among individuals. Apart from this, various players are developing therapies that can combat different cancer forms, stages, and mutations, which is offering a positive market outlook. Furthermore, there is an increase in the demand for APIs, as they assist in providing improved patient outcomes.
Increasing preference for target therapies and personalized medicines
The increasing preference for targeted therapies and personalized medicine among individuals is bolstering the growth of the market. In line with this, these therapies focus on addressing specific genetic and molecular alterations driving cancer growth by offering higher efficacy and reducing side effects as compared to conventional treatments. This trend has encouraged the development of APIs that can precisely target these genetic anomalies and necessitating a new generation of specialized active ingredients. Apart from this, the customization of treatments based on individual patient characteristics underscores the importance of diverse and adaptable APIs and prompting increased research and production, which is contributing to the growth of the market.
Advancements in Medical Technology
Various manufacturers are continuously advancing in research methodologies and technological tools to improve the development of oncology APIs. Apart from this, from high-throughput screening techniques to advanced molecular modeling, these innovations advance the discovery and design of APIs with enhanced efficacy and specificity. In line with this, these technologies allow for the identification of novel molecular targets and enable the creation of more targeted and potent oncology treatments, which is bolstering the growth of the market. Consequently, pharmaceutical companies are investing heavily in research activities to utilize these advancements and offer new and improved oncology APIs solutions to individuals suffering from this life-threatening disease.
Oncology Active Pharmaceutical Ingredients (APIs) Industry Segmentation:
IMARC Group provides an analysis of the key trends in each segment of the global oncology active pharmaceutical ingredients (APIs) market report, along with forecasts at the global, regional, and country levels for 2026-2034. Our report has categorized the market based on drug type, manufacturer type, type of synthesis, and indication.
Breakup by Drug Type:
- Innovative Oncology APIs
- Generic Oncology APIs
Innovative oncology APIs represent the largest market segment
The report has provided a detailed breakup and analysis of the market based on the drug type. This includes innovative oncology APIs and generic oncology APIs. According to the report, innovative oncology APIs represented the largest segment. Innovative oncology APIs comprise a category of specialized active ingredients that are designed to target specific cancer-related pathways and mechanisms. These APIs serve as the core components in the development of groundbreaking cancer treatments, such as targeted therapies, immunotherapies, and precision medicines. Innovative oncology APIs are carefully engineered to interact with specific molecular targets unique to cancer cells as compared to traditional APIs. This precision enhances treatment efficacy while minimizing damage to healthy tissues and providing improved patient outcomes and reduced side effects.
Breakup by Manufacturer Type:
Access the comprehensive market breakdown Request Sample
- Captive Manufacturers
- Merchant Manufacturers
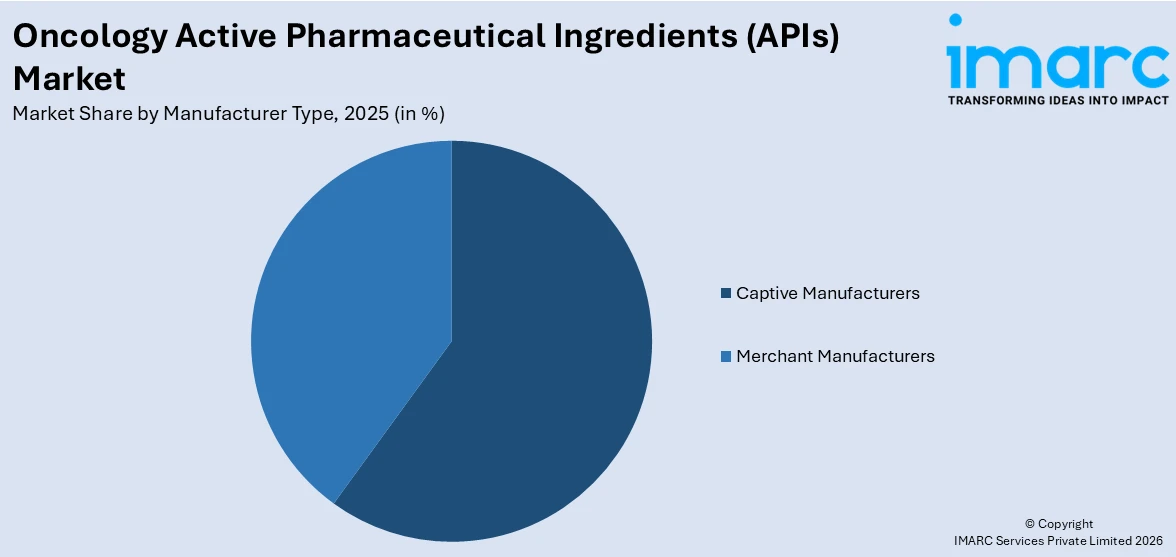
Captive manufacturers accounts for the majority of the market share
The report has provided a detailed breakup and analysis of the market based on the manufacturer type. This includes captive manufacturers and merchant manufacturers. According to the report, captive manufacturers represented the largest segment. Captive manufacturers, also known as in-house manufacturers, are pharmaceutical companies that produce APIs exclusively for their own use in drug formulations. These manufacturers integrate API production into their vertically integrated operations. In addition, this approach offers benefits, such as quality control, cost optimization, and reduced reliance on external suppliers. Captive manufacturers align API production with their specific drug development strategies and enable them to tailor APIs to their formulations and therapeutic targets. This practice enhances proprietary drug development and accelerates time-to-market for new therapies.
Breakup by Type of Synthesis:
- Synthetic Oncology APIs
- Biotech Oncology APIs
Synthetic oncology APIs holds the largest market share
The report has provided a detailed breakup and analysis of the market based on the type of synthesis. This includes synthetic oncology APIs and biotech oncology APIs. According to the report, synthetic oncology APIs represented the largest segment. Synthetic oncology APIs are a category of active ingredients that are chemically synthesized through laboratory processes. This approach involves designing and creating API molecules from basic chemical compounds and allows for precise control over their structure and properties. Synthetic APIs are known for their well-defined characteristics, reproducibility, and scalability, which are crucial factors in pharmaceutical manufacturing. They play a vital role in producing a wide range of cancer therapies, from conventional chemotherapy agents to targeted treatments. Their controllable nature facilitates optimization for efficacy, safety, and stability.
Breakup by Indication:
- Lung Cancer
- Breast Cancer
- Colorectal Cancer
- Prostate Cancer
- Stomach Cancer
- Liver Cancer
- Esophagus Cancer
- Cervical Cancer
- Others
Lung cancer dominates the market share
The report has provided a detailed breakup and analysis of the market based on the indication. This includes lung cancer, breast cancer, colorectal cancer, prostate cancer, stomach cancer, liver cancer, esophagus cancer, cervical cancer, and others. According to the report, lung cancer represented the largest segment. APIs designed for lung cancer treatment comprises a wide spectrum that target various subtypes, such as non-small cell lung cancer (NSCLC) and small cell lung cancer (SCLC). These APIs play a crucial role in developing therapies tailored to specific molecular alterations, such as epidermal growth factor receptor gene (EGFR) mutations or anaplastic lymphoma receptor tyrosine kinase gene (ALK) rearrangements, which are prevalent in NSCLC. In addition, the emergence of lung cancer therapies and immunotherapies further encourage the development of specialized APIs.
Breakup by Region:
- North America
- United States
- Canada
- Asia Pacific
- China
- Japan
- India
- South Korea
- Australia
- Indonesia
- Others
- Europe
- Germany
- France
- United Kingdom
- Italy
- Spain
- Russia
- Others
- Latin America
- Brazil
- Mexico
- Others
- Middle East and Africa
- Turkey
- Saudi Arabia
- Others
North America exhibits a clear dominance, accounting for the largest oncology active pharmaceutical ingredients (APIs) market share
The market research report has also provided a comprehensive analysis of all the major regional markets, which include North America (the United States and Canada); Asia Pacific (China, Japan, India, South Korea, Australia, Indonesia, and others); Europe (Germany, France, the United Kingdom, Italy, Spain, Russia, and others); Latin America (Brazil, Mexico, and others); and the Middle East and Africa (Turkey, Saudi Arabia, and Others). According to the report, North America accounted for the largest market share.
North America held the biggest market share due to the improved healthcare infrastructure facilities. In line with this, the rising commercialization of APIs is propelling the growth of the market. Apart from this, favorable regulatory frameworks are contributing to the growth of the market. In addition, the presence of pharmaceutical companies, research institutions, and academic centers specializing in oncology research, is supporting the growth of the market in the region.
Competitive Landscape:
Major manufacturers are investing in research and development (R&D) activities to discover and develop new APIs that target specific cancer pathways and genetic mutations. This involves leveraging advanced technologies, such as computational modeling, high-throughput screening, and structural biology, to identify potential drug candidates. In line with this, companies are focusing on precision medicine approaches that match with the genetic profiles and cancer subtypes of patients. This customization enhances treatment efficacy while minimizing side effects. Apart from this, various key players are advancing research on immunotherapy APIs, such as immune checkpoint inhibitors and CAR-T cell therapies. These treatments utilize the immune system to target and destroy cancer cells, which is positively influencing the market.
The report has provided a comprehensive analysis of the competitive landscape in the market.
Oncology Active Pharmaceutical Ingredients (APIs) Market Report Scope:
| Report Features | Details |
|---|---|
| Base Year of the Analysis | 2025 |
| Historical Period | 2020-2025 |
| Forecast Period | 2026-2034 |
| Units | Billion USD |
| Scope of the Report | Exploration of Historical Trends and Market Outlook, Industry Catalysts and Challenges, Segment-Wise Historical and Predictive Market Assessment:
|
| Drug Types Covered | Innovative Oncology APIs, Generic Oncology APIs |
| Manufacturer Types Covered | Captive Manufacturers, Merchant Manufacturers |
| Types of Synthesis Covered | Synthetic Oncology APIs, Biotech Oncology APIs |
| Indications Covered | Lung Cancer, Breast Cancer, Colorectal Cancer, Prostate Cancer, Stomach Cancer, Liver Cancer, Esophagus Cancer, Cervical Cancer, Others |
| Regions Covered | Asia Pacific, Europe, North America, Latin America, Middle East and Africa |
| Countries Covered | United States, Canada, Germany, France, United Kingdom, Italy, Spain, Russia, China, Japan, India, South Korea, Australia, Indonesia, Brazil, Mexico, Turkey, Saudi Arabia |
| Customization Scope | 10% Free Customization |
| Post-Sale Analyst Support | 10-12 Weeks |
| Delivery Format | PDF and Excel through Email (We can also provide the editable version of the report in PPT/Word format on special request) |
Key Benefits for Stakeholders:
- IMARC’s industry report offers a comprehensive quantitative analysis of various market segments, historical and current market trends, market forecasts, and dynamics of the oncology active pharmaceutical ingredients (APIs) market from 2020-2034.
- The research report study provides the latest information on the market drivers, challenges, and opportunities in the global oncology active pharmaceutical ingredients (APIs) market.
- The study maps the leading, as well as the fastest-growing, regional markets. It further enables stakeholders to identify the key country-level markets within each region.
- Porter's five forces analysis assist stakeholders in assessing the impact of new entrants, competitive rivalry, supplier power, buyer power, and the threat of substitution. It helps stakeholders to analyze the level of competition within the oncology active pharmaceutical ingredients (APIs) industry and its attractiveness.
- Competitive landscape allows stakeholders to understand their competitive environment and provides an insight into the current positions of key players in the market.
Frequently Asked Questions About the Oncology Active Pharmaceutical Ingredients (APIs) Market Report
The global oncology Active Pharmaceutical Ingredients (APIs) market was valued at USD 52.5 Billion in 2025.
We expect the global oncology Active Pharmaceutical Ingredients (APIs) market to exhibit a CAGR of 4.60% during 2026-2034
The rising demand for biologically active drugs with lower dosages as compared to chemotherapy treatments, along with the introduction of oncology drugs with higher efficacy and minimum side effects, is primarily driving the global oncology Active Pharmaceutical Ingredients (APIs) market.
The sudden outbreak of the COVID-19 pandemic had led to the growing number of R&D activities pertaining to specialty generic drugs for combating the spread of the coronavirus infection, thereby negatively impacting the global market for oncology Active Pharmaceutical Ingredients (APIs).
Based on the drug type, the global oncology Active Pharmaceutical Ingredients (APIs) market has been divided into innovative oncology APIs and generic oncology APIs. Currently, innovative oncology APIs exhibit a clear dominance in the market.
Based on the manufacturer type, the global oncology Active Pharmaceutical Ingredients (APIs) market can be categorized into captive manufacturers and merchant manufacturers, where captive manufacturers currently account for the majority of the global market share.
Based on the type of synthesis, the global oncology Active Pharmaceutical Ingredients (APIs) market has been segregated into synthetic oncology APIs and biotech oncology APIs, Currently, synthetic oncology APIs hold the largest market share.
Based on the indication, the global oncology Active Pharmaceutical Ingredients (APIs) market can be bifurcated into lung cancer, breast cancer, colorectal cancer, prostate cancer, stomach cancer, liver cancer, esophagus cancer, cervical cancer, and others. Among these, lung cancer exhibits a clear dominance in the market.
On a regional level, the market has been classified into North America, Asia Pacific, Europe, Latin America, and Middle East and Africa, where North America currently dominates the global market.
Need more help?
- Speak to our experienced analysts for insights on the current market scenarios.
- Include additional segments and countries to customize the report as per your requirement.
- Gain an unparalleled competitive advantage in your domain by understanding how to utilize the report and positively impacting your operations and revenue.
- For further assistance, please connect with our analysts.
 Request Customization
 Speak to an Analyst
 Request Brochure
 Inquire Before Buying
Benefits of Customization
- Personalize this research
- Triangulate with your data
- Get data as per your format and definition
- Gain a deeper dive into a specific application, geography, customer, or competitor
- Any level of personalization
Get in Touch With Us
UNITED STATES
Phone: +1-201-971-6302
INDIA
Phone: +91-120-433-0800
UNITED KINGDOM
Phone: +44-753-714-6104
Email: [email protected]
Client Testimonials


.webp)


