
Resistant Starch Market Size, Share, Trends and Forecast by Source, Process, Application, and Region, 2026-2034
Resistant Starch Market Size and Share:
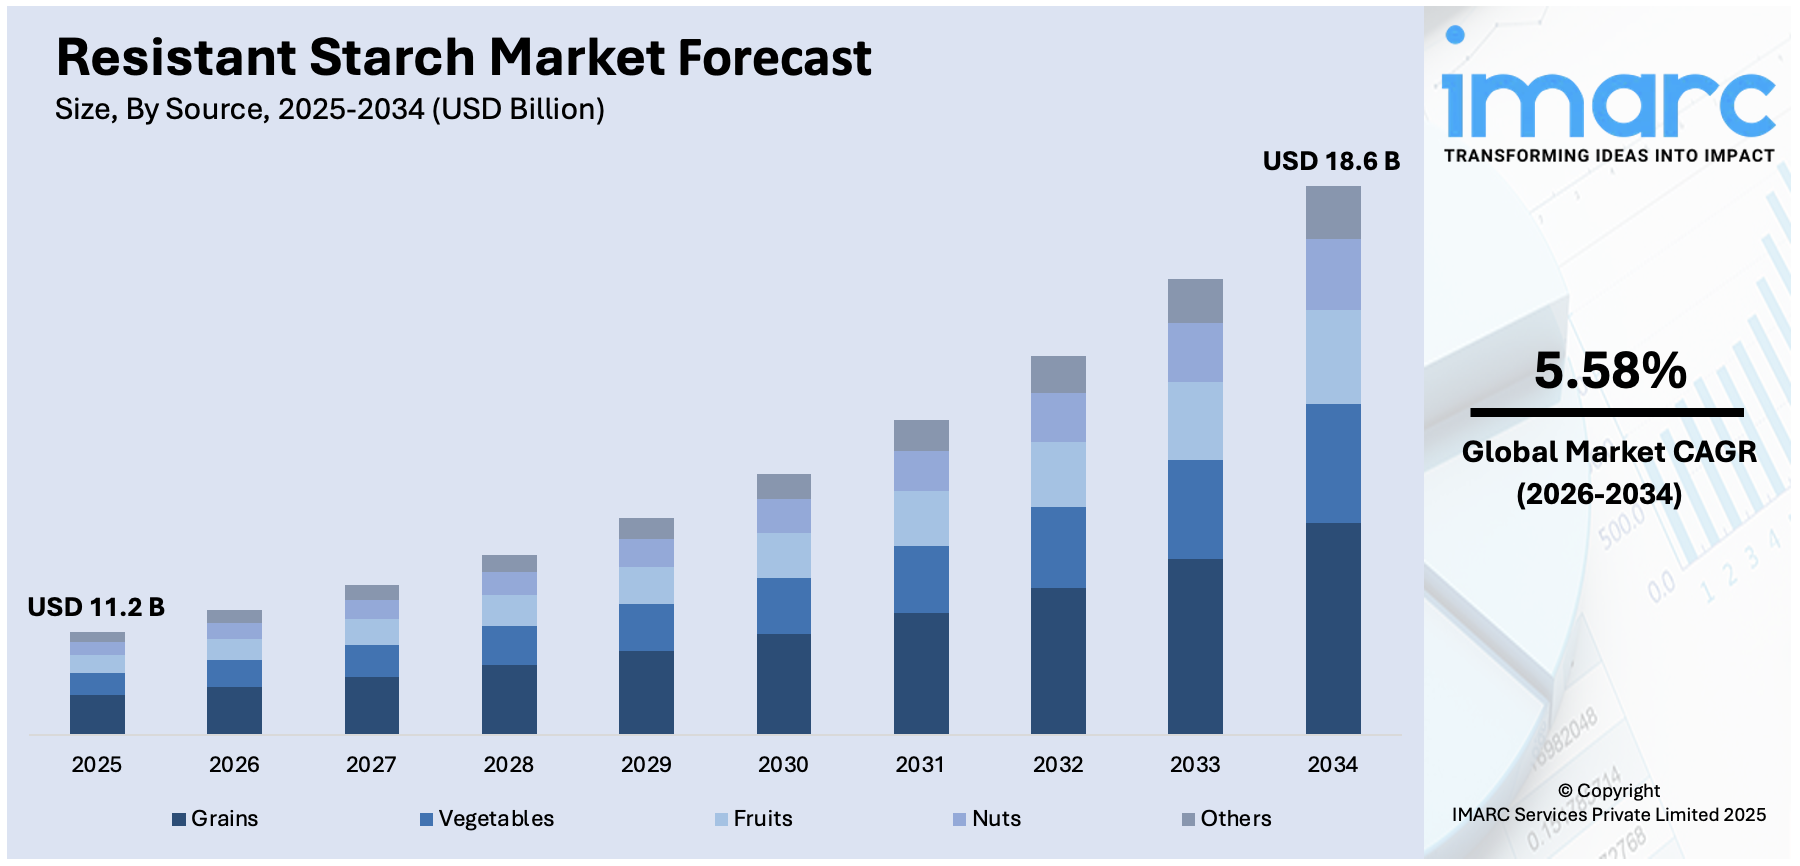
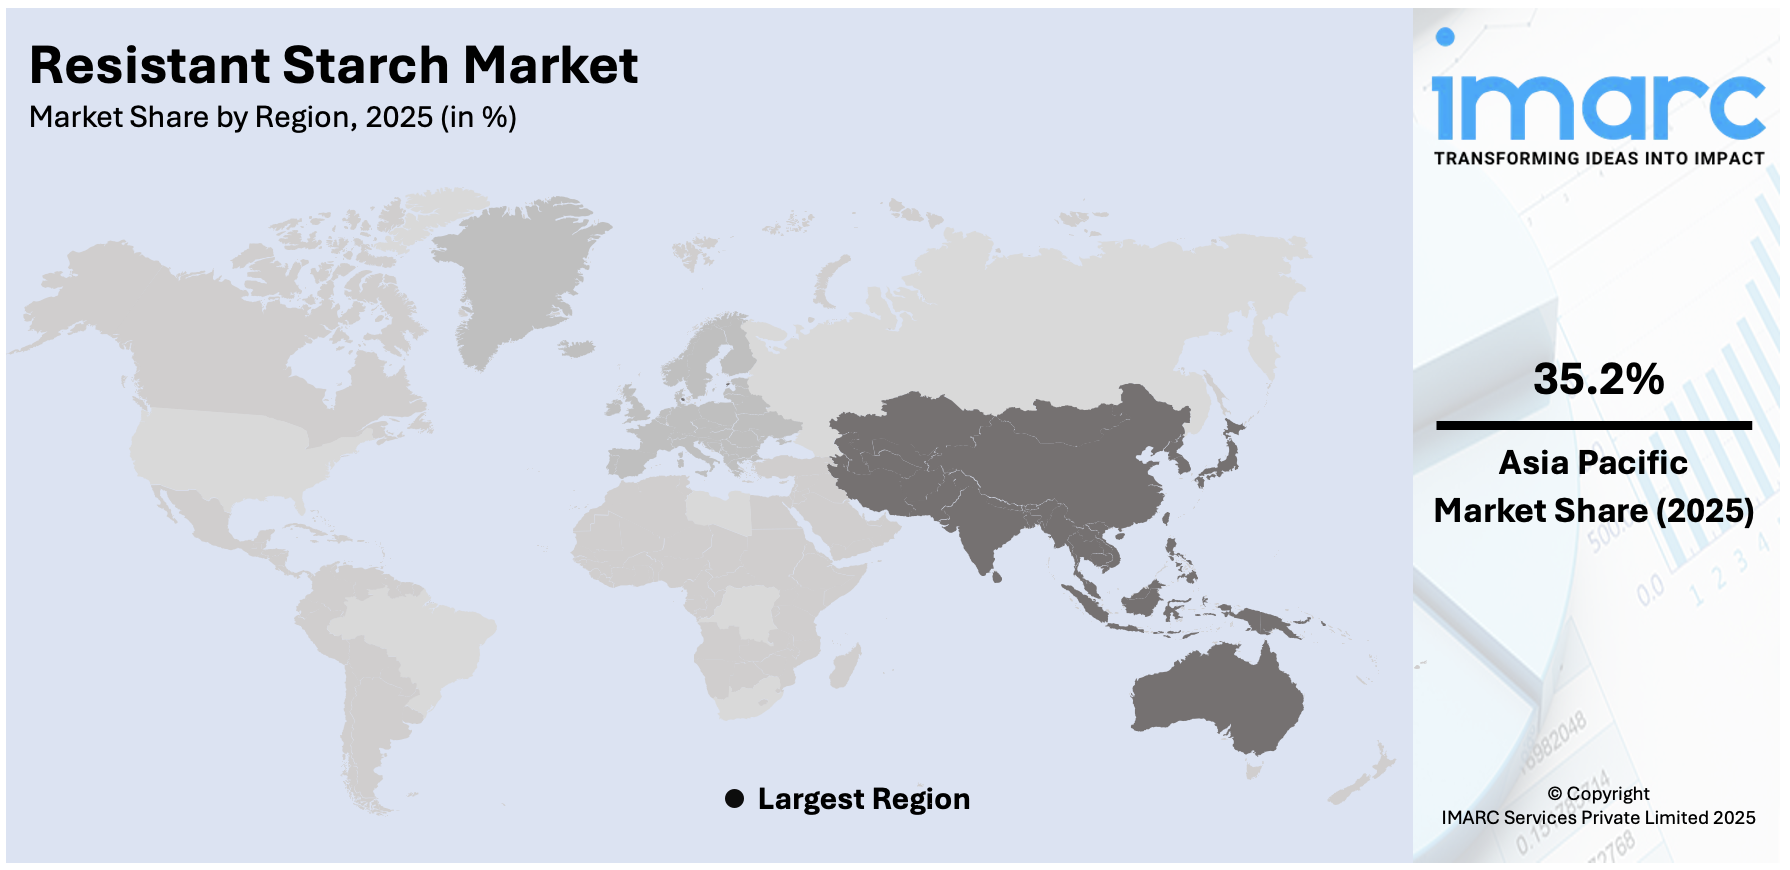
The global resistant starch market size was valued at USD 11.2 Billion in 2025. Looking forward, IMARC Group estimates the market to reach USD 18.6 Billion by 2034, exhibiting a CAGR of 5.58% from 2026-2034. Asia-Pacific currently dominates the market, holding a market share of 35.2% in 2025. At present, the growing awareness about the health benefits offered by resistant starch and the increasing diagnosis of chronic health conditions are positively influencing the market. Besides this, regulatory support and guidelines aimed at facilitating the adoption of functional food items are contributing to the expansion of the resistant starch market share.
|
Report Attribute
|
Key Statistics
|
|---|---|
|
Base Year
|
2025 |
|
Forecast Years
|
2026-2034 |
|
Historical Years
|
2020-2025
|
| Market Size in 2025 | USD 11.2 Billion |
| Market Forecast in 2034 | USD 18.6 Billion |
| Market Growth Rate (2026-2034) | 5.58% |
At present, the market is expanding due to rising awareness about digestive health and the need for functional food ingredients. Products that promote gut health are in high demand, and resistant starch serves as a prebiotic by encouraging the development of good bacteria. It is appropriate for diabetics and those following low-carb diets because it aids in blood sugar regulation. To increase fiber content and improve texture, food makers are using resistant starch in a variety of items, such as cereals, baked goods, and snacks. The demand for resistant starch is further being driven by the rising clean-label trend since it originates from natural sources, including cereals, potatoes, and bananas. People are choosing food items with extra health advantages as they are focusing on managing their weight and general well-being. This growing interest in functional food products continues to drive the market forward.
To get more information on this market Request Sample
The United States has emerged as a major region in the resistant starch market owing to many factors. The rising consciousness about digestive health is offering a favorable resistant starch market outlook. People are becoming aware about the role of gut health in overall wellness, and resistant starch supports this by acting as a prebiotic. It also manages blood sugar and assists in weight control, making it favored by health-conscious people and those regulating diabetes. As per the Centers for Disease Control and Prevention (CDC), in 2024, approximately 14.7% of adults in the US were diagnosed with diabetes. Food companies in the US are incorporating resistant starch into everyday products like bread, snacks, and nutrition bars to meet the high demand for healthier options. The popularity of clean-label and plant-based food items is further boosting the appeal of resistant starch, as it is derived from natural sources, such as corn, potatoes, and legumes.
Resistant Starch Market Trends:
Rising Shift Towards a Healthy Lifestyle
The rapid shift towards a healthy lifestyle is fueling the market growth. According to industry reports, in October 2022, at least 70% of the respondents in the surveyed markets desired to improve their health. Food is essential to achieving that goal, and approximately 50% of the users from various age groups indicated that maintaining a healthy diet was one of their main priorities. This is driving the demand for resistant starch since it supports gut health. Besides this, the growing diagnosis of lifestyle-related health issues, including obesity, diabetes, and digestive disorders, is positively influencing the market. According to the World Health Organization (WHO), in 2022, 1 out of every 8 individuals worldwide was affected by obesity. 2.5 Billion adults aged 18 and older were considered overweight. Among them, 890 Million were impacted by obesity. The rising trend of awareness through numerous channels like social media, mainstream media, and health blogs is catalyzing the demand for resistant starch.
Increasing Demand for Functional and Natural Ingredients
The rising demand for functional and natural ingredients is stimulating the resistant starch market growth. As individuals continuously seek products that provide health benefits beyond basic nutrition, there is an increasing inclination towards ingredients, such as starch. The rising need for clean-label and clean-ingredient products is further influencing the market positively. Individuals are taking a closer look at the labels to avoid artificial additives, synthetic chemicals, and preservatives. Resistant starch is extracted from natural sources, including certain root vegetables, whole grains, and legumes, thereby catering to individuals seeking unprocessed, wholesome ingredients in their food products. For instance, a survey conducted by the Center for Food Integrity in May 2022 discovered that 75% of people identified nutritional ingredient labels on their food products and 53% believed that clean-label products were more nutritious. Significantly, 46% of Americans claimed that the direct accessibility of food components influenced their buying choices and that they were open to spending more on these items. This is expected to fuel the resistant starch market forecast over the coming years.
Growing Diagnosis of Digestive Disorders
The rising diagnosis of digestive disorders across the globe is propelling the growth of the market. Digestive disorders encompass a range of conditions impacting the gastrointestinal tract, such as inflammatory bowel diseases (IBD), Crohn’s disease, ulcerative colitis, irritable bowel syndrome (IBS), and functional constipation. According to the IFFGD, it was estimated that 5-10% of individuals suffered from IBS in 2021. The majority of individuals with IBS were below 50 years old. In the survey conducted by IFFGD, almost 2000 IBS patients indicated that their diagnosis was generally established 6.6 years after the onset of symptoms. Around 20 to 40% of all consultations with gastroenterologists were related to IBS symptoms. As per NIH, the prevalence of IBD was 321.2 per 100,000 in 2021, and when compared to 2006 (200 for every 100,000 individuals), it rose by 46%. Resistant starch supports the growth of beneficial gut bacteria and promotes bowel regularity, making it a natural choice for individuals managing digestive issues. Healthcare professionals increasingly recommend high-fiber diets that include resistant starch to improve digestion without harsh side effects.
Resistant Starch Industry Segmentation:
IMARC Group provides an analysis of the key trends in each segment of the global resistant starch market, along with forecast at the global, regional, and country levels from 2026-2034. The market has been categorized based on source, process, and application.
Analysis by Source:
- Vegetables
- Grains
- Fruits
- Nuts
- Others
Grains naturally contain high amounts of resistant starch, especially in their whole and less processed forms. Common grains like corn, rice, wheat, and barley serve as rich and accessible sources of this beneficial starch. Food manufacturers prefer grains because they are widely cultivated, cost-effective, and easy to incorporate into a variety of products, such as bread, cereals, pasta, and snacks. Grains also offer added nutritional advantages like fiber, vitamins, and minerals, which appeal to health-conscious users. As the demand for functional food items is high, grains have become a preferred choice due to their compatibility with existing dietary habits. The thriving food industry is investing in developing grain-based ingredients that enhance gut health, manage blood sugar, and aid in weight control. Grains are versatile and scalable for production, making them a dominant source in the market. Their health benefits and availability solidify their leading role.
Analysis by Process:
- Biotechnology
- Mutation
- Natural Source
- Others
Biotechnology plays a significant role in the production of resistant starch. Through biotechnological procedures, starches can be modified to increase their resistance to digestion. Enzymatic methods, such as using enzymes like amylase, amylopectin, and amylose, are employed to alter the structure of starch molecules. This process involves breaking down the starch into smaller and more resistant forms, which are less susceptible to digestion in the small intestine.
Mutation is another method used to develop crops with enhanced resistant starch content. This process involves inducing genetic mutations in plants using mutagens, such as radiation and chemicals. By subjecting plants to mutagenesis, researchers can create genetic variations that result in increased levels of resistant starch. Mutation breeding has been utilized to enhance the resistant starch content in staple crops like maize, rice, wheat, and potatoes.
Natural source offers clean-label and chemical-free options that appeal to health-conscious consumers. Resistant starch can be obtained from natural sources without the need for extensive processing. Certain food ingredients, such as green bananas, raw potatoes, and high-amylose corn, naturally contain resistant starch. Natural source provides people with a convenient option to incorporate resistant starch into their diets without relying on synthetic and modified products.
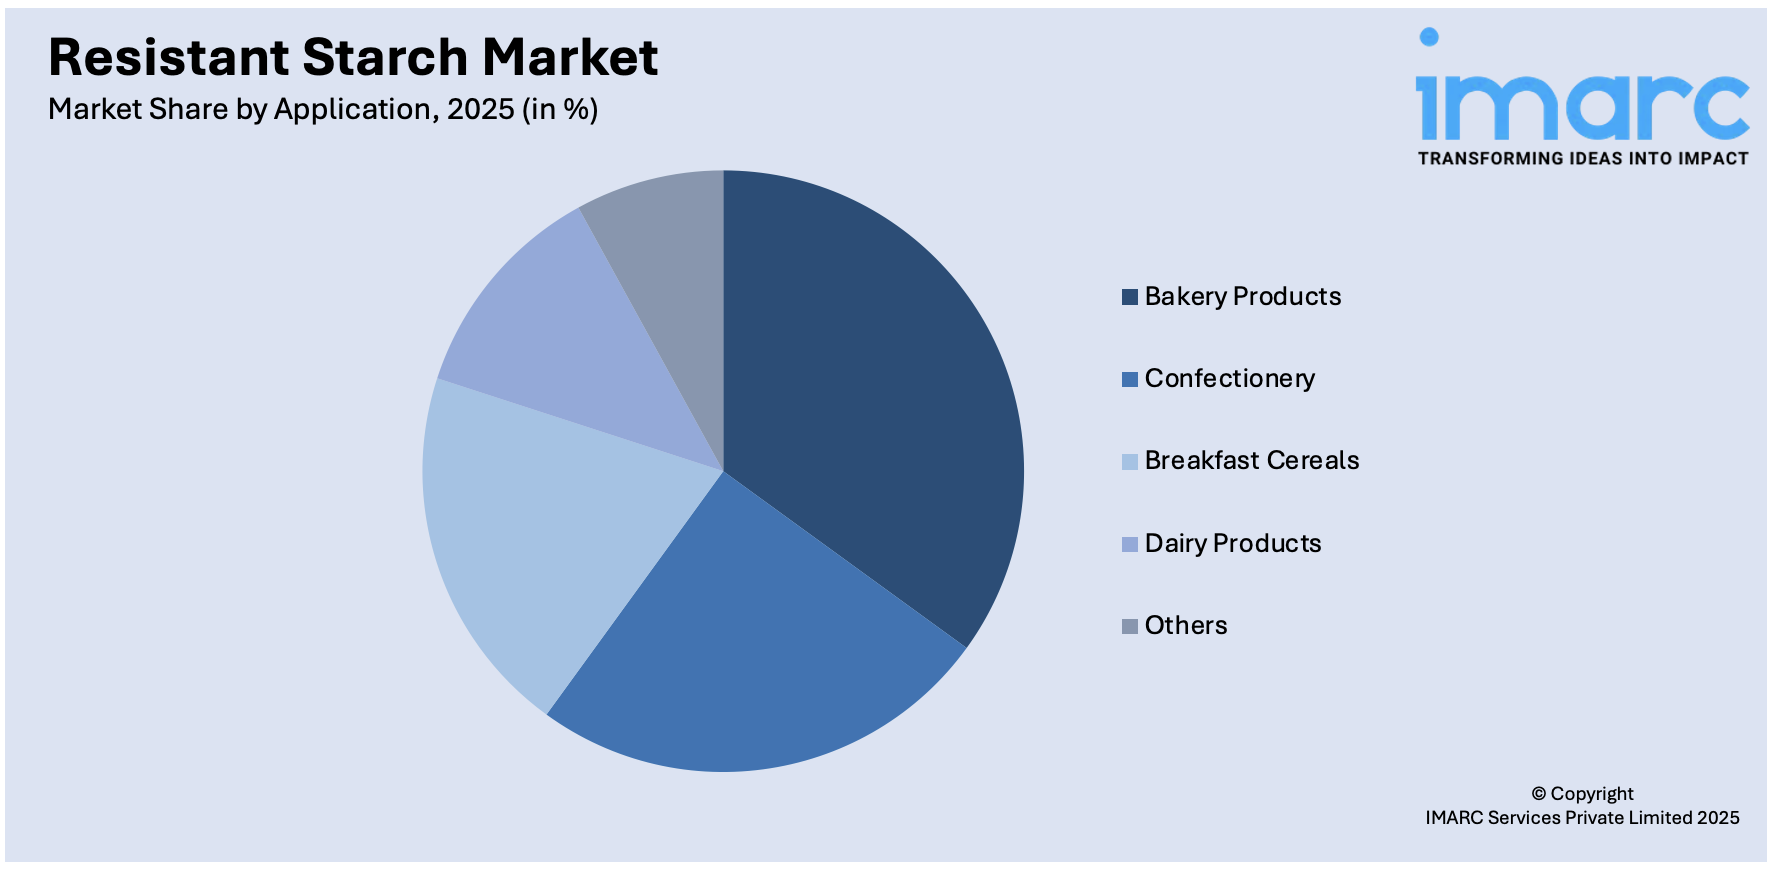
Analysis by Application:
Access the comprehensive market breakdown Request Sample
- Bakery Products
- Confectionery
- Breakfast Cereals
- Dairy Products
- Others
Bakery products hold 32.8% of the market share. They serve as a common and convenient way for people to access functional ingredients. Resistant starch enhances the dietary fiber content in baked goods like bread, muffins, cakes, and cookies without compromising taste or texture. It improves moisture retention and shelf life, which benefits both manufacturers and retailers. The demand for healthier bakery items is growing, as more consumers are seeking food items that promote digestive wellness, manage weight, and regulate blood sugar levels. Resistant starch reduces the glycemic index of baked goods, rendering them appropriate for individuals with diabetes and people adhering to low-carbohydrate diets. It also fits well with clean-label and plant-based trends, as it can be sourced from natural ingredients. Manufacturers are using resistant starch to create value-added bakery products that align with modern health trends. With consistent demand for tasty and nutritious options, bakery products remain the top application, stimulating the growth of the market.
Regional Analysis:
To get more information on the regional analysis of this market Request Sample
- North America
- United States
- Canada
- Asia-Pacific
- China
- Japan
- India
- South Korea
- Australia
- Indonesia
- Others
- Europe
- Germany
- France
- United Kingdom
- Italy
- Spain
- Russia
- Others
- Latin America
- Brazil
- Mexico
- Others
- Middle East and Africa
Asia-Pacific, accounting for a share of 35.2%, enjoys the leading position in the market. The region is noted for its large population, rising health awareness, and changing dietary habits. People in countries like China, India, and Japan, are seeking functional food items that support digestive health and assist in managing lifestyle-oriented conditions like diabetes and obesity. The rising emphasis on preventive healthcare is further driving the demand for resistant starch. According to the IBEF, in 2023, a poll involving over 1000 individuals in India showed that at least 40% of those surveyed strongly favored preventive health. The preventive healthcare industry, covering exercise, wellness, nutrition and supplements, early detection, and health monitoring, is set to attain USD 197 Billion by 2025, with a CAGR of 22%. Traditional diets in the region already include natural sources of resistant starch, such as rice, legumes, and tubers, making the transition to fortified and enhanced food items more acceptable. The rising middle class with higher disposable incomes is catalyzing the demand for healthier food options. Governments and health organizations in the region are promoting balanced diets and fiber intake, which is encouraging the use of ingredients like resistant starch.
Key Regional Takeaways:
United States Resistant Starch Market Analysis
The United States holds 79.80% of the market share in North America. The market is primarily driven by increasing awareness about gut health and the rising demand for functional food items. Resistant starch, known for its prebiotic properties, is gaining popularity due to its ability to enhance digestive well-being by encouraging the development of helpful intestinal bacteria. As people are focusing on maintaining a balanced, healthy diet, resistant starch is being incorporated into various food items, including snacks, baked goods, and cereals. Additionally, the high prevalence of chronic diseases, such as diabetes and obesity, is also promoting the adoption of resistant starch, as it can assist in managing blood sugar levels and providing better metabolic health. According to the Centers for Disease Control and Prevention (CDC), from August 2021 to August 2023, the rate of obesity in adults within the United States was 40.3%. The prevalence was 41.3% for women and 39.2% for men. Additionally, the obesity rate among adults aged 40–59 years was 46.4%, surpassing the rate in adults aged 20–39 years at 35.5% and those aged 60 years and above at 38.9%. Apart from this, innovations in food technology are enabling the manufacturing of new resistant starch-rich items, further expanding their market presence.
Europe Resistant Starch Market Analysis
The Europe market is experiencing robust growth, fueled by increasing demand for clean-label products and the high popularity of functional ingredients. As people have become more discerning about product labels, the demand for minimally processed natural ingredients has risen. Resistant starch, derived from plant-based sources, such as potatoes and corn, fits into this trend, offering an alternative to synthetic additives. This shift towards healthier dietary habits is further supported by the rising prevalence of lifestyle-related diseases like cardiovascular conditions and diabetes. According to the International Diabetes Federation, in 2024, the diabetes prevalence in Europe hit 9.8%, corresponding to 65.6 Million people. This figure is projected to reach 72.4 Million by 2050, reflecting a 10% increase. Additionally, spending on diabetes treatment in the region was around USD 193 Billion in 2024, representing 19% of worldwide spending. Resistant starch aids in regulating blood sugar levels and enhances metabolic health, making it an appealing ingredient for those mindful of their health, particularly individuals with diabetes. Other than this, the rise in plant-based and gluten-free diets is driving the demand for resistant starch, as it is derived from natural and plant-based sources like potatoes, corn, and legumes. European regulations that support clean-label products and transparency in ingredient sourcing are further encouraging food manufacturers to incorporate resistant starch in their offerings.
Asia-Pacific Resistant Starch Market Analysis
In the Asia Pacific region, the market is expanding due to the increasing awareness about the health benefits associated with low-glycemic and high-fiber food items. The high-fiber foods market in India reached USD 0.10 Billion in 2024 and is set to attain USD 0.14 Billion by 2033, growing at a CAGR of 4.32% during 2025-2033, as per the IMARC Group. As health concerns are rising, particularly about digestive health, obesity, and diabetes, there is a growing demand for functional food products that can enhance digestive health, regulate blood glucose levels, and support weight control. Resistant starch, known for its prebiotic properties, is increasingly being incorporated into food items, such as snacks, bakery items, and beverages, to cater to this demand. Besides this, innovations in food processing technology have also expanded the applications of resistant starch, making it more accessible and versatile in the food industry.
Latin America Resistant Starch Market Analysis
The Latin America market is significantly influenced by the increasing focus on clean-label and natural ingredients in food manufacturing. As people are becoming more selective about product content, there is a rising demand for simple plant-based components that offer health benefits without synthetic additives. Resistant starch, sourced from corn, bananas, and tubers, aligns with this preference, making it a popular choice among manufacturers targeting the wellness segment. The market is also supported by the growing middle class, greater access to health information, and local initiatives promoting balanced nutrition and healthy food choices. For instance, in 2018, Brazil ranked as the fifth largest market in the global healthy food industry, exhibiting an average yearly growth rate of 20%, compared to the worldwide average growth rate of 8%.
Middle East and Africa Resistant Starch Market Analysis
In the Middle East and Africa region, the market is being propelled by rising demand for diabetes-friendly and weight-management food products. With increasing rates of lifestyle-related diseases, individuals are seeking dietary solutions that can help regulate glucose levels and support satiety. Resistant starch offers these benefits, making it a favorable ingredient in health-targeted food items. Additionally, regional interest in clean-label and plant-based diets is encouraging food manufacturers to adopt natural ingredients like resistant starch sourced from legumes, maize, and tubers. For instance, according to a 2024 survey conducted by the Middle East Vegan Society, 4.7% of the population in Saudi Arabia adhered to a plant-based diet. Other than this, the market is also benefiting from the gradual development of the food processing industry and increased investments in nutrition-focused innovations across the region’s major economies.
Competitive Landscape:
Key players are introducing advanced formulations that improve the nutritional value and functional properties of food items. These companies focus on clean-label and plant-based solutions to meet evolving consumer preferences. They are collaborating with food manufacturers to integrate resistant starch into everyday items like baked goods, snacks, and beverages. Key players are also generating awareness about the health benefits of resistant starch through marketing campaigns and educational initiatives. Their strong distribution networks help make resistant starch more accessible across regions and industries. Many players are expanding their production capabilities to meet rising demand and improve supply chain efficiency. By maintaining high-quality standards and gaining regulatory approvals, they aim to build trust with consumers and food producers. For instance, in February 2023, Ingredion Incorporated, a top worldwide supplier of specialty ingredient solutions for the food and beverage manufacturing sector and a leader in clean label ingredients, introduced NOVATION Indulge 2940 starch, enhancing their collection of clean label texturizers with the initial non-genetically modified organism (GMO) functional native corn starch that offered a distinctive texture for gelling and co-texturizing in well-liked dairy and alternative dairy items and desserts.
The report provides a comprehensive analysis of the competitive landscape in the resistant starch market with detailed profiles of all major companies, including:
- Arcadia Biosciences Inc.
- Cargill Incorporated
- Gut Garden LLC
- Ingredion Incorporated
- MGP Ingredients Inc.
- Natural Stacks Inc.
- Roquette Freres
- Tate & Lyle Plc
Latest News and Developments:
- April 2025: In partnership with Limagrain Ingredients, Mondelēz International, INRAE, and the University of Clermont Auvergne, Greencell launched the four-year NutriTious project aimed at creating functional and sustainable food items that could improve gut health. The firm developed a biscuit that included flour high in resistant starch, fermentation byproducts abundant in fiber, and a second-generation probiotic strain. Resistant starch acted as a prebiotic, enhancing healthy gut bacteria and supporting blood sugar control.
- February 2025: Researchers at Zhejiang University (ZJU) in China successfully created twelve ultra-high resistant-starch rice germplasms and three varieties of baked rice flour, each containing resistant starch levels exceeding 30%. This diabetes-friendly rice was being developed into high-quality varieties, including Indica-Japonica hybrids and Japonica rice, to meet various customer tastes.
- September 2024: Solnul-resistant potato starch reported that it achieved Master File acceptance from Health Canada, officially recognizing Solnul as a prebiotic ingredient for natural health products. This recognition stemmed from research that demonstrated that 3.5 g of resistant potato starch was the initial low dose of prebiotic resistant starch to show a prebiotic impact in a randomized, placebo-controlled clinical study.
- July 2024: Ingredion launched VERSAFIBE 2470 and 1490, a new series of insoluble resistant starch dietary fibers aimed at enhancing fiber content and reducing calories in products, such as breads, crackers, cookies, pastas, and extruded items. These fibers could preserve the product's texture, flavor, and color, enabling producers to assert ‘good source of fiber’ or ‘gluten-free’ without changing the eating experience.
Resistant Starch Market Report Scope:
| Report Features | Details |
|---|---|
| Base Year of the Analysis | 2025 |
| Historical Period | 2020-2025 |
| Forecast Period | 2026-2034 |
| Units | Billion USD |
| Scope of the Report |
Exploration of Historical Trends and Market Outlook, Industry Catalysts and Challenges, Segment-Wise Historical and Future Market Assessment:
|
| Sources Covered | Vegetables, Grains, Fruits, Nuts, Others |
| Processes Covered | Biotechnology, Mutation, Natural Source, Others |
| Applications Covered | Bakery Products, Confectionery, Breakfast Cereals, Dairy Products, Others |
| Regions Covered | Asia Pacific, Europe, North America, Latin America, Middle East and Africa |
| Countries Covered | United States, Canada, Germany, France, United Kingdom, Italy, Spain, Russia, China, Japan, India, South Korea, Australia, Indonesia, Brazil, Mexico |
| Companies Covered | Arcadia Biosciences Inc., Cargill Incorporated, Gut Garden LLC, Ingredion Incorporated, MGP Ingredients Inc., Natural Stacks Inc., Roquette Freres, Tate & Lyle Plc, etc. |
| Customization Scope | 10% Free Customization |
| Post-Sale Analyst Support | 10-12 Weeks |
| Delivery Format | PDF and Excel through Email (We can also provide the editable version of the report in PPT/Word format on special request) |
Key Benefits for Stakeholders:
- IMARC’s industry report offers a comprehensive quantitative analysis of various market segments, historical and current market trends, market forecasts, and dynamics of the resistant starch market from 2020-2034.
- The research report provides the latest information on the market drivers, challenges, and opportunities in the global resistant starch market.
- The study maps the leading, as well as the fastest-growing, regional markets. It further enables stakeholders to identify the key country-level markets within each region.
- Porter's five forces analysis assists stakeholders in assessing the impact of new entrants, competitive rivalry, supplier power, buyer power, and the threat of substitution. It helps stakeholders to analyze the level of competition within the resistant starch industry and its attractiveness.
- The competitive landscape allows stakeholders to understand their competitive environment and provides insight into the current positions of key players in the market.
Frequently Asked Questions About the Resistant Starch Market Report Report
The resistant starch market was valued at USD 11.2 Billion in 2025.
The resistant starch market is projected to exhibit a CAGR of 5.58% during 2026-2034, reaching a value of USD 18.6 Billion by 2034.
As the demand for clean-label and functional ingredients is rising, food manufacturers are using resistant starch in various products like bread, cereals, snacks, and nutritional supplements. The growing trend of plant-based and low-carb diets is also supporting its utilization, especially as it occurs naturally in food items like green bananas, potatoes, and legumes. In addition, the rising expenditure on food innovations is positively influencing the market.
Asia-Pacific currently dominates the resistant starch market, accounting for a share of 35.2% in 2025, driven by its large population, rising health awareness, and high adoption of traditional diets that are rich in resistant starch. Increasing demand for functional food items and the growing investments in food innovations are further supporting the market growth across the region.
Some of the major players in the resistant starch market include Arcadia Biosciences Inc., Cargill Incorporated, Gut Garden LLC, Ingredion Incorporated, MGP Ingredients Inc., Natural Stacks Inc., Roquette Freres, Tate & Lyle Plc, etc.
Need more help?
- Speak to our experienced analysts for insights on the current market scenarios.
- Include additional segments and countries to customize the report as per your requirement.
- Gain an unparalleled competitive advantage in your domain by understanding how to utilize the report and positively impacting your operations and revenue.
- For further assistance, please connect with our analysts.
 Request Customization
 Speak to an Analyst
 Request Brochure
 Inquire Before Buying
Benefits of Customization
- Personalize this research
- Triangulate with your data
- Get data as per your format and definition
- Gain a deeper dive into a specific application, geography, customer, or competitor
- Any level of personalization
Get in Touch With Us
UNITED STATES
Phone: +1-201-971-6302
INDIA
Phone: +91-120-433-0800
UNITED KINGDOM
Phone: +44-753-714-6104
Email: [email protected]
Client Testimonials


.webp)


