
Singapore Soft Drinks Market Size, Share, Trends and Forecast by Product, Distribution Channel, and Region, 2026-2034
Singapore Soft Drinks Market Size, Share, Trends & Forecast (2026-2034)
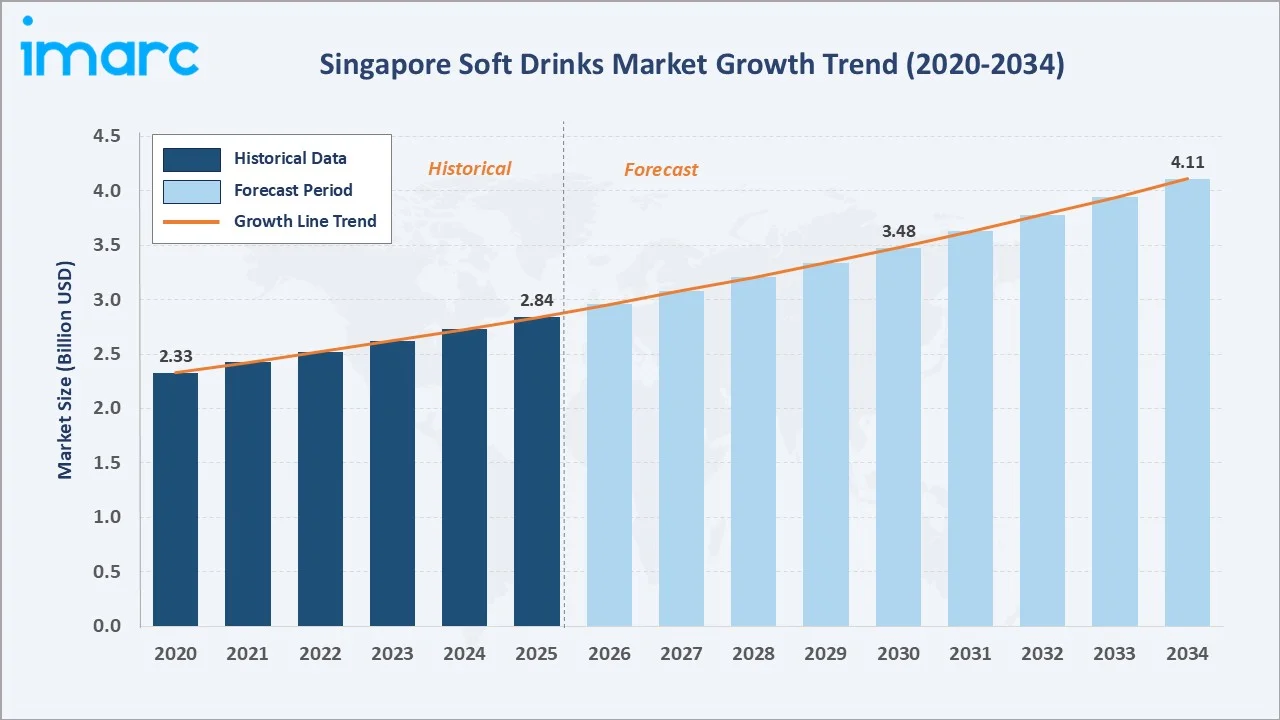
The Singapore soft drinks market reached USD 2.84 Billion in 2025 and is projected to reach USD 4.11 Billion by 2034, growing at a CAGR of 4.10% during 2026-2034. Rising health consciousness and low-sugar reformulation are driving expansion.
Non-Carbonated drinks lead the product mix at 56.8% in 2025. Hypermarkets and supermarkets remain the top distribution channel at 38.6%, while the Central region commands the largest regional share at 36.5% of national demand.
Market Snapshot
|
Metric |
Value |
|
Market Size (2025) |
USD 2.84 Billion |
|
Forecast Market Size (2034) |
USD 4.11 Billion |
|
CAGR (2026-2034) |
4.10% |
|
Base Year |
2025 |
|
Historical Period |
2020-2025 |
|
Forecast Period |
2026-2034 |
|
Dominant Product |
Non-Carbonated (56.8%, 2025) |
|
Dominant Distribution Channel |
Hypermarkets and Supermarkets (38.6%, 2025) |
|
Leading Region |
Central (36.5%, 2025) |
The market expanded from an estimated USD 2.33 Billion in 2020 to USD 2.84 Billion in 2025, aided by post-pandemic recovery in retail consumption and steady category reformulation. Growth is anchored at USD 3.48 Billion by 2030 and forecast to reach USD 4.11 Billion by 2034, reflecting a consistent, regulation-shaped expansion path across the historical and forecast periods. This trajectory underscores the market's resilience despite periodic input cost and regulatory pressures.
To get more information on this market, Request Sample
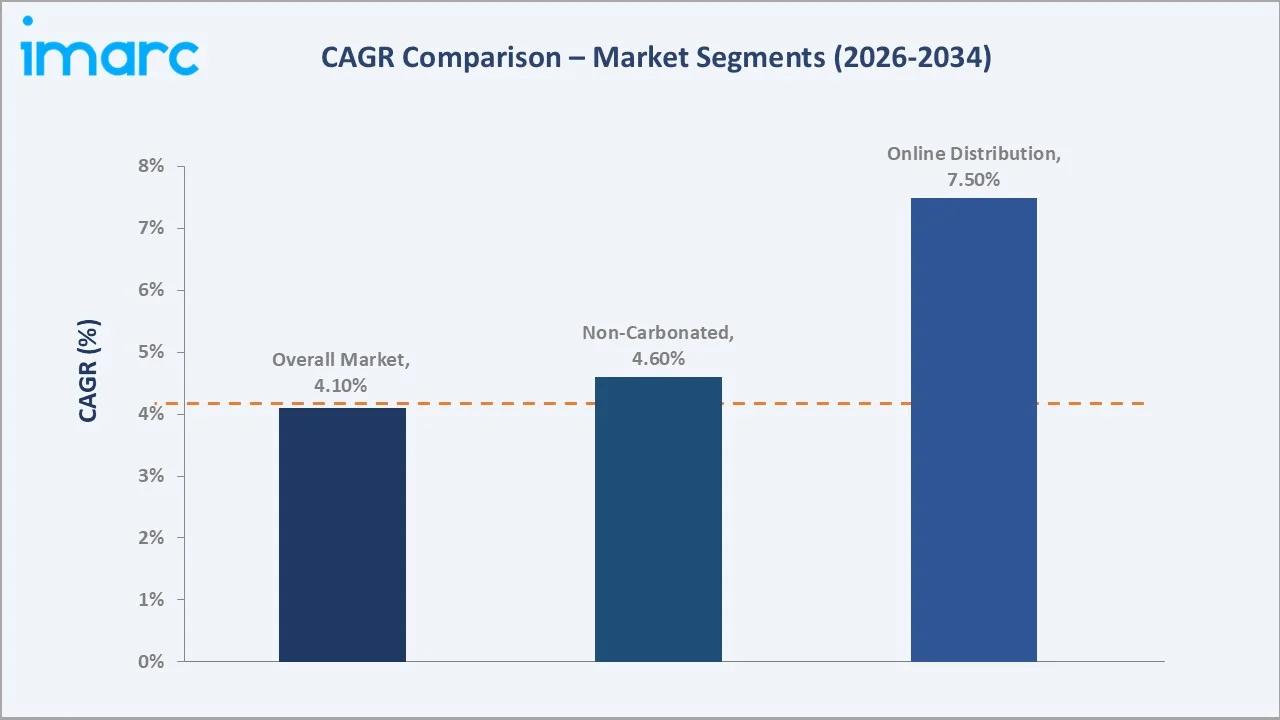
Non-Carbonated products grow faster at an estimated 4.6% CAGR as health-driven reformulation accelerates category share gains. The Online distribution channel expands fastest at approximately 7.5% CAGR, reflecting Singapore's high e-commerce penetration and increasing preference for scheduled, doorstep beverage delivery among urban households.
Executive Summary
The Singapore soft drinks market reached USD 2.84 Billion in 2025, reflecting a mature, regulation-influenced industry shaped by the Nutri-Grade labelling system and evolving consumer preferences for low-sugar and functional beverages. The market is projected to reach USD 4.11 Billion by 2034.
Non-Carbonated products at 56.8% dominate through sustained reformulation and functional drink launches. Hypermarkets and supermarkets at 38.6% lead distribution through established retail infrastructure, while the Central region at 36.5% leads regionally through population density and retail concentration.
Key Market Insights
|
Insight |
Data |
|
Dominant Product |
Non-Carbonated - 56.8% share (2025) |
|
Dominant Distribution Channel |
Hypermarkets and Supermarkets - 38.6% market share (2025) |
|
Leading Region |
Central - 36.5% market share (2025) |
|
Market Opportunity |
Low/no-sugar reformulation; functional and fortified drinks; e-commerce expansion; sustainable packaging |
Key Analytical Observations Supporting the Above Data:
- Non-Carbonated at 56.8%: dominates as health-conscious consumers shift from sugary carbonates toward juices, RTD tea, flavoured water, and functional drinks, reinforced by Nutri-Grade labelling incentivising reformulation across major manufacturers.
- Hypermarkets and Supermarkets at 38.6%: leads distribution due to wide product assortment and established shopping habits, though online retail is narrowing the gap through convenience and doorstep delivery.
- Central at 36.5%: leads regionally owing to Singapore's highest population density and concentrated retail and F&B infrastructure within the Central Region's commercial catchments.
Singapore Soft Drinks Market Overview
The Singapore soft drinks market encompasses carbonated and non-carbonated beverages sold through hypermarkets, supermarkets, convenience stores, online platforms, and other retail formats across the island's five planning regions. The market's product mix continues to evolve in response to health, regulatory, and lifestyle-driven consumer shifts.
Macroeconomic factors shaping the market include rising disposable income, urban lifestyle patterns, expanding retail infrastructure, and growing digital commerce adoption, all of which continue to influence purchasing frequency and channel preference across Singapore's beverage-consuming population.
Consumer purchasing decisions are also shaped by convenience, price sensitivity, and growing awareness of nutritional labelling, which together continue to redefine assortment planning, promotional strategy, and new product introduction across Singapore's soft drinks retail landscape.
Market Dynamics
To evaluate market opportunities, Request Sample
Market Drivers
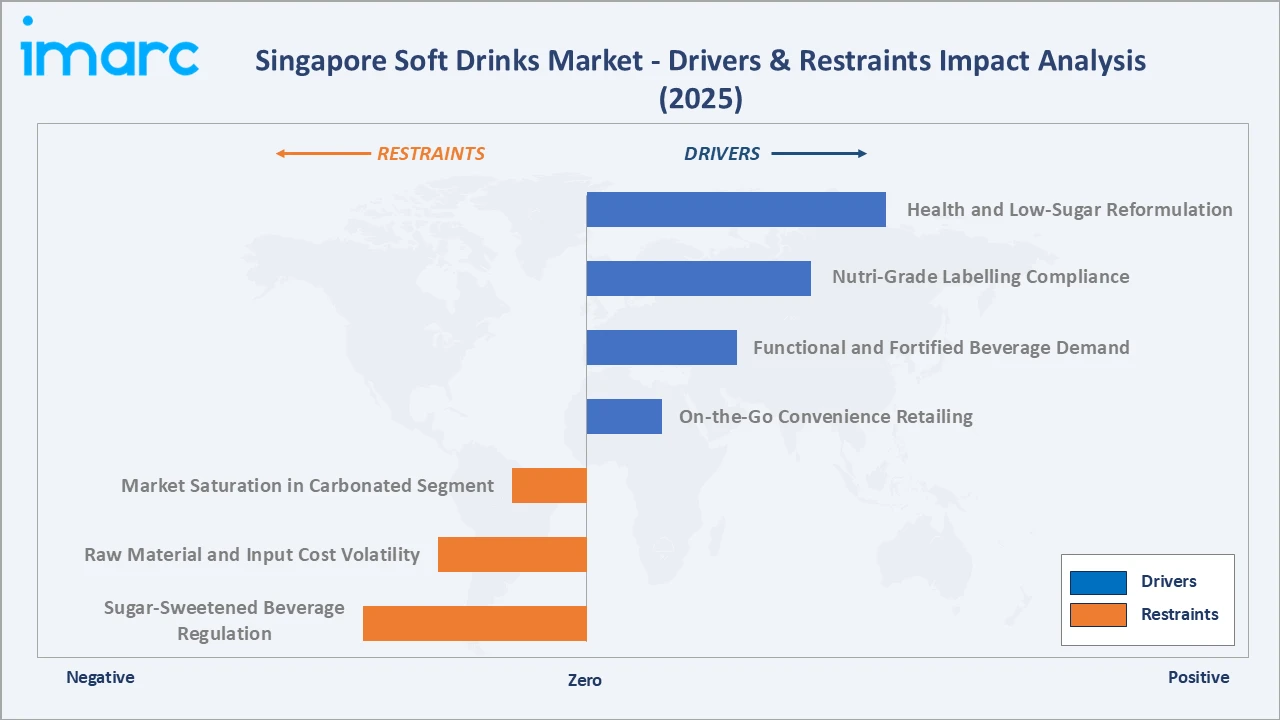
- Health & Low-Sugar Reformulation: Rising consumer health consciousness is pushing manufacturers to reformulate products with reduced sugar and functional ingredients, expanding demand for non-carbonated juices, flavoured water, and RTD tea. Reformulation investment is increasingly viewed as a long-term brand protection strategy rather than a one-time compliance exercise. Manufacturers offering credible low-sugar alternatives are gaining incremental shelf space and consumer trust across major retail formats.
- Nutri-Grade Labelling Compliance: Singapore's mandatory Nutri-Grade labelling for Grade C and D beverages is compelling manufacturers to reformulate sugar-sweetened drinks, accelerating new low-sugar product launches across the market. The framework has also encouraged advertising and promotional restrictions on higher-grade beverages, indirectly steering marketing budgets toward compliant formulations. This regulatory clarity is helping manufacturers plan multi-year reformulation roadmaps with greater confidence.
- Functional & Fortified Beverage Demand: Growing interest in beverages offering hydration, energy, immunity, and wellness benefits is driving launches of fortified waters, probiotic drinks, and vitamin-enhanced beverages. Younger, digitally engaged consumers are particularly receptive to functional positioning backed by visible ingredient transparency. This trend is prompting both multinational and local manufacturers to expand dedicated functional beverage sub-brands.
- On-the-Go Convenience Retailing: Singapore's dense urban lifestyle and long working hours are boosting demand for ready-to-drink beverages through convenience stores, vending machines, and quick-commerce platforms. Compact packaging formats and single-serve offerings are gaining traction among office workers and students seeking fast, portable refreshment options. Retailers are responding by expanding chilled beverage footprint near transit hubs and business districts.
Market Restraints
- Sugar-Sweetened Beverage Regulation: Nutri-Grade labelling and potential future advertising restrictions on Grade D beverages raise compliance costs and reformulation complexity, particularly for smaller manufacturers. Meeting labelling and formulation requirements often demands dedicated regulatory and food-science resources that smaller players may lack. This can slow product launch timelines and increase the cost of maintaining a compliant portfolio.
- Raw Material & Input Cost Volatility: Fluctuating prices of sugar, packaging materials, and imported concentrates increase production costs in a market reliant on imported beverage inputs. Currency movements and global commodity cycles add further unpredictability to manufacturer input budgets. These pressures can compress margins or lead to gradual price adjustments passed on to consumers.
- Market Saturation in Carbonated Segment: Slowing growth in traditional carbonated beverages amid health-driven consumer shifts is limiting expansion for legacy soda brands, requiring portfolio diversification. Established carbonated brands face increasing pressure to innovate through reduced-sugar variants or risk gradual share erosion. This dynamic is reshaping marketing and innovation budgets across the carbonated category.
Market Opportunities
- E-Commerce & Quick-Commerce Expansion: Singapore's high smartphone penetration and growing online grocery adoption present significant opportunity for direct-to-consumer beverage sales and rapid delivery formats. Subscription-based beverage bundles and app-exclusive product variants offer manufacturers new avenues for customer engagement and repeat purchase. Data captured through online channels also enables more precise demand forecasting and targeted promotions.
- Sustainable & Functional Packaging Innovation: Rising demand for recyclable, lightweight packaging creates opportunities for manufacturers to differentiate through sustainability-led product design. Aseptic cartons and reduced-plastic formats are gaining acceptance among environmentally conscious consumers and retailers alike. Early movers in sustainable packaging may benefit from favourable retailer partnerships and enhanced brand positioning.
Market Challenges
- Intense Multinational Competition: Singapore's compact market hosts global beverage giants alongside strong local brands, creating intense price and innovation competition that pressures smaller manufacturers. Shelf space in major retail chains remains limited, making distribution access a persistent challenge for emerging entrants. This competitive intensity often compresses promotional margins across the category.
- Balancing Reformulation with Taste Preference: Reducing sugar content while maintaining consumer taste expectations remains technically challenging, requiring sustained R&D investment. Consumer rejection of reformulated products remains a persistent risk if taste quality is perceived to decline. Manufacturers are increasingly investing in natural sweetener technology to help bridge this gap.
Emerging Market Trends
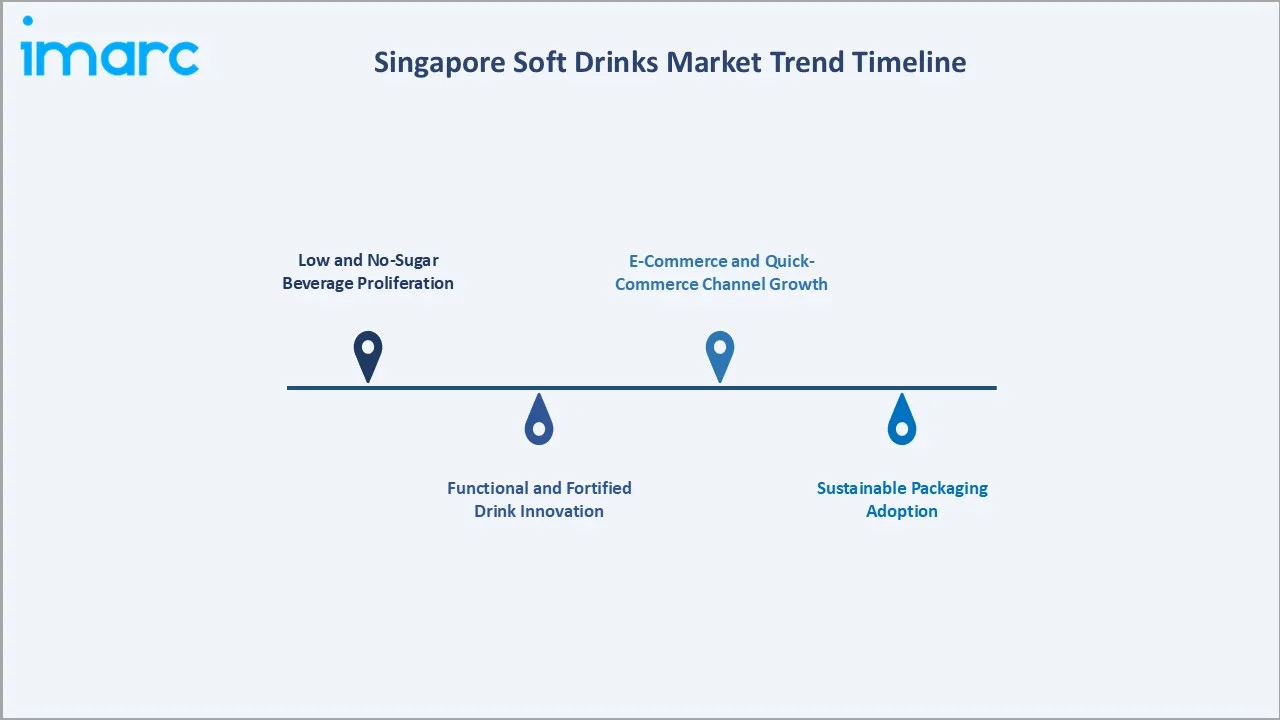
1. Low and No-Sugar Beverage Proliferation
Manufacturers are rapidly expanding zero- and low-sugar product lines across carbonated and non-carbonated categories to align with Nutri-Grade requirements and evolving consumer health preferences, reshaping new product development pipelines industry-wide.
2. Functional and Fortified Drink Innovation
Beverages fortified with vitamins, electrolytes, probiotics, and collagen are gaining traction as consumers seek added wellness benefits beyond basic hydration, prompting both multinational and local brands to expand functional portfolios.
3. Sustainable Packaging Adoption
Growing environmental awareness is driving adoption of recyclable PET, lightweight cans, and reduced-plastic packaging formats, as manufacturers respond to consumer and regulatory pressure for more sustainable beverage packaging solutions.
4. E-Commerce and Quick-Commerce Channel Growth
Online and quick-commerce platforms are becoming increasingly important distribution channels, offering manufacturers direct consumer access, data-driven personalisation, and faster route-to-market for new product launches.
Industry Value Chain Analysis
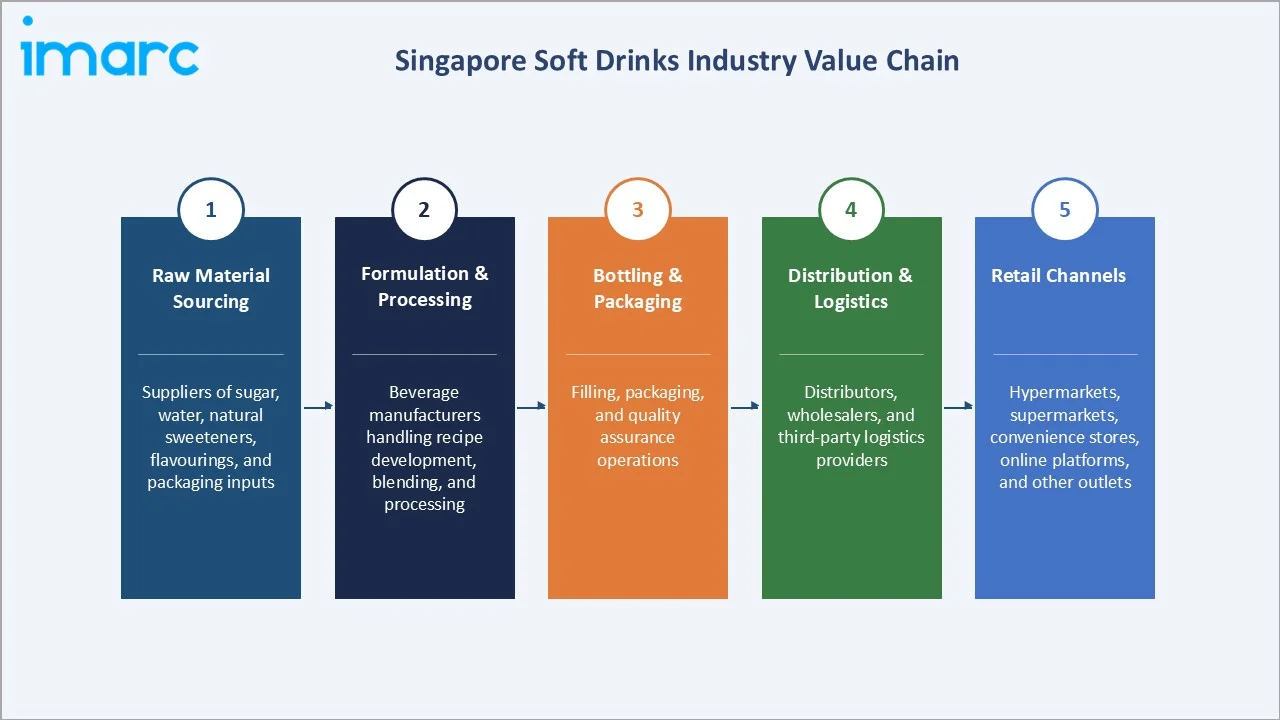
The Singapore soft drinks value chain integrates raw material sourcing, formulation and processing, bottling and packaging, distribution and logistics, and retail channels reaching the end consumer.
|
Stage |
Key Participants |
|
Raw Material Sourcing |
Suppliers of sugar, water, natural sweeteners, flavourings, and packaging inputs |
|
Formulation & Processing |
Beverage manufacturers handling recipe development, blending, and processing |
|
Bottling & Packaging |
Filling, packaging, and quality assurance operations |
|
Distribution & Logistics |
Distributors, wholesalers, and third-party logistics providers |
|
Retail Channels |
Hypermarkets, supermarkets, convenience stores, online platforms, and other outlets |
Formulation and processing form the value chain's most commercially critical stage, as reformulation investment directly determines regulatory compliance and product competitiveness. Distribution and retail channels continue to evolve as online formats gradually gain share from traditional retail. Packaging innovation is also becoming an increasingly influential value chain stage as sustainability expectations rise across the industry.
Technology Landscape in the Singapore Soft Drinks Industry
Low and No-Sugar Sweetener Technology
Advances in natural and alternative sweetener technology, including stevia, monk fruit, and allulose, are enabling manufacturers to reduce sugar content while preserving taste quality. This technology underpins Nutri-Grade compliance and is central to reformulation strategies across both carbonated and non-carbonated categories.
Aseptic & Sustainable Packaging Technology
Aseptic filling and lightweight, recyclable packaging technologies are gaining adoption as manufacturers respond to sustainability expectations and extended shelf-life requirements. These formats support longer distribution chains and reduced material usage, aligning with Singapore's broader packaging sustainability guidelines.
Functional Ingredient Fortification Technology
Fortification technologies enabling stable delivery of vitamins, electrolytes, probiotics, and botanical extracts in ready-to-drink formats are supporting the market's shift toward functional and wellness-positioned beverages, helping manufacturers differentiate beyond traditional flavour-led positioning.
Market Segmentation Analysis
The report covers the following segments:
|
Segment Category |
Leading Segment |
Market Share |
Year |
|
Product |
Non-Carbonated |
56.8% |
2025 |
|
Distribution Channel |
Hypermarkets and Supermarkets |
38.6% |
2025 |
|
Region |
Central |
36.5% |
2025 |

By Product
To access detailed market analysis, Request Sample
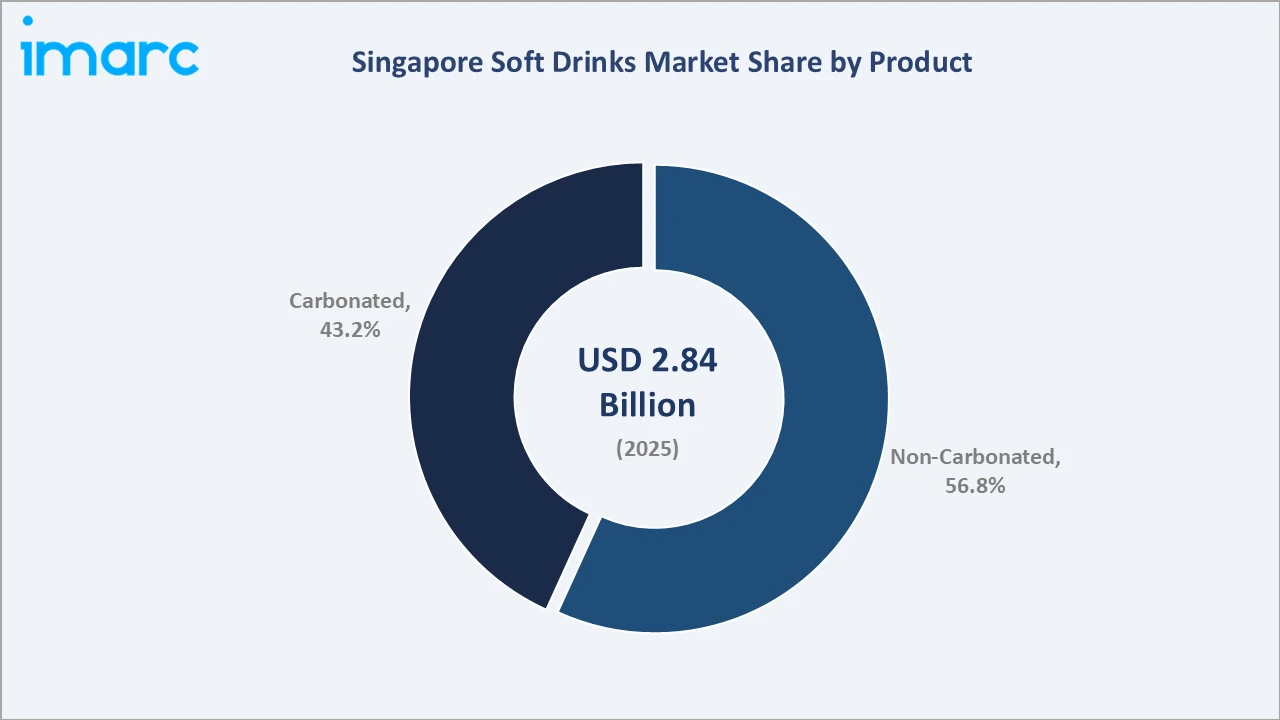
Non-Carbonated beverages lead at 56.8% in 2025, encompassing juices, RTD tea, flavoured water, and functional drinks favoured by health-conscious consumers. Carbonated beverages hold 43.2%, sustained by established brand loyalty despite gradual share erosion from ongoing sugar-reduction and reformulation trends across the category. The gap between the two segments is expected to widen gradually through 2034 as reformulation and functional innovation continue to favour non-carbonated formats.
By Distribution Channel
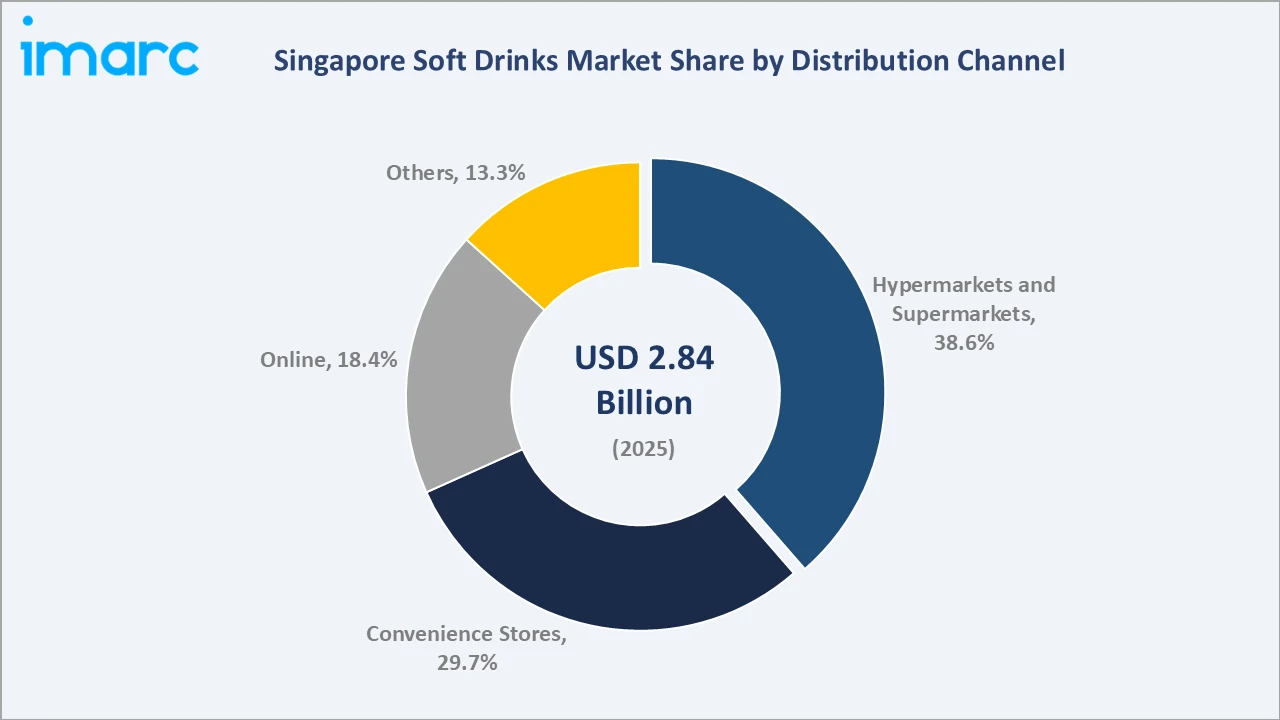
Hypermarkets and supermarkets lead at 38.6% through wide assortment and promotional reach. Convenience stores follow at 29.7%, supported by Singapore's dense store network. Online channels at 18.4% are growing fastest, while other formats, including HORECA and vending, account for 13.3% of total distribution. Retailers across all formats are increasingly integrating omnichannel fulfilment to capture demand shifting toward online and quick-commerce purchasing.
Regional Market Insights
|
Region |
Share (2025) |
Key Market Drivers & Characteristics |
|
Central |
36.5% |
Driven by high population density, strong retail infrastructure, and consumer purchasing power |
|
North-East |
19.8% |
Driven by a large residential base and expanding retail presence |
|
West |
17.2% |
Driven by growing residential townships and rising retail penetration |
|
East |
14.6% |
Driven by established residential and commercial catchments |
|
North |
11.9% |
Driven by emerging residential development and growing retail infrastructure |
Regional demand patterns across Singapore continue to be shaped primarily by population density, retail infrastructure maturity, and household purchasing power, with the five planning regions displaying a broadly consistent, moderately concentrated distribution of market share.
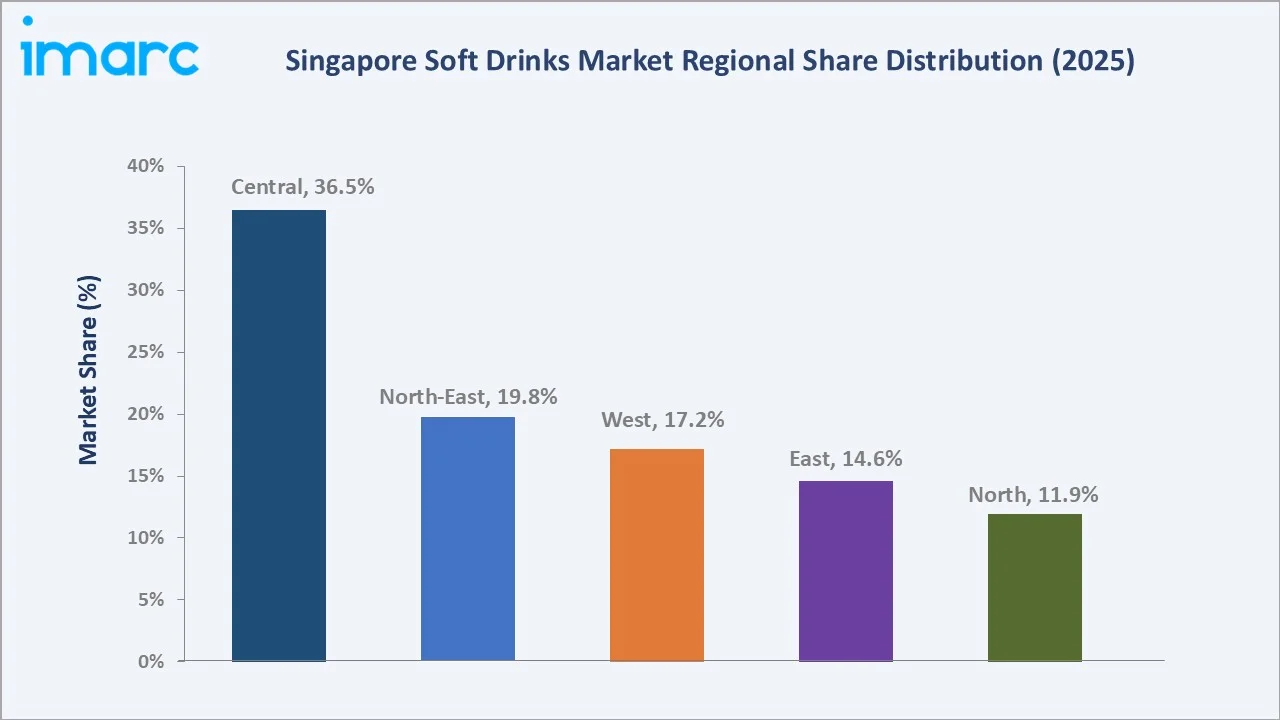
Central, at 36.5%, leads through Singapore's highest population density and concentrated retail infrastructure. North-East, at 19.8%, reflects a large residential base and expanding convenience retail presence. Both regions benefit from well-established distribution networks and consistent consumer footfall.
West, at 17.2%, benefits from growing suburban townships and rising online delivery penetration. East, at 14.6%, and North, at 11.9%, represent steadily growing markets supported by ongoing residential development and gradually expanding retail infrastructure across these planning regions. Collectively, these three regions offer meaningful long-term growth potential as retail networks continue to mature.
Competitive Landscape
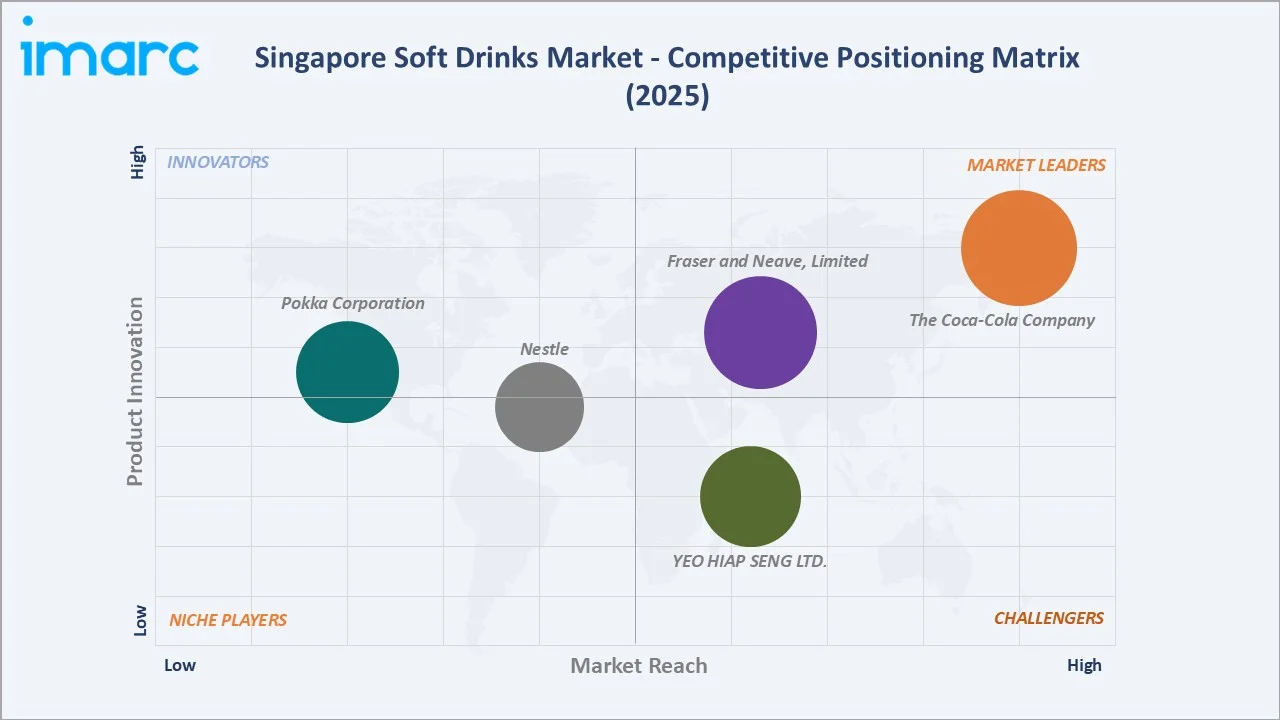
The Singapore soft drinks market competitive landscape is moderately consolidated, led by multinational beverage giants alongside long-established local manufacturers. Competition centres on reformulation, distribution reach, and functional beverage innovation. Manufacturers are also differentiating through packaging design, flavour localisation, and targeted digital marketing to defend and expand retail shelf presence. Partnerships with retail chains and delivery platforms are becoming an increasingly important lever for maintaining competitive visibility.
|
Company Name |
Key Products |
Market Position |
Core Strength |
|
The Coca‑Cola Company |
Coca-Cola, Sprite, Minute Maid, Fanta, Schweppes |
Market Leader |
Global brand strength and extensive retail distribution network |
|
Fraser and Neave, Limited |
F&N Seasons, 100Plus, F&N Fruit Tree |
Market Leader |
Over 130 years of local heritage and broad regional manufacturing base |
|
YEO HIAP SENG LTD. |
Yeo's Chrysanthemum Tea, Yeo's Asian Beverages |
Strong Challenger |
Deep-rooted local brand equity across Asian beverage categories |
|
Nestle |
Nestea, Milo Ready-to-Drink |
Established Player |
Strong brand trust and functional beverage expertise |
|
Pokka Corporation |
Pokka Green Tea, Pokka Isotonic |
Established Player |
Established presence in RTD tea and Asian flavoured beverages |
Key players include The Coca‑Cola Company, Fraser and Neave, Limited, YEO HIAP SENG LTD., Nestle, Pokka Corporation, and others.
Key Company Profiles
The Coca‑Cola Company
The Coca-Cola Company, offers a broad portfolio of carbonated and non-carbonated beverages across the local retail and foodservice market. The company maintains one of the most extensive distribution networks in the country, spanning hypermarkets, convenience stores, and foodservice outlets.
- Key Products: Coca-Cola, Sprite, Minute Maid, Bonaqua
- Strategic Focus: Expanding zero-sugar formulations, functional beverage lines, and sustainable packaging across its Singapore product portfolio. The company continues to invest in recyclable packaging formats and localised flavour variants to strengthen its retail and foodservice presence. It is also broadening its digital and e-commerce partnerships to reach convenience-oriented urban consumers more directly.
Fraser and Neave, Limited
Fraser and Neave is a Singapore-headquartered beverage and food company with over 130 years of regional heritage, offering soft drinks, dairy, and isotonic beverages across Southeast Asia. Its diversified manufacturing footprint supports both domestic distribution and export volumes across neighbouring markets.
- Key Products: F&N Seasons, 100Plus, F&N Fruit Tree, F&N Sarsi.
- Strategic Focus: Strengthening regional beverage manufacturing scale and expanding health-oriented product innovation across its core brand portfolio. F&N is also pursuing deeper retail partnerships and export growth across Southeast Asia to diversify its revenue base. The company continues to invest in reformulation research to sustain its long-standing brand equity under evolving regulatory requirements.
Market Concentration Analysis
The Singapore soft drinks market is moderately concentrated, with the key players collectively accounting for a substantial share of national beverage revenue. Smaller manufacturers compete through niche flavour positioning and price-based strategies. Market concentration is likely to remain broadly stable through the forecast period, as reformulation capability and distribution scale continue to favour established players over new entrants. Consolidation activity, while limited historically, could gradually increase as compliance costs rise across the industry.
Investment & Growth Opportunities
Highest Growth Segments
Non-Carbonated beverages (~4.6% CAGR), Online distribution (~7.5% CAGR), functional and fortified drinks, and sustainable packaging formats represent the highest-growth investment vectors within Singapore's soft drinks market through 2034. These segments are expected to outpace overall market growth as health and convenience preferences continue to strengthen. Manufacturers allocating capital toward these areas early are likely to secure disproportionate category share gains relative to slower-moving competitors.
Emerging Investment Opportunities
Premium functional beverages and direct-to-consumer e-commerce represent the market's highest-value emerging opportunities, as health-conscious, digitally engaged Singaporean consumers increasingly favour convenient, fortified, and clean-label beverage options. Manufacturers building early capability in these areas may secure durable competitive advantages. Cross-border sourcing partnerships for functional ingredients are also emerging as a meaningful enabler of faster product development cycles.
Investment Themes
- Low-sugar reformulation as a structural compliance advantage: Manufacturers investing early in reformulation technology gain sustained Nutri-Grade compliance advantages, reducing long-term regulatory and reputational risk relative to slower-adapting competitors. This positioning also supports stronger long-term retailer relationships as compliant portfolios face fewer promotional restrictions.
- E-commerce and quick-commerce infrastructure investment: Building dedicated online fulfilment and last-mile delivery capability positions manufacturers to capture Singapore's fastest-growing distribution channel ahead of broader industry adoption. Early investment in this area may also generate valuable first-party consumer data to inform future product development.
Future Market Outlook (2026-2034)
The Singapore soft drinks market is projected to grow from USD 2.84 Billion in 2025 to USD 4.11 Billion by 2034, delivering a 4.10% CAGR. The market's anchor value of USD 3.48 Billion by 2030 reflects steady, regulation-shaped structural growth across both product and distribution channel segments.
Non-Carbonated products will likely strengthen their category lead, online distribution will continue narrowing the gap with traditional retail, and the Central region will retain its position as Singapore's largest regional soft drinks market through the forecast period. Overall, the market's trajectory reflects a steady transition toward healthier, more convenient beverage formats, supported by continued regulatory clarity and evolving consumer expectations across Singapore's retail and digital commerce landscape. Manufacturers that align reformulation, packaging, and channel strategy with these shifts are best positioned to sustain long-term category leadership.
Research Methodology
Primary Research
Primary research comprised structured interviews with beverage industry stakeholders, including category managers, retail buyers, and beverage manufacturing executives across Singapore's soft drinks industry. These interviews helped validate market sizing assumptions and identify emerging demand patterns across product and distribution channel segments. Insights gathered were also used to sense-check regional share estimates against on-ground retail observations.
Secondary Research
Secondary research encompassed company annual reports, Singapore Health Promotion Board Nutri-Grade documentation, trade association data, and industry publications covering Singapore's beverage manufacturing and retail landscape. These sources were cross-referenced to ensure consistency across historical and forecast data points. Government trade and consumption statistics were also reviewed to validate category-level growth assumptions.
Forecasting Models
Market revenue forecasts were developed using a consumption-based bottom-up model incorporating historical retail sales data, population and income trends, and category-level growth rates by product and distribution channel. Scenario sensitivity checks were applied to account for regulatory and macroeconomic uncertainty.
Singapore Soft Drinks Market Report Coverage:
| Report Features | Details |
|---|---|
| Base Year of the Analysis | 2025 |
| Historical Period | 2020-2025 |
| Forecast Period | 2026-2034 |
| Units | Billion USD |
| Scope of the Report | Exploration of Historical Trends and Market Outlook, Industry Catalysts and Challenges, Segment-Wise Historical and Future Market Assessment:
|
| Products Covered | Carbonated, Non-Carbonated |
| Distribution Channels Covered | Hypermarkets and Supermarkets, Convenience Store, Online, Others |
| Regions Covered | North-East, Central, West, East, North |
| Companies Covered | The Coca‑Cola Company, Fraser and Neave, Limited, YEO HIAP SENG LTD., Nestle, Pokka Corporation, etc. |
| Customization Scope | 10% Free Customization |
| Post-Sale Analyst Support | 10-12 Weeks |
| Delivery Format | PDF and Excel through Email (We can also provide the editable version of the report in PPT/Word format on special request) |
Key Benefits for Stakeholders:
- IMARC’s industry report offers a comprehensive quantitative analysis of various market segments, historical and current market trends, market forecasts, and dynamics of the Singapore soft drinks market from 2020-2034.
- The research report provides the latest information on the market drivers, challenges, and opportunities in the Singapore Soft Drinks market.
- Porter's five forces analysis assist stakeholders in assessing the impact of new entrants, competitive rivalry, supplier power, buyer power, and the threat of substitution. It helps stakeholders to analyze the level of competition within the Singapore soft drinks industry and its attractiveness.
- Competitive landscape allows stakeholders to understand their competitive environment and provides an insight into the current positions of key players in the market.
Frequently Asked Questions About the Singapore Soft Drinks Market Report
The Singapore soft drinks market reached USD 2.84 Billion in 2025, led by the Non-Carbonated product segment at 56.8% and the Hypermarkets and Supermarkets distribution channel at 38.6%, with the Central region contributing the largest regional share of demand nationwide.
The market grows at 4.10% CAGR during 2026-2034, reaching USD 4.11 Billion by 2034, driven by health-conscious reformulation, functional beverage demand, and expanding e-commerce distribution across the country's retail landscape.
Non-Carbonated beverages lead at 56.8% in 2025, encompassing juices, RTD tea, flavoured water, and functional drinks favoured by Singapore's health-conscious consumers, while Carbonated beverages hold the remaining 43.2% share of the market.
Hypermarkets and Supermarkets lead at 38.6% in 2025, followed by Convenience Stores at 29.7%, Online at 18.4%, and Others at 13.3%, with online channels growing the fastest among all retail formats.
Central leads at 36.5% in 2025, supported by Singapore's highest population density and concentrated retail infrastructure, followed by North-East at 19.8% and West at 17.2% of national market share.
Leading companies include The Coca‑Cola Company, Fraser and Neave, Limited, YEO HIAP SENG LTD., Nestle, Pokka Corporation, and others.
The market is projected to reach approximately USD 3.48 Billion by 2030, with continued Non-Carbonated share gains and accelerating online distribution channel growth through the remainder of the decade and beyond.
Priority opportunities include low-sugar reformulation technology, functional and fortified beverage development, and e-commerce and quick-commerce distribution infrastructure investment across the Singapore market's evolving retail landscape.
Need more help?
- Speak to our experienced analysts for insights on the current market scenarios.
- Include additional segments and countries to customize the report as per your requirement.
- Gain an unparalleled competitive advantage in your domain by understanding how to utilize the report and positively impacting your operations and revenue.
- For further assistance, please connect with our analysts.
 Request Customization
 Speak to an Analyst
 Request Brochure
 Inquire Before Buying
Benefits of Customization
- Personalize this research
- Triangulate with your data
- Get data as per your format and definition
- Gain a deeper dive into a specific application, geography, customer, or competitor
- Any level of personalization
Get in Touch With Us
UNITED STATES
Phone: +1-201-971-6302
INDIA
Phone: +91-120-433-0800
UNITED KINGDOM
Phone: +44-753-714-6104
Email: [email protected]
Client Testimonials




.webp)




.webp)













Related Reports

Choose your plan
*Please note that the prices mentioned below are starting prices for each bundle type. Kindly contact our team for further details.*
Single User License
- 1 User License, Access on 2 Devices
- PDF Report + Excel Dataset (Password Protected)
- Lifetime Access
- No Printing Rights
- 10% Free Report Customization
- 10–12 Weeks of Analyst Support
Five User License
- Access for 5 Users, 2 Devices per User
- PDF Report + Excel Dataset (Password Protected)
- Lifetime Access
- Dedicated Account Manager
- 12–14 Weeks of Analyst Support
- No Printing Rights
- 15% Free Report Customization
- 25% Discount on Your Next Purchase
Corporate User License
- Unlimited User Access (Within Your Organization)
- PDF Report + Excel Dataset
- Lifetime Access
- Dedicated Account Manager
- 14–20 Weeks of Analyst Support
- No Printing Rights
- 20% Free Report Customization
- 30% Discount on Your Next Purchase
Essential Insights
What's included:
3 reports
- Lifetime Access
- PDF Reports
- Excel Datasets
- 2 Weeks of Free Analyst Support
- 2 User Licenses
- Access on 2 Devices
- Printing Rights
- Complimentary PowerPoint (PPT) Version
- Complimentary License Upgrade
Professional Access
What's included:
5 reports
- Lifetime Access
- PDF Reports
- Excel Datasets
- 8 Weeks of Free Analyst Support
- 2 User Licenses
- Access on 2 Devices
- Printing Rights
- Complimentary PowerPoint (PPT) Version
- Complimentary License Upgrade
Business Advantage
What's included:
8 reports
- Lifetime Access
- PDF Reports
- Excel Datasets
- 14 Weeks of Free Analyst Support
- 2 User Licenses
- Access on 2 Devices
- Printing Rights
- Complimentary PowerPoint (PPT) Version
- Complimentary License Upgrade
Enterprise Intelligence
What's included:
10 reports
- Lifetime Access
- PDF Reports
- Excel Datasets
- 20 Weeks of Free Analyst Support
- 2 User Licenses
- Access on 2 Devices
- Printing Rights
- Complimentary PowerPoint (PPT) Version
- Complimentary License Upgrade