
Specialty Carbon Black Market Report by Grade Type (Conductive Carbon Black, Fiber Carbon Black, Food Contact Carbon Black, and Others), and Region 2026-2034
Specialty Carbon Black Market Size:
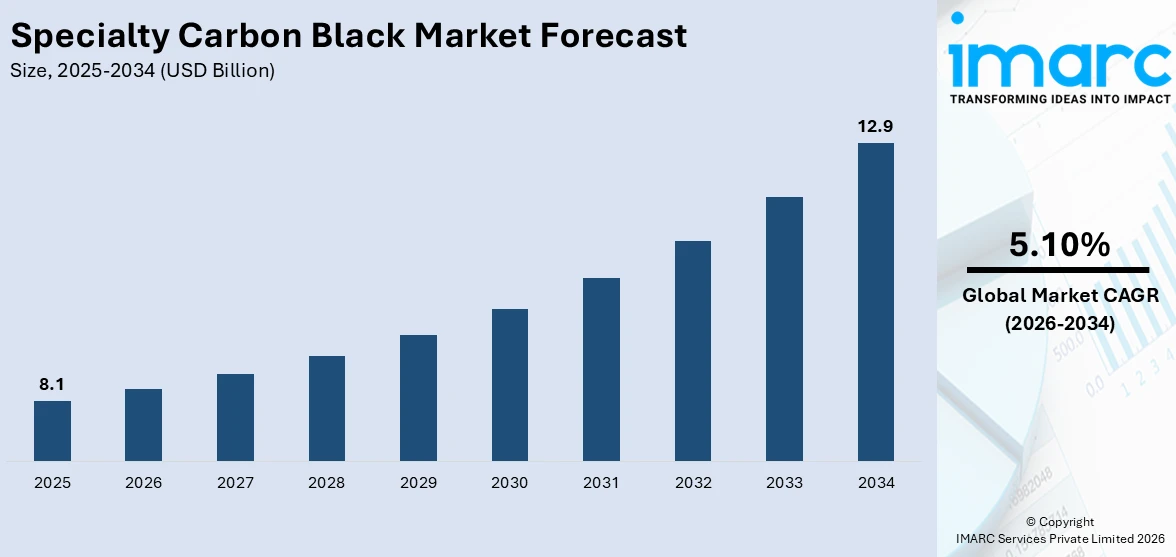
The global specialty carbon black market size reached USD 8.1 Billion in 2025. Looking forward, IMARC Group expects the market to reach USD 12.9 Billion by 2034, exhibiting a growth rate (CAGR) of 5.10% during 2026-2034. The rising demand in automotive and electronics industries, increasing use in industrial applications, ongoing advancements in manufacturing technologies, growing awareness of environmental benefits, and the development of high-performance materials are some of the key factors strengthening the market growth.
|
Report Attribute
|
Key Statistics
|
|---|---|
|
Base Year
|
2025 |
|
Forecast Years
|
2026-2034
|
|
Historical Years
|
2020-2025
|
| Market Size in 2025 | USD 8.1 Billion |
| Market Forecast in 2034 | USD 12.9 Billion |
| Market Growth Rate (2026-2034) | 5.10% |
Specialty Carbon Black Market Analysis:
- Major Market Drivers: The increasing demand from the automotive and electronics industries is a primary factor driving the market growth, as specialty carbon black enhances performance and durability in tires, coatings, and electronic components. Additionally, ongoing technological developments in manufacturing processes, such as improved reactors and cleaner production methods, contributing to reduced costs and enhanced product quality are aiding in market expansion.
- Key Market Trends: The widespread product utilization across the automotive and electronics sectors for high-performance applications, reflecting a trend towards advanced material requirements is one of the major trends impelling the market growth. Besides this, the specialty carbon black market overview shows significant technological improvements leading to more efficient and sustainable production methods, aligning with environmental goals are also driving market growth.
- Geographical Trends: Asia Pacific is the dominating market owing to the rapid industrialization, significant automotive and electronics sectors, and favorable government policies supporting industrial growth. The region's thriving automotive and electronics industries further drive substantial product demand. Besides this, the rising demand across North America, characterized by technological advancements, the presence of key industry players, and continuous investment in research and development (R&D) are enhancing the specialty carbon black market value.
- Competitive Landscape: Some of the major market players in the specialty carbon black industry include Ampacet Corporation, Atlas Organics Pvt. Ltd., Birla Carbon (Aditya Birla Group), Cabot Corporation, Continental Carbon Company (CSRC USA Corp.), Denka Company Limited, Himadri Speciality Chemical Ltd., Mitsubishi Chemical Corporation, OMSK Carbon Group Limited, Orion Engineered Carbon GmbH, Phillips Carbon Black Limited, Tokai Carbon Co. Ltd., among many others.
- Challenges and Opportunities: Environmental regulations and the need for sustainable practices pose challenges for manufacturers, necessitating investment in eco-friendly technologies and processes. On the other hand, ongoing innovation in recycling and green production methods, aligning with global environmental goals, and meeting consumer demand for greener products are presenting lucrative opportunities for market expansion.
To get more information on this market Request Sample
Specialty Carbon Black Market Trends:
Increasing demand from automotive and electronics industries:
The automotive industry is a major consumer of specialty carbon black, primarily due to its use in tires and coatings. It enhances the durability, strength, and performance of tires, making them more resistant to wear and improving their fuel efficiency. Consequently, the rise in electric vehicles (EVs) and advanced automotive technologies, which demand high-performance materials are fostering market expansion. Similarly, the electronics sector also utilizes specialty carbon black in components such as conductive coatings and antistatic agents. As electronics become more advanced and miniaturized, the demand for specialty carbon black that can provide superior conductivity and performance in compact devices is increasing. Besides this, ongoing advancements in consumer electronics, telecommunications, and emerging technologies like wearable devices and the Internet of Things (IoT) are contributing to the specialty carbon black market growth.
Technological advancements in manufacturing:
Technological developments have led to significant improvements in the production of specialty carbon black. The quality and consistency of specialty carbon black have improved due to advancements in production techniques, including the creation of sophisticated reactors and more effective purification procedures. These advancements reduce production costs and improve the performance characteristics of carbon black, such as particle size and surface area. Moreover, the introduction of new production methods, including the use of alternative feedstocks and cleaner technologies has led to more sustainable and cost-effective manufacturing processes. These improvements, enabling manufacturers to meet the growing demand for high-performance materials with better environmental compliance are positively impacting the specialty carbon black market outlook.
Growing awareness of environmental benefits:
There is an increasing emphasis on environmental sustainability across various industries, which is influencing market growth. Specialty carbon black is known for helping products last longer and function more effectively, which lowers their overall environmental impact. For example, in automotive applications, the use of specialty carbon black in tires contributes to longer-lasting products that reduce waste and resource consumption. Moreover, innovations in the recycling of carbon black and the development of eco-friendly production methods are aligning with global sustainability goals. The industry's focus on reducing carbon emissions and enhancing the recyclability of products is bolstering the market growth.
Specialty Carbon Black Market Segmentation:
IMARC Group provides an analysis of the key trends in each segment of the market, along with forecasts at the global, regional, and country levels for 2026-2034. Our report has categorized the market based on grade type.
Breakup by Grade Type:
Access the comprehensive market breakdown Request Sample
- Conductive Carbon Black
- Conductive Polymers
- Paints and Coatings
- Printing Inks
- Others
- Fiber Carbon Black
- Polyester Fiber
- PP Masterbatches
- Nylon Textiles
- Others
- Food Contact Carbon Black
- Packaging
- Film and Sheet
- Consumer Molded Parts
- Others
- Others
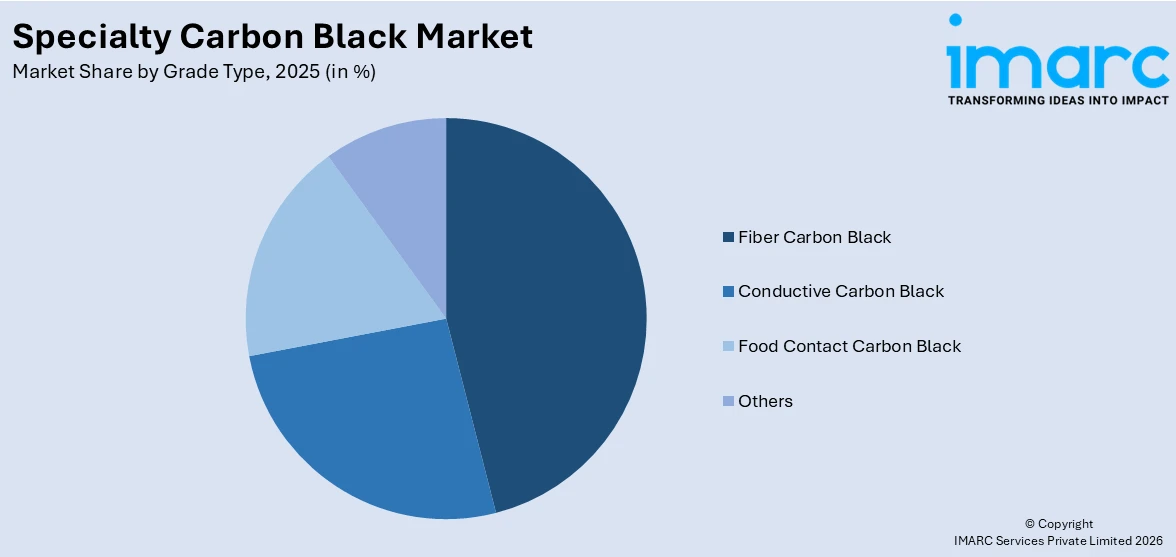
Fiber carbon black accounts for the majority of the market share
The report has provided a detailed breakup and analysis of the market based on the grade type. This includes conductive carbon black (conductive polymers, paints and coatings, printing inks, others), fiber carbon black (polyester fiber, PP masterbatches, nylon textiles, others), food contact carbon black (packaging, film and sheet, consumer molded parts, others), and others. According to the report, fiber carbon black represented the largest segment.
Based on the specialty carbon black market research report, the growing demand for fiber carbon black due to its critical role in reinforcing fibers used in advanced composites and textiles is fueling market expansion. Its high surface area and excellent conductivity enhance the mechanical strength, durability, and performance of these fibers. In industries such as aerospace, automotive, and sports equipment, there is a surging demand for lightweight, strong materials that help improve the resilience and functionality of composite materials. This is driving the need for fiber carbon black in these sectors for high-performance applications. Moreover, continuous improvements in production techniques and a greater emphasis on its creative uses are bolstering the specialty carbon black demand.
Breakup by Region:
- North America
- United States
- Canada
- Asia-Pacific
- China
- Japan
- India
- South Korea
- Australia
- Indonesia
- Others
- Europe
- Germany
- France
- United Kingdom
- Italy
- Spain
- Russia
- Others
- Latin America
- Brazil
- Mexico
- Others
- Middle East and Africa
Asia Pacific leads the market, accounting for the largest specialty carbon black market share
The report has also provided a comprehensive analysis of all the major regional markets, which include North America (the United States and Canada); Asia Pacific (China, Japan, India, South Korea, Australia, Indonesia, and others); Europe (Germany, France, the United Kingdom, Italy, Spain, Russia, and others); Latin America (Brazil, Mexico, and others); and the Middle East and Africa. According to the report, Asia Pacific represents the largest regional market for specialty carbon black.
The specialty carbon black market forecast highlights Asia Pacific as the dominating region, accounting for the largest share due to its robust industrial and automotive sectors. Rapid industrialization and economic growth in countries like China and India drive substantial demand for specialty carbon black in manufacturing, automotive parts, and electronics. The region's expanding automotive industry, with a focus on high-performance tires and advanced vehicle technologies, significantly contributes to the market growth. Additionally, Asia Pacific's thriving electronics and consumer goods sectors that require specialty carbon black for enhanced product performance and durability are impelling the market growth. Furthermore, favorable government policies supporting industrial growth and infrastructure development are boosting the specialty carbon black market revenue.
Competitive Landscape:
- The market research report has also provided a comprehensive analysis of the competitive landscape in the market. Detailed profiles of all major companies have also been provided. Some of the major market players in the specialty carbon black industry include Ampacet Corporation, Atlas Organics Pvt. Ltd., Birla Carbon (Aditya Birla Group), Cabot Corporation, Continental Carbon Company (CSRC USA Corp.), Denka Company Limited, Himadri Speciality Chemical Ltd., Mitsubishi Chemical Corporation, OMSK Carbon Group Limited, Orion Engineered Carbon GmbH, Phillips Carbon Black Limited, Tokai Carbon Co. Ltd., etc.
(Please note that this is only a partial list of the key players, and the complete list is provided in the report.)
- The competitive landscape is characterized by a mix of established multinational companies and emerging regional players. Major global firms hold significant market share, leveraging advanced technologies, extensive production capabilities, and broad distribution networks to maintain their leadership. These specialty carbon black companies focus on innovation, high-performance products, and strategic partnerships to capture market share. Meanwhile, regional players are expanding their presence by catering to local demand and leveraging cost advantages. The market is also witnessing consolidation trends, with mergers and acquisitions enhancing operational efficiencies and expanding product portfolios. Besides this, competition is intensifying around sustainability as companies invest in eco-friendly production methods and recycling technologies to align with growing environmental regulations and consumer preferences.
Specialty Carbon Black Market News:
- In April 2024, Himadri Speciality Chemical Ltd revealed its plans to invest Rs 220 crores to expand its specialty carbon black capacity in Singur, West Bengal. The brownfield project aims to address rising European demand, driven by an upcoming EU ban on Russian imports. Scheduled for completion in 18 months, the expansion will boost the company's annual production capacity by 70,000 tonnes, increasing total capacity from 180,000 to 250,000 tonnes.
- In November 2023, Orion S.A. unveiled its first circular specialty carbon black for polymers at the 2023 Compounding World Expo North America, held in Cleveland from Nov. The company will also present carbon blacks, enhancing rheology, UV resistance, and conductivity. Orion aims to collaborate with customers to tailor solutions to specific performance needs.
Specialty Carbon Black Market Report Scope:
| Report Features | Details |
|---|---|
| Base Year of the Analysis | 2025 |
| Historical Period | 2020-2025 |
| Forecast Period | 2026-2034 |
| Units | Billion USD |
| Scope of the Report | Exploration of Historical Trends and Market Outlook, Industry Catalysts and Challenges, Segment-Wise Historical and Future Market Assessment:
|
| Grade Types Covered |
|
| Regions Covered | Asia Pacific, Europe, North America, Latin America, Middle East and Africa |
| Countries Covered | United States, Canada, Germany, France, United Kingdom, Italy, Spain, Russia, China, Japan, India, South Korea, Australia, Indonesia, Brazil, Mexico |
| Companies Covered | Ampacet Corporation, Atlas Organics Pvt. Ltd., Birla Carbon (Aditya Birla Group), Cabot Corporation, Continental Carbon Company (CSRC USA Corp.), Denka Company Limited, Himadri Speciality Chemical Ltd., Mitsubishi Chemical Corporation, OMSK Carbon Group Limited, Orion Engineered Carbon GmbH, Phillips Carbon Black Limited, Tokai Carbon Co. Ltd., etc. |
| Customization Scope | 10% Free Customization |
|
Post-Sale Analyst Support |
10-12 Weeks |
| Delivery Format | PDF and Excel through Email (We can also provide the editable version of the report in PPT/Word format on special request) |
Key Questions Answered in This Report:
- How has the global specialty carbon black market performed so far, and how will it perform in the coming years?
- What are the drivers, restraints, and opportunities in the global specialty carbon black market?
- What is the impact of each driver, restraint, and opportunity on the global specialty carbon black market?
- What are the key regional markets?
- Which countries represent the most attractive specialty carbon black market?
- What is the breakup of the market based on the grade type?
- Which is the most attractive grade type in the specialty carbon black market?
- What is the competitive structure of the market?
- Who are the key players/companies in the global specialty carbon black market?
Key Benefits for Stakeholders:
- IMARC’s industry report offers a comprehensive quantitative analysis of various market segments, historical and current market trends, market forecasts, and dynamics of the specialty carbon black market from 2020-2034.
- The research report provides the latest information on the market drivers, challenges, and opportunities in the global specialty carbon black market.
- The study maps the leading, as well as the fastest-growing, regional markets. It further enables stakeholders to identify the key country-level markets within each region.
- Porter's five forces analysis assists stakeholders in assessing the impact of new entrants, competitive rivalry, supplier power, buyer power, and the threat of substitution. It helps stakeholders to analyze the level of competition within the specialty carbon black industry and its attractiveness.
- The competitive landscape allows stakeholders to understand their competitive environment and provides insight into the current positions of key players in the market.
Need more help?
- Speak to our experienced analysts for insights on the current market scenarios.
- Include additional segments and countries to customize the report as per your requirement.
- Gain an unparalleled competitive advantage in your domain by understanding how to utilize the report and positively impacting your operations and revenue.
- For further assistance, please connect with our analysts.
 Request Customization
 Speak to an Analyst
 Request Brochure
 Inquire Before Buying
Benefits of Customization
- Personalize this research
- Triangulate with your data
- Get data as per your format and definition
- Gain a deeper dive into a specific application, geography, customer, or competitor
- Any level of personalization
Get in Touch With Us
UNITED STATES
Phone: +1-201-971-6302
INDIA
Phone: +91-120-433-0800
UNITED KINGDOM
Phone: +44-753-714-6104
Email: [email protected]
Client Testimonials


.webp)


