
United States Medical Imaging Market Size, Share, Trends and Forecast by Product, Application, End User, and Region, 2026-2034
United States Medical Imaging Market Size, Share, Trends & Forecast (2026-2034)
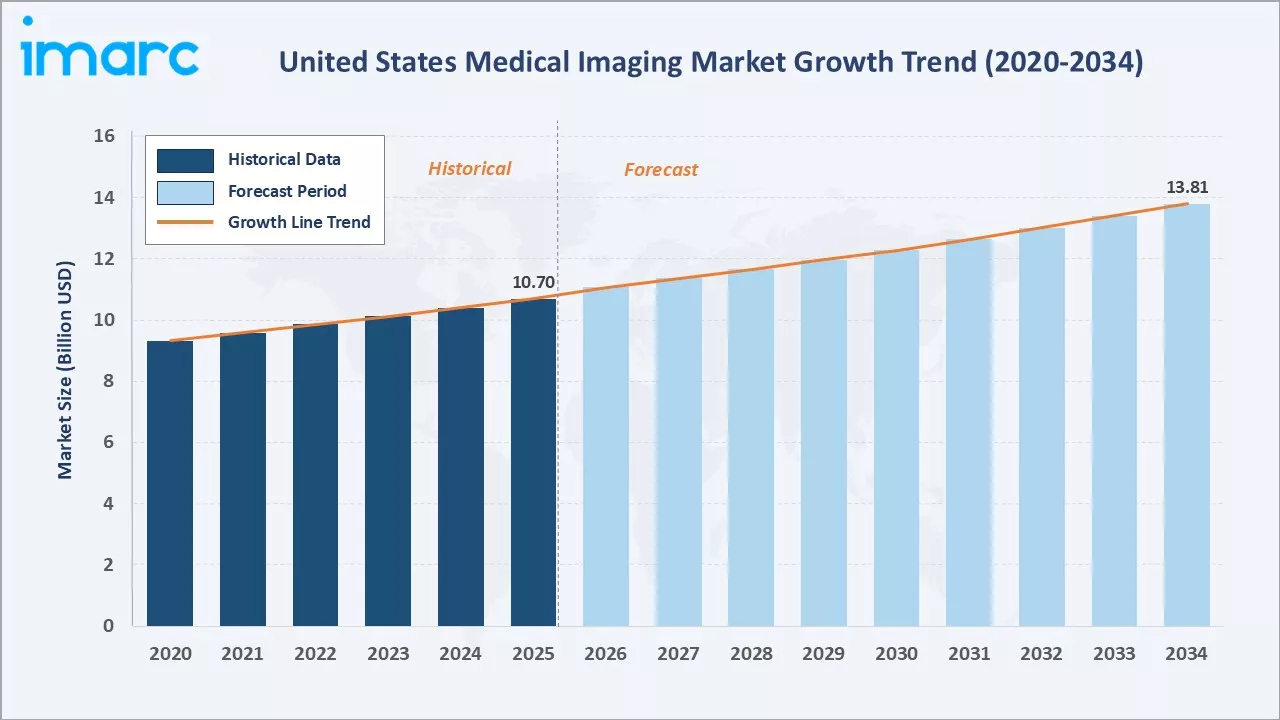
The United States medical imaging market grew from USD 10.70 Billion in 2025 to USD 11.08 Billion in 2026 and is projected to reach USD 13.81 Billion by 2034, growing at a CAGR of 2.78% during 2026-2034. Chronic disease, an aging population, and AI-enabled systems are supporting demand. In March 2026, GE HealthCare received FDA 510(k) clearance for its Photonova Spectra photon-counting CT system.
Equipment replacement cycles, outpatient imaging growth, and helium-free MRI technology continue to shape purchasing. X-ray imaging systems dominate at 25.0%. Hospitals lead end users at 62.0%. The South commands 35.0% of national market share.
Market Snapshot
|
Metric |
Value |
|
Base Year Market Size (2025) |
USD 10.70 Billion |
|
Market Size (2026) |
USD 11.08 Billion |
|
Forecast Market Size (2034) |
USD 13.81 Billion |
|
CAGR (2026-2034) |
2.78% |
|
Base Year |
2025 |
|
Historical Period |
2020-2025 |
|
Forecast Period |
2026-2034 |
|
Dominant Product |
X-Ray Imaging Systems (25.0%, 2025) |
|
Dominant End User |
Hospitals (62.0%, 2025) |
|
Leading Region |
South (35.0%, 2025) |
The United States medical imaging market size increased from USD 9.33 Billion in 2020 to USD 10.70 Billion in 2025 and is estimated to reach USD 11.08 Billion in 2026. The market is further expected to grow to USD 12.28 Billion by 2030 and USD 13.81 Billion by 2034. Growth reflects steady equipment upgrades and rising imaging volumes.
To get more information on this market, Request Sample
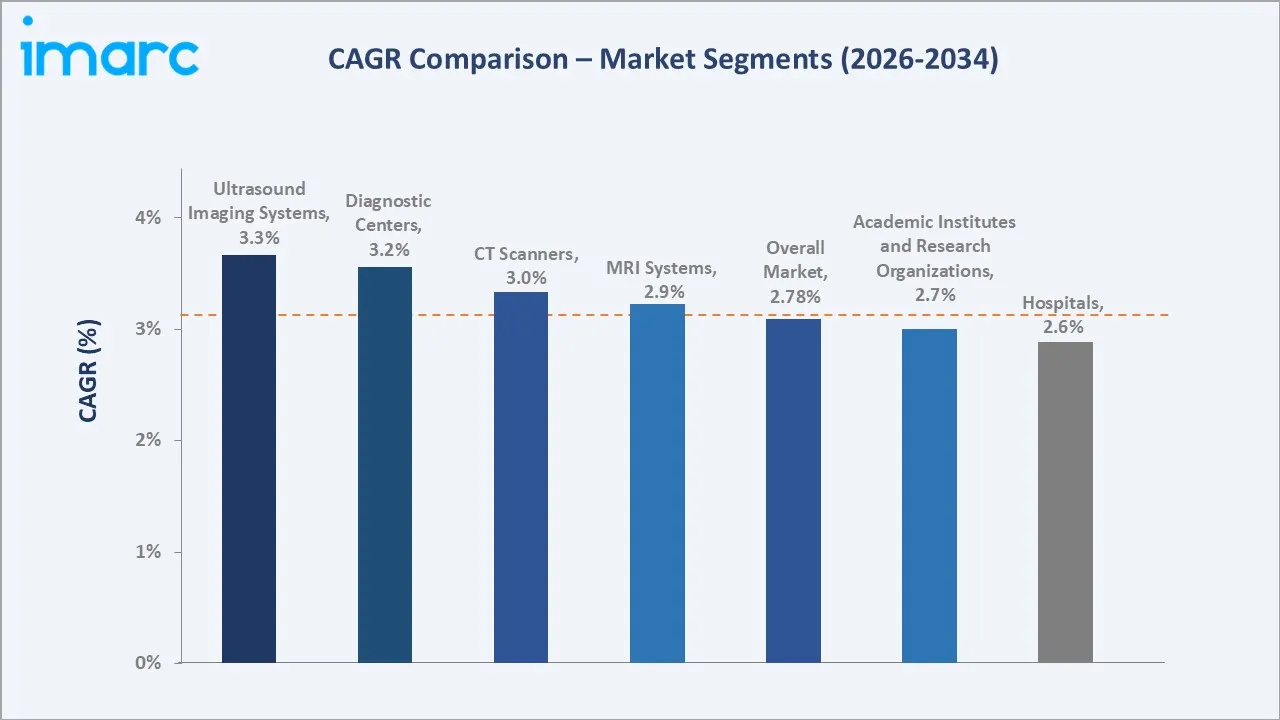
Ultrasound imaging systems are expected to grow fastest at ~3.3% CAGR, supported by point-of-care use and AI-guided scanning. Diagnostic centers follow at ~3.2% CAGR as imaging continues shifting to lower-cost outpatient settings.
Executive Summary
The United States medical imaging market expanded from USD 10.70 Billion in 2025 to an estimated USD 11.08 Billion in 2026. Hospitals and imaging centers are replacing aging equipment with AI-enabled CT, MRI, X-ray, and ultrasound systems that improve image quality, reduce radiation dose, and increase throughput.
Manufacturers are launching photon-counting CT and helium-free MRI platforms. The market is projected to reach USD 13.81 Billion by 2034. X-ray imaging systems at 25.0% lead products. Hospitals at 62.0% lead end users. The South leads at 35.0%.
Key Market Insights
|
Insight |
Data |
|
Dominant Product |
X-Ray Imaging Systems - 25.0% share (2025) |
|
Dominant End User |
Hospitals - 62.0% market share (2025) |
|
Leading Region |
South - 35.0% share (2025) |
|
Market Opportunity |
Photon-counting CT; helium-free MRI; AI-powered ultrasound; outpatient imaging centers; equipment replacement |
Key Analytical Observations Supporting the Above Data:
- X-Ray Imaging Systems at 25.0%: X-ray systems dominate because they are the most widely used first-line imaging tool in hospitals, emergency departments, urgent care, and physician offices, with a large installed base requiring regular replacement.
- Hospitals at 62.0%: Hospitals lead because they perform most emergency, inpatient, and complex imaging procedures and operate the largest fleets of CT, MRI, and interventional systems.
- South at 35.0%: The South leads due to its large and growing population, major health systems in Texas and Florida, and rising demand from older adults.
United States Medical Imaging Market Overview
Medical imaging includes CT scanners, X-ray systems, MRI systems, ultrasound, nuclear imaging, and mammography used to diagnose, monitor, and guide treatment of diseases. These technologies are essential across emergency, oncology, cardiology, neurology, and women’s health. Imaging also guides interventional procedures and surgical planning.
Systems are increasingly connected to PACS, EHRs, and AI software. Connectivity enables remote support and data-driven fleet management.
The industry ecosystem links component suppliers, system manufacturers, distributors, service providers, IT and AI partners, regulators, payers, and end users. Macroeconomic factors include healthcare spending, reimbursement rates, capital budgets, and demographic trends, all of which shape demand. FDA clearances and CMS policies strongly influence product launches and purchasing decisions.
Capital budgets in hospitals depend on financial performance and patient volumes. Interest rates and financing costs also influence equipment purchasing decisions.
Market Dynamics
To evaluate market opportunities, Request Sample
Market Drivers
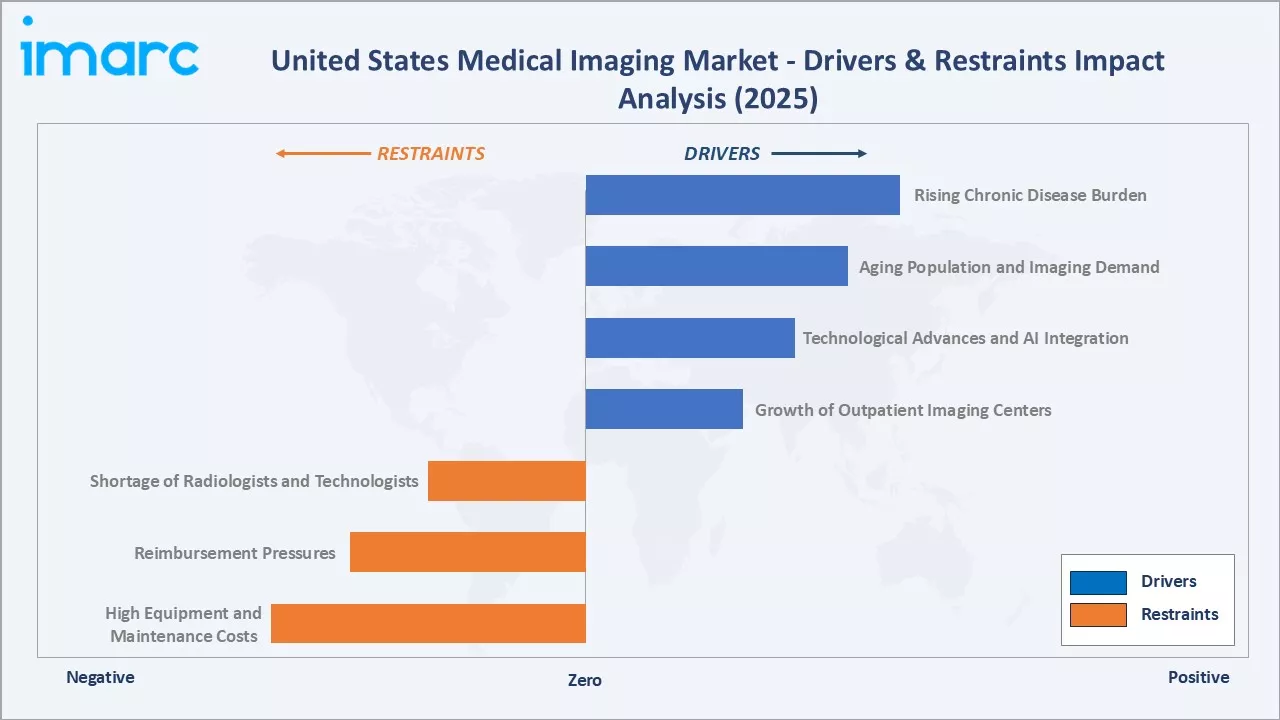
- Rising Chronic Disease Burden: Increasing rates of cancer, cardiovascular disease, and neurological disorders are raising demand for diagnostic and follow-up imaging. Cancer screening programs, cardiac imaging for heart disease, and brain imaging for stroke and dementia all rely on CT, MRI, and nuclear imaging.
- Aging Population and Imaging Demand: Older adults require more imaging for diagnosis and monitoring, increasing scan volumes across modalities. The number of Americans aged 65 and older continues to rise, and Medicare beneficiaries account for a large share of imaging procedures.
- Technological Advances and AI Integration: AI reconstruction, photon-counting CT, and helium-free MRI improve image quality, speed, and efficiency. Deep learning reconstruction allows lower radiation doses and shorter scan times, while AI triage tools help radiologists prioritize urgent findings. These innovations encourage providers to replace older systems sooner.
- Growth of Outpatient Imaging Centers: Payers and patients favor lower-cost outpatient imaging, expanding demand for systems in diagnostic centers. Hospital outpatient departments and independent imaging centers are adding CT and MRI capacity to meet demand while reducing costs for patients and payers.
Market Restraints
- High Equipment and Maintenance Costs: Advanced CT and MRI systems require large capital investment and ongoing service costs. Installation and site preparation for MRI and CT can add significantly to total project costs. Smaller hospitals often delay purchases or choose refurbished systems to manage budgets.
- Reimbursement Pressures: Medicare payment cuts for imaging services limit provider budgets for new equipment. Site-neutral payment proposals and prior authorization requirements also affect imaging revenue. Lower reimbursement can lengthen equipment replacement cycles.
- Shortage of Radiologists and Technologists: Workforce shortages limit imaging capacity and slow adoption of new systems. Burnout among imaging staff further affects productivity and service quality. Remote scanning and AI automation are helping address staffing gaps. Training programs for technologists are expanding to meet demand.
Market Opportunities
- Equipment Replacement and Upgrades: Aging installed bases create steady replacement demand for modern AI-enabled systems. Many CT and MRI systems installed over a decade ago are approaching the end of their useful life. Replacement programs are often planned through multi-year enterprise agreements. These agreements often include service, software, and training.
- Point-of-Care and Portable Imaging: Portable ultrasound and X-ray expand imaging into bedside and outpatient settings. Handheld ultrasound devices are increasingly used in emergency medicine and primary care. Portable X-ray systems are widely used in intensive care units and emergency departments. Wireless detectors and compact designs improve bedside imaging.
Market Challenges
- Radiation Safety and Regulation: Systems must meet strict FDA, radiation safety, and accreditation requirements. Dose monitoring and reporting add operational complexity for providers. Cybersecurity requirements for connected imaging devices are also increasing. Manufacturers must address software security throughout the product lifecycle.
- Helium Supply Constraints: Helium shortages affect MRI operations and costs. Helium-free designs help reduce this risk for future installations. Recycling and recovery systems help reduce helium loss in existing scanners. Helium-free systems also simplify installation in new locations. They also reduce long-term operating costs for providers.
Emerging Market Trends
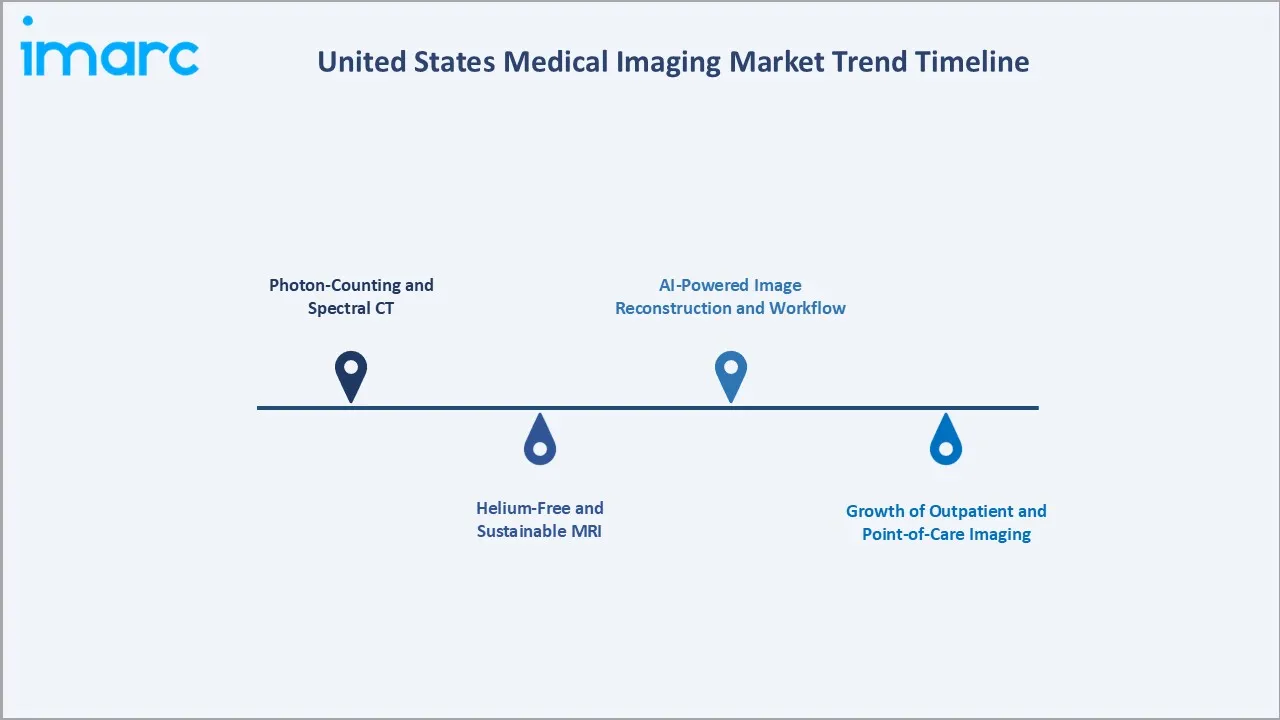
1. Photon-Counting and Spectral CT
Next-generation CT offers higher resolution and tissue characterization. In April 2026, Philips received FDA 510(k) clearance for its Spectral CT Verida system.
2. Helium-Free and Sustainable MRI
Manufacturers are introducing sealed-magnet MRI systems that reduce helium use, lower installation costs, and expand access. Lower helium use also reduces the need for quench pipes and costly site modifications. Smaller magnet designs make MRI more practical in outpatient and community settings.
These systems expand MRI access in smaller hospitals and imaging centers. Lower installation costs make MRI more accessible in rural regions. Mobile MRI units also serve communities without permanent scanners. These services improve access for rural patients.
3. AI-Powered Image Reconstruction and Workflow
AI tools reduce scan times, improve image quality, and automate routine tasks for technologists and radiologists. Automated positioning and protocol selection reduce variability between operators. AI also supports faster reporting and fewer repeat scans. AI also helps detect findings that may be missed during busy shifts.
Clinical validation of AI tools remains important for adoption. FDA clearances for AI tools continue to increase each year. Radiology accounts for the largest share of these clearances.
4. Growth of Outpatient and Point-of-Care Imaging
Imaging is shifting to outpatient centers and bedside settings, supported by compact and portable systems. Mobile imaging services also bring scans to nursing homes and rural communities. Point-of-care imaging improves access and speeds diagnosis. These settings benefit from easy-to-use systems with AI guidance.
Training requirements for portable systems are typically lower. Handheld devices are increasingly connected to cloud-based image storage. This allows easy review and sharing of point-of-care images.
Industry Value Chain Analysis
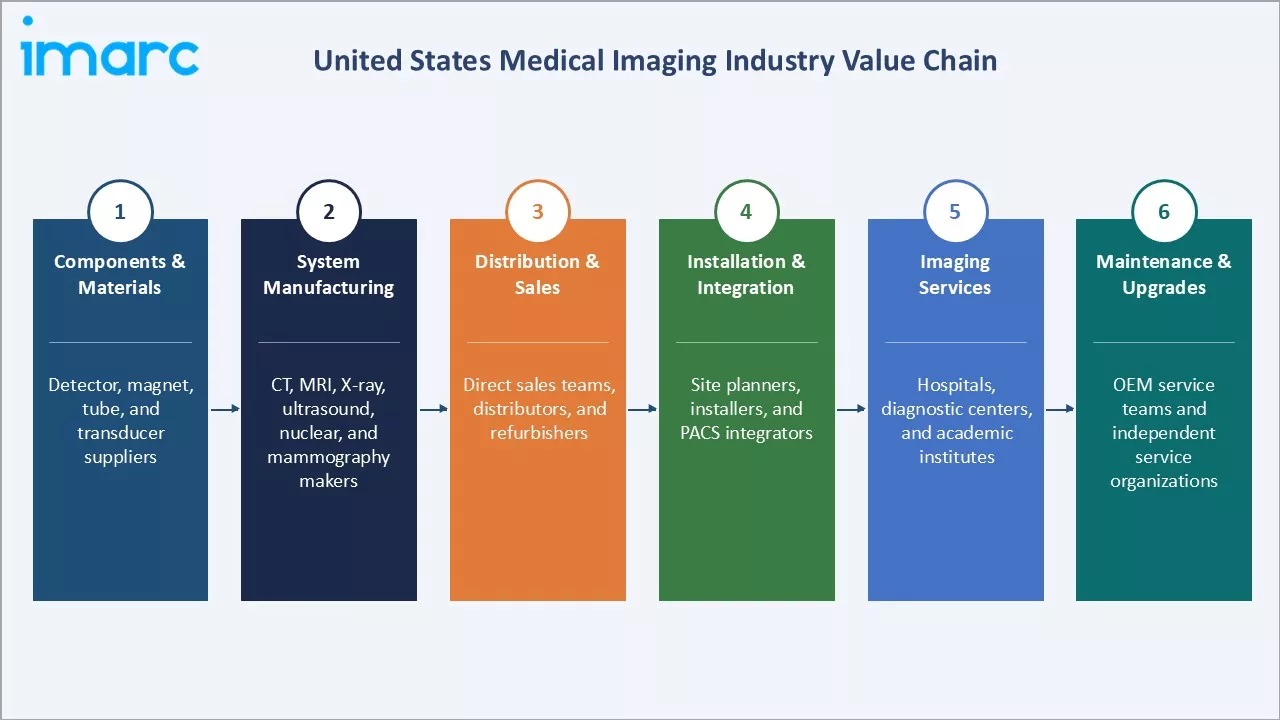
The United States medical imaging value chain spans components and materials, system manufacturing, distribution and sales, installation and integration, imaging services, and maintenance and upgrades. Value is shifting toward software, AI, and lifecycle services. Distribution and installation require close coordination with hospital facilities and IT teams.
Imaging services generate revenue and clinical value for providers. Each stage of the chain influences uptime, quality, and patient experience. Manufacturers increasingly offer end-to-end solutions across the chain. Partnerships with IT companies support integrated imaging workflows. These partnerships also accelerate deployment of cloud and AI tools.
|
Stage |
Key Participants |
|
Components & Materials |
Detector, magnet, tube, and transducer suppliers |
|
System Manufacturing |
CT, MRI, X-ray, ultrasound, nuclear, and mammography makers |
|
Distribution & Sales |
Direct sales teams, distributors, and refurbishers |
|
Installation & Integration |
Site planners, installers, and PACS integrators |
|
Imaging Services |
Hospitals, diagnostic centers, and academic institutes |
|
Maintenance & Upgrades |
OEM service teams and independent service organizations |
Maintenance and upgrades is the most consequential stage of the chain. Service contracts and software upgrades keep systems productive and generate recurring revenue for manufacturers. Independent service organizations also compete for maintenance contracts on older systems. Software upgrades extend the life and capabilities of installed equipment.
Remote monitoring allows service teams to fix issues before failures occur. Predictive maintenance reduces downtime and improves patient scheduling. Uptime guarantees are common in large service contracts. Service performance is a major factor in contract renewals.
Technology Landscape in the United States Medical Imaging Industry
Photon-Counting CT and Spectral Imaging
Photon-counting detectors measure individual X-ray photons, improving resolution and enabling material differentiation. This improves visualization of small vessels, plaque, and lesions. Spectral imaging also reduces the need for additional scans. Lower radiation doses are especially important for pediatric patients.
Photon-counting systems are expected to expand from academic centers to community hospitals. Pricing and reimbursement will influence the pace of adoption. Early clinical results are encouraging broader interest from cardiology and oncology departments.
Helium-Free MRI and AI Reconstruction
Sealed magnets and deep learning reconstruction reduce helium use and shorten MRI scan times. Faster scans improve patient comfort and increase daily capacity. Helium-free magnets lower operating costs and environmental impact. Compact designs reduce space requirements in busy facilities. AI-driven protocols simplify complex exams for technologists.
Faster exams improve patient experience and access. Shorter scan times also allow imaging departments to reduce wait lists for MRI and CT appointments.
AI-Powered Ultrasound and Enterprise Imaging
AI guidance automates ultrasound measurements, while cloud-based enterprise imaging connects images across care settings. Enterprise imaging platforms support remote reading and collaboration among radiologists. Cloud imaging reduces on-site storage needs and supports AI deployment. Interoperability standards support image sharing between hospitals. Zero-footprint viewers enable access from any device.
This supports teleradiology and after-hours coverage. Teleradiology groups help hospitals manage overnight and weekend reading demand, while cloud platforms make it easier to distribute studies to subspecialty radiologists across different states.
Market Segmentation Analysis
The report covers the following segments:
|
Segment Category |
Leading Segment |
Market Share |
Year |
|
Product |
X-Ray Imaging Systems |
25.0% |
2025 |
|
Application |
🔒 |
🔒 |
2025 |
|
End User |
Hospitals |
62.0% |
2025 |
|
Region |
South |
35.0% |
2025 |

By Product
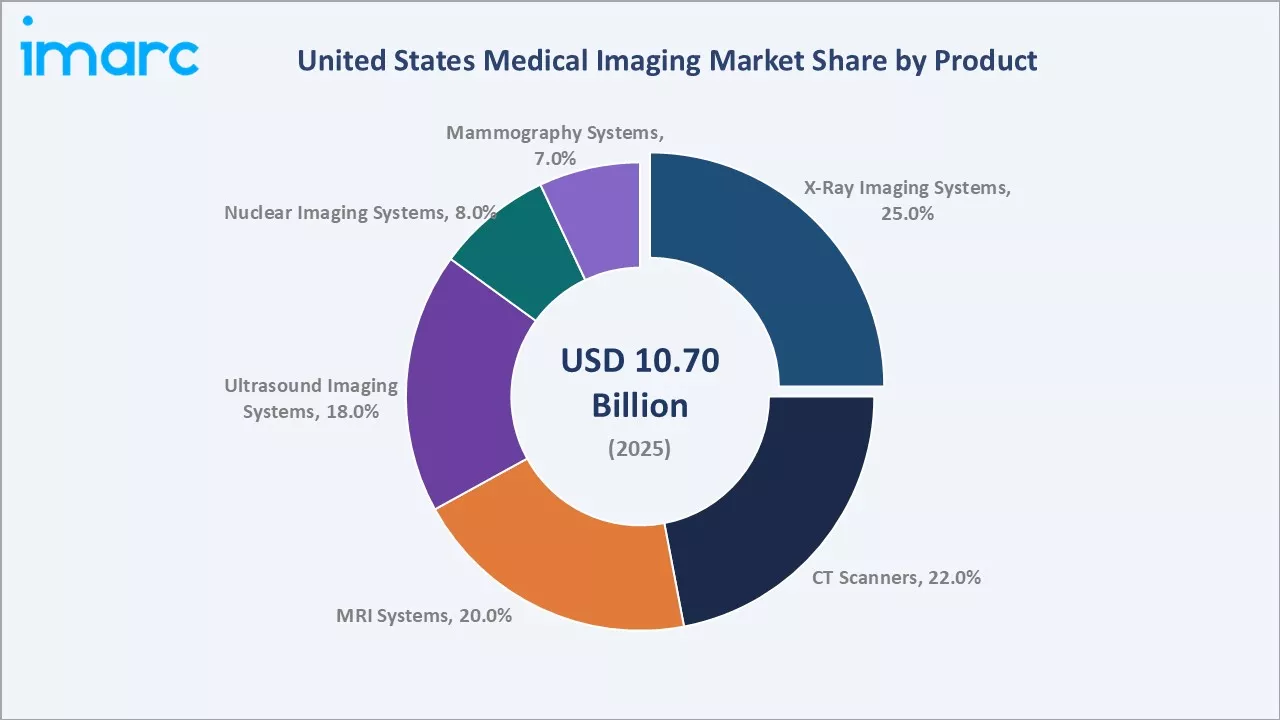
X-ray imaging systems lead at 25.0% (2025). They are widely used for first-line diagnosis in hospitals, emergency departments, and clinics. Digital radiography has largely replaced film and computed radiography in hospitals. Mobile and portable X-ray systems are growing in hospital use. Dose reduction technology improves patient safety.
To access detailed market analysis, Request Sample
Fluoroscopy and C-arm systems support surgical and interventional procedures.
CT scanners at 22.0% grow at ~3.0% CAGR, MRI systems at 20.0% at ~2.9%, and ultrasound at 18.0% fastest at ~3.3%. Nuclear imaging at 8.0% grows at ~2.9% and mammography at 7.0% at ~2.4%. Theranostics and PET imaging are supporting demand for nuclear imaging systems.
Mammography demand is supported by breast cancer screening programs and 3D tomosynthesis. Mammography systems increasingly include AI detection tools. Ultrasound demand is supported by obstetrics, cardiology, and point-of-care use.
By End User
Hospitals lead at 62.0% (2025). They perform most emergency, inpatient, and complex imaging procedures. Large health systems standardize equipment across multiple hospitals through enterprise agreements.
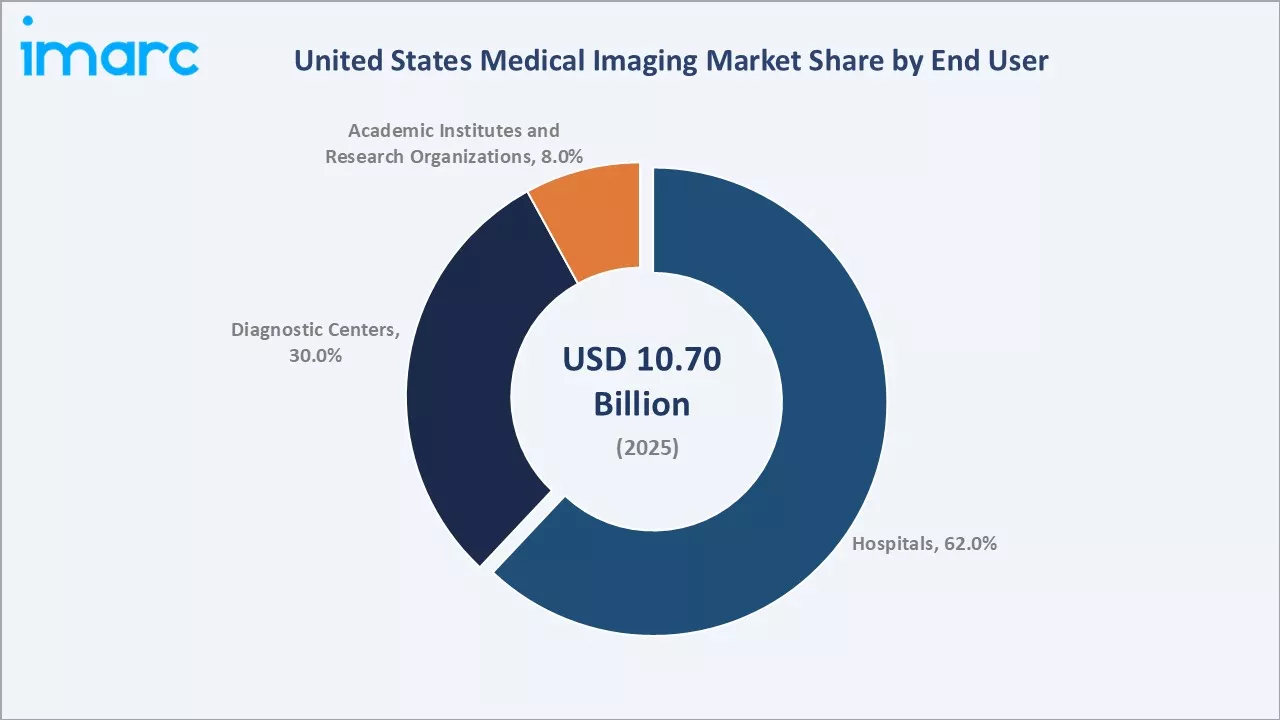
Diagnostic centers at 30.0% grow fastest at ~3.2% CAGR, driven by outpatient imaging growth. Academic institutes and research organizations at 8.0% grow at ~2.7%, supported by research funding. These institutions often adopt the most advanced systems first. Research use supports demand for high-field MRI and PET/MR systems.
Research collaborations with manufacturers support innovation and clinical validation. Academic centers also train the next generation of radiologists.
Regional Market Insights
|
Region |
Share (2025) |
Key United States Medical Imaging Market Drivers & Characteristics |
|
South |
35.0% |
Large, aging population and major health systems in Texas and Florida. |
|
West |
26.0% |
Large integrated systems and early adoption of advanced technology. |
|
Midwest |
21.0% |
Major academic medical centers and regional hospital networks. |
|
Northeast |
18.0% |
Dense academic hospitals and research institutions. |
The South's 35.0% market leadership reflects its large and growing population, major health systems in Texas and Florida, and rising demand from older adults. The West's 26.0% reflects large integrated delivery networks and early adoption of advanced imaging technology. California hosts many leading academic medical centers and imaging innovators.
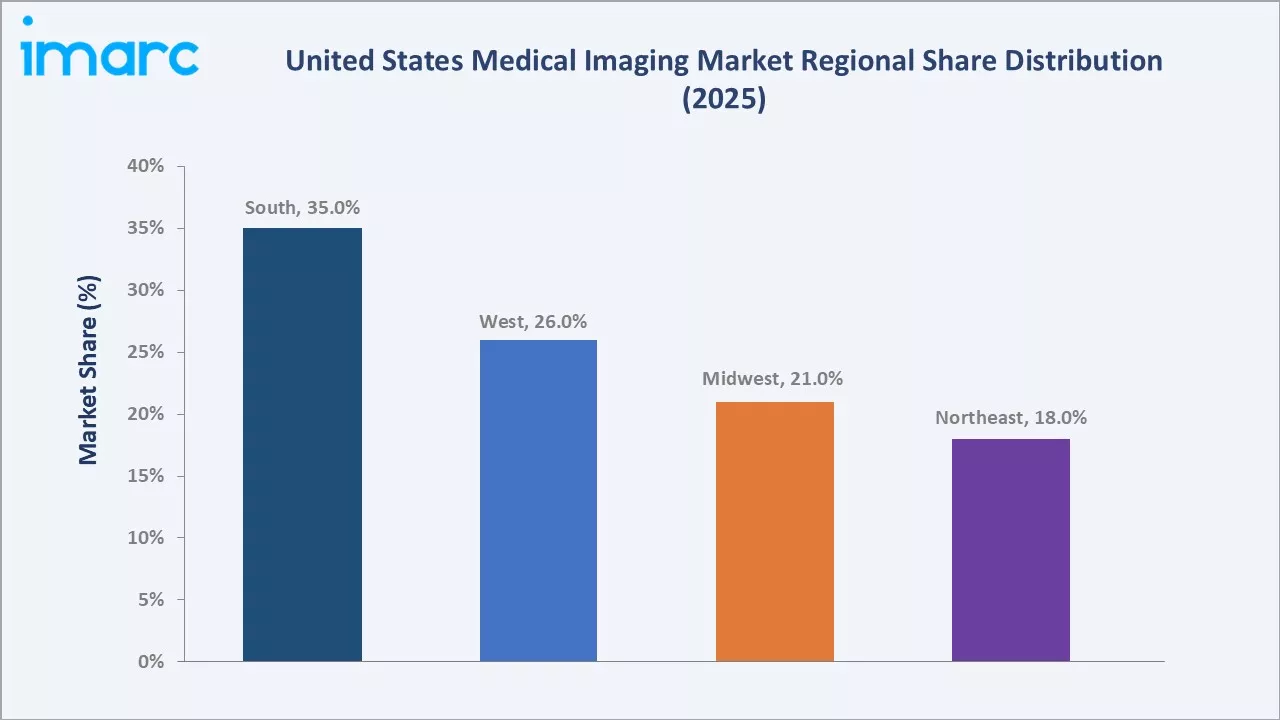
The Midwest's 21.0% reflects major academic medical centers and regional hospital networks. The Northeast's 18.0% is the smallest share, but dense academic hospitals and research institutions support strong demand for advanced systems. Boston, New York, and Philadelphia host leading academic imaging programs. The region also has high imaging utilization rates.
Older equipment replacement is a key driver in the region. Strong hospital networks support adoption of advanced systems.
Competitive Landscape
The United States medical imaging market is led by global manufacturers with broad modality portfolios, alongside specialists in women’s health, X-ray, and ultrasound. Competition centers on image quality, AI capabilities, dose reduction, service, and total cost of ownership. Strong service and uptime guarantees are important purchasing factors.
Group purchasing organizations influence pricing and vendor selection. Long-term service contracts create stable revenue for manufacturers. Vendor reputation and reliability strongly influence buyer loyalty.
|
Company |
Key Brands |
Market Position |
Core Strength |
| GE HealthCare | Revolution CT, SIGNA MRI, Photonova | Market Leader | Broad modality portfolio and installed base. |
| Siemens Medical Solutions USA, Inc. | Naeotom Alpha, Magnetom, Biograph | Market Leader | Leader in CT and photon-counting technology. |
| Koninklijke Philips N.V. | Spectral CT, BlueSeal, EPIQ | Strong Challenger | Spectral CT and helium-free MRI. |
| Canon Medical Systems, USA | Aquilion, Vantage, Aplio | Strong Challenger | CT, MRI, and ultrasound portfolio. |
| Hologic, Inc. | 3Dimensions, Genius AI | Innovator | Leader in mammography and breast imaging. |
| Carestream Health | DRX systems | Niche Player | Digital radiography systems. |
| Shenzhen Mindray Bio-Medical Electronics Co., Ltd. | Resona, TE Air | Niche Player | Cost-effective ultrasound systems. |
The most important competitive dynamic is the race to commercialize photon-counting CT, helium-free MRI, and AI-enabled workflows. Vendors with strong service networks and installed bases are best placed to win replacement cycles. Smaller vendors compete through price, specialty focus, and flexible service.
Partnerships with AI developers are increasingly common among leading vendors. Vendors also compete on sustainability and energy efficiency. Environmental goals are becoming part of hospital procurement criteria.
Key Company Profiles
GE HealthCare
GE HealthCare is a leading medical technology company offering CT, MRI, X-ray, ultrasound, nuclear imaging, and mammography systems along with imaging agents and digital solutions.
- Key Brands: Revolution CT, SIGNA MRI, Photonova Spectra.
- Recent Developments: In February 2026, GE HealthCare received FDA clearance for SIGNA Sprint with Freelium, SIGNA Bolt, and the SIGNA One AI workflow ecosystem.
- Strategic Focus: Advancing cloud-enabled enterprise imaging following its acquisition of Intelerad.
Siemens Medical Solutions USA, Inc.
Siemens Medical Solutions USA, Inc. is the U.S. arm of Siemens Healthineers, offering CT, MRI, molecular imaging, X-ray, and ultrasound systems.
- Key Brands: Naeotom Alpha, Magnetom, Biograph.
- Recent Developments: In January 2026, Siemens Healthineers received FDA clearance for its Biograph One second-generation PET/MR scanner.
- Strategic Focus: Expanding helium-free MRI with the 70cm Magnetom Flow platform.
Koninklijke Philips N.V.
Koninklijke Philips N.V. is a global health technology company with strengths in CT, MRI, ultrasound, and image-guided therapy.
- Key Brands: Spectral CT Verida, Rembra CT, EPIQ.
- Recent Developments: In April 2026, Philips received FDA 510(k) clearance for its Rembra platform, including Rembra CT, Rembra RT, and Areta RT.
- Strategic Focus: Expanding AI-powered ultrasound through Elevate Plus for EPIQ Elite and Affiniti systems.
Market Concentration Analysis
The United States medical imaging market is highly concentrated, with a few global manufacturers holding most CT, MRI, and molecular imaging sales, while ultrasound and X-ray are more competitive.
Market concentration remains stable as large vendors win long-term enterprise agreements, while specialists compete in mammography, digital radiography, and portable ultrasound. Refurbished equipment also provides lower-cost options for smaller providers. Third-party service providers compete strongly in maintenance. Pricing pressure is strongest in mature modalities such as X-ray.
Advanced modalities remain dominated by established global brands.
Investment & Growth Opportunities
Highest Growth Segments
Ultrasound imaging systems (~3.3% CAGR through point-of-care use), diagnostic centers (~3.2% CAGR through outpatient growth), the South (~3.1% CAGR through population growth), and CT scanners (~3.0% CAGR through photon-counting adoption) represent the highest-growth investment areas through 2034.
Emerging Investment Opportunities
AI-enabled imaging software and helium-free MRI are among the most promising opportunities, improving efficiency and lowering costs. Imaging center expansion is another attractive area for investment.
Investment Themes
- Outpatient imaging: Diagnostic centers expand capacity.
- Service and upgrades: Lifecycle services create recurring revenue.
Future Market Outlook (2026-2034)
The United States medical imaging market is projected to grow from USD 10.70 Billion in 2025 to USD 11.08 Billion in 2026, reaching USD 13.81 Billion by 2034, registering a CAGR of 2.78% during 2026-2034.
The anchor value of USD 12.28 Billion in 2030 marks a point at which AI reconstruction should be standard across modalities. By then, photon-counting CT should be widely adopted in large hospitals. Outpatient centers should account for a larger share of imaging procedures.
Three structural forces define United States medical imaging market growth through 2034 demographic demand; technology replacement; and outpatient expansion. Together, these forces support steady growth across products and regions. Replacement demand will provide a stable base for market revenue.
AI software is expected to become a larger part of vendor revenue. Service and digital solutions will further support recurring income.
Research Methodology
Primary Research
Primary research comprised structured interviews with industry stakeholders, including imaging equipment manufacturers, distributors, radiologists, hospital administrators, and imaging center operators across the United States.
Secondary Research
Secondary research covered company press releases, FDA clearances, CMS data, and industry reports. Over 50 credible secondary sources were reviewed, compared, and cross-checked for accuracy and consistency across datasets.
Forecasting Models
Market revenue forecasts were developed using an installed base and replacement model: system shipments by product, end user, and region multiplied by average selling prices, with segment results aggregated to total market value.
Assumptions were validated through detailed discussions with experienced industry experts, radiology leaders, and equipment suppliers across the United States.
United States Medical Imaging Market Report Scope:
| Report Features | Details |
|---|---|
| Base Year of the Analysis | 2025 |
| Historical Period | 2020-2025 |
| Forecast Period | 2026-2034 |
| Units | Billion USD |
| Scope of the Report | Exploration of Historical Trends and Market Outlook, Industry Catalysts and Challenges, Segment-Wise Historical and Future Market Assessment:
|
| Products Covered | CT Scanners, X-Ray Imaging Systems, MRI Systems, Ultrasound Imaging Systems, Nuclear Imaging Systems, Mammography Systems |
| Applications Covered | Obstetrics and Gynecology Health, Orthopedics and Musculoskeletal, Neuro and Spine, Cardiovascular and Thoracic, General Imaging, Breast Health, Others |
| End Users Covered | Hospitals, Diagnostic Centers, Academic Institutes and Research Organizations |
| Regions Covered | Northeast, Midwest, South, West |
| Companies Covered | GE HealthCare, Siemens Medical Solutions USA, Inc., Koninklijke Philips N.V., Canon Medical Systems, USA, Hologic, Inc., Carestream Health, Shenzhen Mindray Bio-Medical Electronics Co., Ltd., etc. |
| Customization Scope | 10% Free Customization |
| Post-Sale Analyst Support | 10-12 Weeks |
| Delivery Format | PDF and Excel through Email (We can also provide the editable version of the report in PPT/Word format on special request) |
Key Benefits for Stakeholders:
- IMARC’s industry report offers a comprehensive quantitative analysis of various market segments, historical and current market trends, market forecasts, and dynamics of the United States medical imaging market from 2020-2034.
- The research report provides the latest information on the market drivers, challenges, and opportunities in the United States medical imaging market.
- Porter's five forces analysis assists stakeholders in assessing the impact of new entrants, competitive rivalry, supplier power, buyer power, and the threat of substitution. It helps stakeholders to analyze the level of competition within the United States medical imaging industry and its attractiveness.
- The competitive landscape allows stakeholders to understand their competitive environment and provides an insight into the current positions of key players in the market.
Frequently Asked Questions About the United States Medical Imaging Market Report
The market size is estimated at USD 11.08 Billion in 2026, supported by aging demographics and equipment upgrades.
The market grows at 2.78% CAGR during 2026-2034, reaching USD 13.81 Billion by 2034.
X-ray imaging systems lead at 25.0%, owing to wide first-line diagnostic use.
Hospitals lead at 62.0%, performing most emergency and complex imaging.
The South leads at 35.0%, driven by its large and aging population.
Leading companies include GE HealthCare, Siemens Medical Solutions USA, Inc., Koninklijke Philips N.V., Canon Medical Systems, USA, Hologic, Inc., Carestream Health, and Shenzhen Mindray Bio-Medical Electronics Co., Ltd., among others.
The market is projected to reach approximately USD 12.28 Billion by 2030.
Key trends include photon-counting CT, helium-free MRI, AI reconstruction, and outpatient imaging growth.
Need more help?
- Speak to our experienced analysts for insights on the current market scenarios.
- Include additional segments and countries to customize the report as per your requirement.
- Gain an unparalleled competitive advantage in your domain by understanding how to utilize the report and positively impacting your operations and revenue.
- For further assistance, please connect with our analysts.
 Request Customization
 Speak to an Analyst
 Request Brochure
 Inquire Before Buying
Benefits of Customization
- Personalize this research
- Triangulate with your data
- Get data as per your format and definition
- Gain a deeper dive into a specific application, geography, customer, or competitor
- Any level of personalization
Get in Touch With Us
UNITED STATES
Phone: +1-201-971-6302
INDIA
Phone: +91-120-433-0800
UNITED KINGDOM
Phone: +44-753-714-6104
Email: [email protected]
Client Testimonials























Related Reports

Choose your plan
*Please note that the prices mentioned below are starting prices for each bundle type. Kindly contact our team for further details.*
Single User License
- 1 User License, Access on 2 Devices
- PDF Report + Excel Dataset (Password Protected)
- Lifetime Access
- No Printing Rights
- 10% Free Report Customization
- 10–12 Weeks of Analyst Support
Five User License
- Access for 5 Users, 2 Devices per User
- PDF Report + Excel Dataset (Password Protected)
- Lifetime Access
- Dedicated Account Manager
- 12–14 Weeks of Analyst Support
- No Printing Rights
- 15% Free Report Customization
- 25% Discount on Your Next Purchase
Corporate User License
- Unlimited User Access (Within Your Organization)
- PDF Report + Excel Dataset
- Lifetime Access
- Dedicated Account Manager
- 14–20 Weeks of Analyst Support
- No Printing Rights
- 20% Free Report Customization
- 30% Discount on Your Next Purchase
Essential Insights
What's included:
3 reports
- Lifetime Access
- PDF Reports
- Excel Datasets
- 2 Weeks of Free Analyst Support
- 2 User Licenses
- Access on 2 Devices
- Printing Rights
- Complimentary PowerPoint (PPT) Version
- Complimentary License Upgrade
Professional Access
What's included:
5 reports
- Lifetime Access
- PDF Reports
- Excel Datasets
- 8 Weeks of Free Analyst Support
- 2 User Licenses
- Access on 2 Devices
- Printing Rights
- Complimentary PowerPoint (PPT) Version
- Complimentary License Upgrade
Business Advantage
What's included:
8 reports
- Lifetime Access
- PDF Reports
- Excel Datasets
- 14 Weeks of Free Analyst Support
- 2 User Licenses
- Access on 2 Devices
- Printing Rights
- Complimentary PowerPoint (PPT) Version
- Complimentary License Upgrade
Enterprise Intelligence
What's included:
10 reports
- Lifetime Access
- PDF Reports
- Excel Datasets
- 20 Weeks of Free Analyst Support
- 2 User Licenses
- Access on 2 Devices
- Printing Rights
- Complimentary PowerPoint (PPT) Version
- Complimentary License Upgrade