
United States Metal Casting Market Report by Process (Sand Casting, Gravity Casting, High-Pressure Die Casting (HPDC), Low-Pressure Die Casting (LPDC), and Others), Material Type (Cast Iron, Aluminum, Steel, Zinc, Magnesium, and Others), End Use (Automotive and Transportation, Equipment and Machine, Building and Construction, Aerospace and Military, and Others), Component (Alloy Wheels, Clutch Casing, Cylinder Head, Cross Car Beam, Crank Case, Battery Housing, and Others), Vehicle Type (Passenger Cars, Light Commercial Vehicles, Heavy Commercial Vehicles), Electric and Hybrid Type (Hybrid Electric Vehicles (HEV), Battery Electric Vehicles (BEV), Plug-In Hybrid Electric Vehicles (PHEV)), Application (Body Assemblies, Engine Parts, Transmission Parts, and Others), and Region 2026-2034
Market Overview:
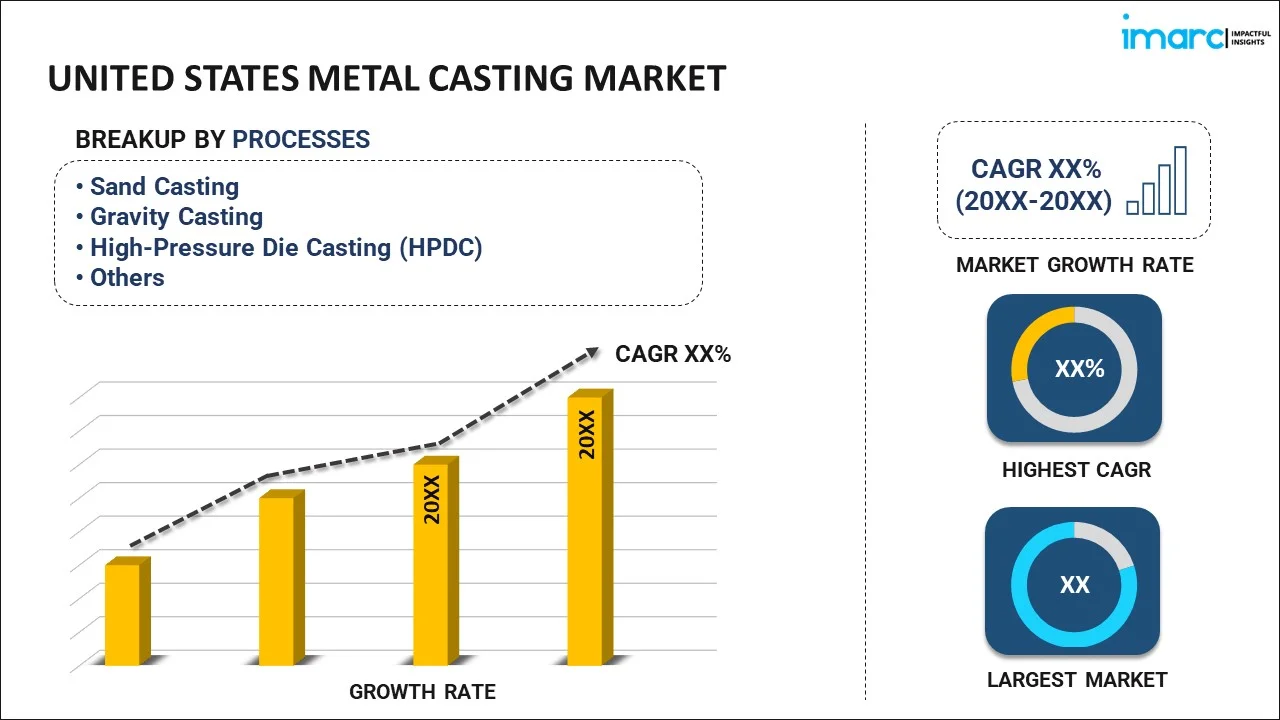
The United States metal casting market size reached USD 33.6 Billion in 2025. Looking forward, IMARC Group expects the market to reach USD 59.2 Billion by 2034, exhibiting a growth rate (CAGR) of 6.29% during 2026-2034.
|
Report Attribute
|
Key Statistics
|
|---|---|
|
Base Year
|
2025
|
|
Forecast Years
|
2026-2034
|
|
Historical Years
|
2020-2025
|
| Market Size in 2025 | USD 33.6 Billion |
| Market Forecast in 2034 | USD 59.2 Billion |
| Market Growth Rate (2026-2034) | 6.29% |
Access the full market insights report Request Sample
Metal casting refers to the process of pouring hot liquid metal into a mold containing a hollow cutout or cavity of the desired shape. It is usually made from non-ferrous metals, like zinc, copper, aluminum, magnesium, lead, pewter, and ten-based alloys. Metal casting is utilized in pipes and oil fittings, mining and oilfield machinery, internal combustion engines, and railroads. In the United States, metal castings have gained traction as they can produce complex-shaped objects at a relatively lower price as compared to other manufacturing processes.
The United States is a dominant market in the North American region for metal casting. The resurgence of manufacturing activities and the continuous demand from the construction sector are propelling the growth of the market. Apart from this, metal casting is extensively used in manufacturing aircraft, home appliances and surgical equipment as it aids in improving energy efficiency, lowering the cost of production and enhancing the quality. Moreover, with the rising environmental concerns, various countries have adopted stringent legislations to regulate the emissions from the manufacturing sector. For instance, the United States Environmental Protection Agency (US EPA) has imposed several restrictions to reduce emission levels in power plants. As a result, automotive equipment manufacturers are increasingly investing in research and development (R&D) activities to introduce new products and adopt simulation-based advanced casting technologies to create perfect defect-free castings.
Key Market Segmentation:
IMARC Group provides an analysis of the key trends in each sub-segment of the United States metal casting market report, along with forecasts at the country and regional level from 2026-2034. Our report has categorized the market based on process, material type, end use, component, vehicle type, electric & hybrid type, and application.
Breakup by Process:
To get detailed segment analysis of this market Request Sample
- Sand Casting
- Gravity Casting
- High-Pressure Die Casting (HPDC)
- Low-Pressure Die Casting (LPDC)
- Others
Breakup by Material Type:
- Cast Iron
- Aluminum
- Steel
- Zinc
- Magnesium
- Others
Breakup by End Use:
- Automotive and Transportation
- Equipment and Machine
- Building and Construction
- Aerospace and Military
- Others
Automotive and Transportation Market: Breakup by Component:
- Alloy Wheels
- Clutch Casing
- Cylinder Head
- Cross Car Beam
- Crank Case
- Battery Housing
- Others
Automotive and Transportation Market: Breakup by Vehicle Type:
- Passenger Cars
- Light Commercial Vehicles
- Heavy Commercial Vehicles
Automotive and Transportation Market: Breakup by Electric and Hybrid Type:
- Hybrid Electric Vehicles (HEV)
- Battery Electric Vehicles (BEV)
- Plug-In Hybrid Electric Vehicles (PHEV)
Automotive and Transportation Market: Breakup by Application:
- Body Assemblies
- Engine Parts
- Transmission Parts
- Others
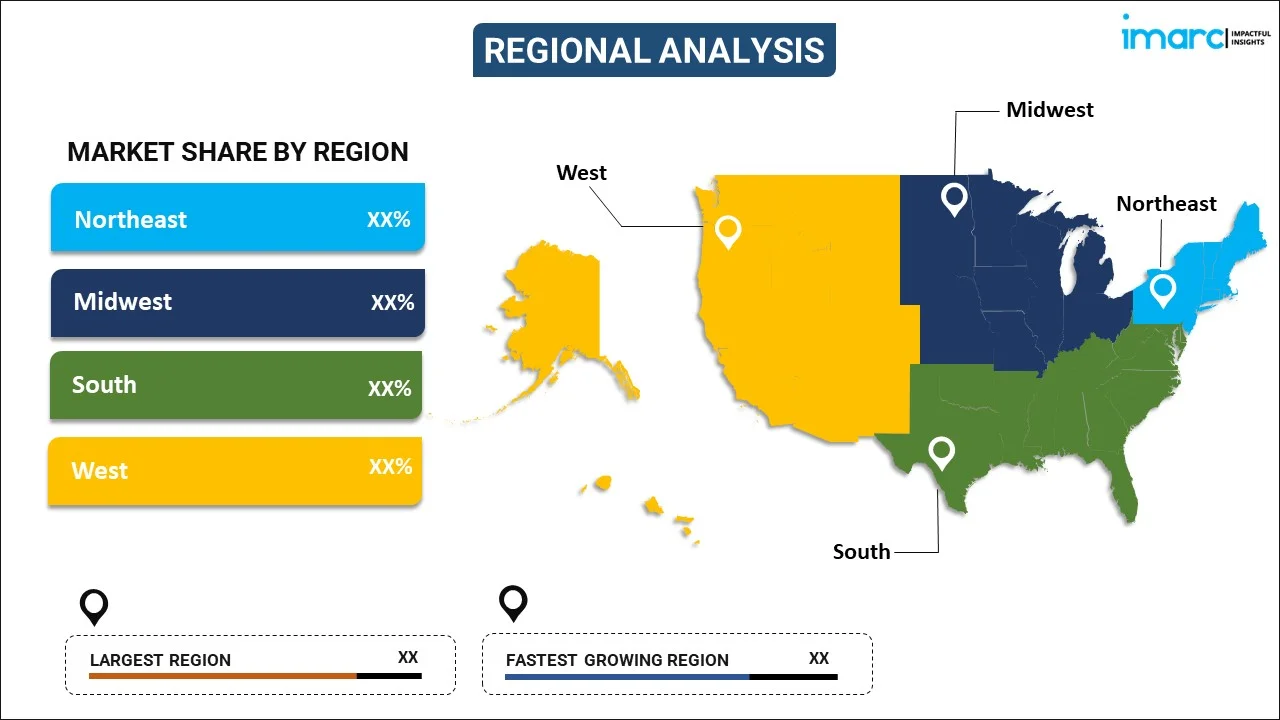
Breakup by Region:
To get detailed regional analysis of this market Request Sample
- Northeast
- Midwest
- South
- West
Competitive Landscape:
The competitive landscape of the industry has also been examined along with the profiles of the key players.
Report Coverage:
| Report Features | Details |
|---|---|
| Base Year of the Analysis | 2025 |
| Historical Period | 2020-2025 |
| Forecast Period | 2026-2034 |
| Units | Billion USD |
| Segment Coverage | Process, Material Type, End Use, Component, Vehicle Type, Electric and Hybrid Type, Application, Region |
| Region Covered | Northeast, Midwest, South, West |
| Customization Scope | 10% Free Customization |
| Post-Sale Analyst Support | 10-12 Weeks |
| Delivery Format | PDF and Excel through Email (We can also provide the editable version of the report in PPT/Word format on special request) |
Key Questions Answered in This Report:
- How has the United States metal casting market performed so far and how will it perform in the coming years?
- What has been the impact of COVID-19 on the United States metal casting market?
- What are the key regional markets?
- What is the breakup of the market based on the process?
- What is the breakup of the market based on the material type?
- What is the breakup of the market based on the end use?
- What is the breakup of the market based on the component?
- What is the breakup of the market based on the vehicle type?
- What is the breakup of the market based on the electric and hybrid type?
- What is the breakup of the market based on the application?
- What are the various stages in the value chain of the industry?
- What are the key driving factors and challenges in the industry?
- What is the structure of the United States metal casting market and who are the key players?
- What is the degree of competition in the industry?
Need more help?
- Speak to our experienced analysts for insights on the current market scenarios.
- Include additional segments and countries to customize the report as per your requirement.
- Gain an unparalleled competitive advantage in your domain by understanding how to utilize the report and positively impacting your operations and revenue.
- For further assistance, please connect with our analysts.
 Request Customization
 Speak to an Analyst
 Request Brochure
 Inquire Before Buying
Benefits of Customization
- Personalize this research
- Triangulate with your data
- Get data as per your format and definition
- Gain a deeper dive into a specific application, geography, customer, or competitor
- Any level of personalization
Get in Touch With Us
UNITED STATES
Phone: +1-201-971-6302
INDIA
Phone: +91-120-433-0800
UNITED KINGDOM
Phone: +44-753-714-6104
Email: [email protected]
Client Testimonials


.webp)


