
United States Trout Market Size, Share, Trends and Forecast by Trout Type, Trout Size, Distribution, Form, and Region, 2026-2034
United States Trout Market Size, Share, Trends & Forecast (2026-2034)
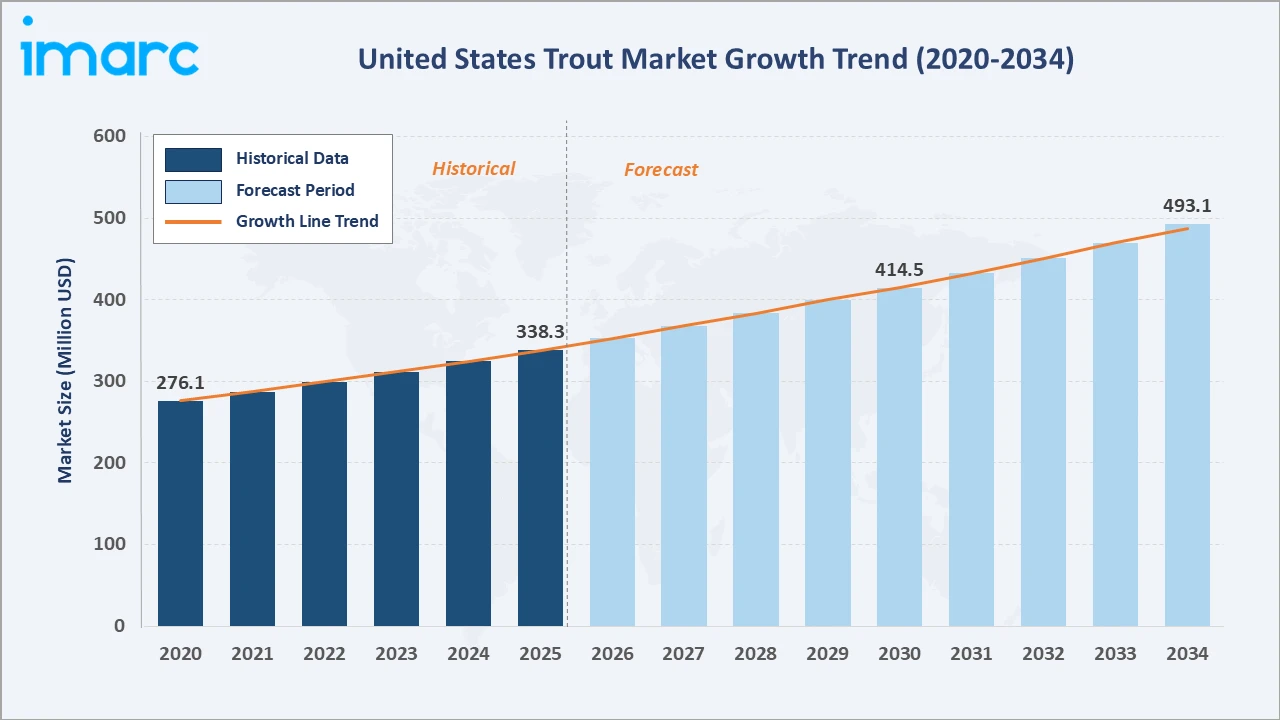
The United States trout market reached USD 338.3 Million in 2025 and is projected to reach USD 493.1 Million by 2034, growing at a CAGR of 4.15% during 2026-2034. Rising consumer demand for high-protein, omega-3-rich seafood, expanding foodservice and restaurant sector utilization of premium trout varieties, sustained recreational fishing activity with over 74 million licensed anglers across the country, and government-backed aquaculture development programs supporting domestic trout production are the primary growth catalysts.
Market Snapshot
|
Metric |
Value |
|
Market Size (2025) |
USD 338.3 Million |
|
Forecast Market Size (2034) |
USD 493.1 Million |
|
CAGR (2026-2034) |
4.15% |
|
Base Year |
2025 |
|
Historical Period |
2020-2025 |
|
Forecast Period |
2026-2034 |
The West leads regionally with a 36.4% market share in 2025, driven by Idaho's dominant role as America's largest commercial trout-producing state, hosting Riverence Holdings and Clear Springs Foods operations in the Magic Valley. Rainbow trout commands the dominant trout type share at 62.8%, while large trout size represents the leading size category at 58.6%, reflecting strong foodservice demand for whole-fish and fillet applications at restaurants and retail seafood counters nationwide.
To get more information on this market, Request Sample
The United States trout market is underpinned by three structural forces: a health-conscious consumer population increasingly choosing trout for its superior omega-3 fatty acid, high-quality protein, and low-mercury profile relative to larger predatory fish; a domestic aquaculture industry center in Idaho's Magic Valley that has achieved egg-to-plate supply chain control and year-round consistent supply; and a robust sport fishing culture that sustains both live trout stocking demand and consumer familiarity that translates into retail and foodservice purchase intent.
Executive Summary
The United States trout market is experiencing steady, sustained growth, supported by nutritional trends, expanding culinary applications, and the maturation of the domestic aquaculture industry. The market was valued at USD 338.3 Million in 2025 and is forecast to reach USD 493.1 Million by 2034 at a CAGR of 4.15%.
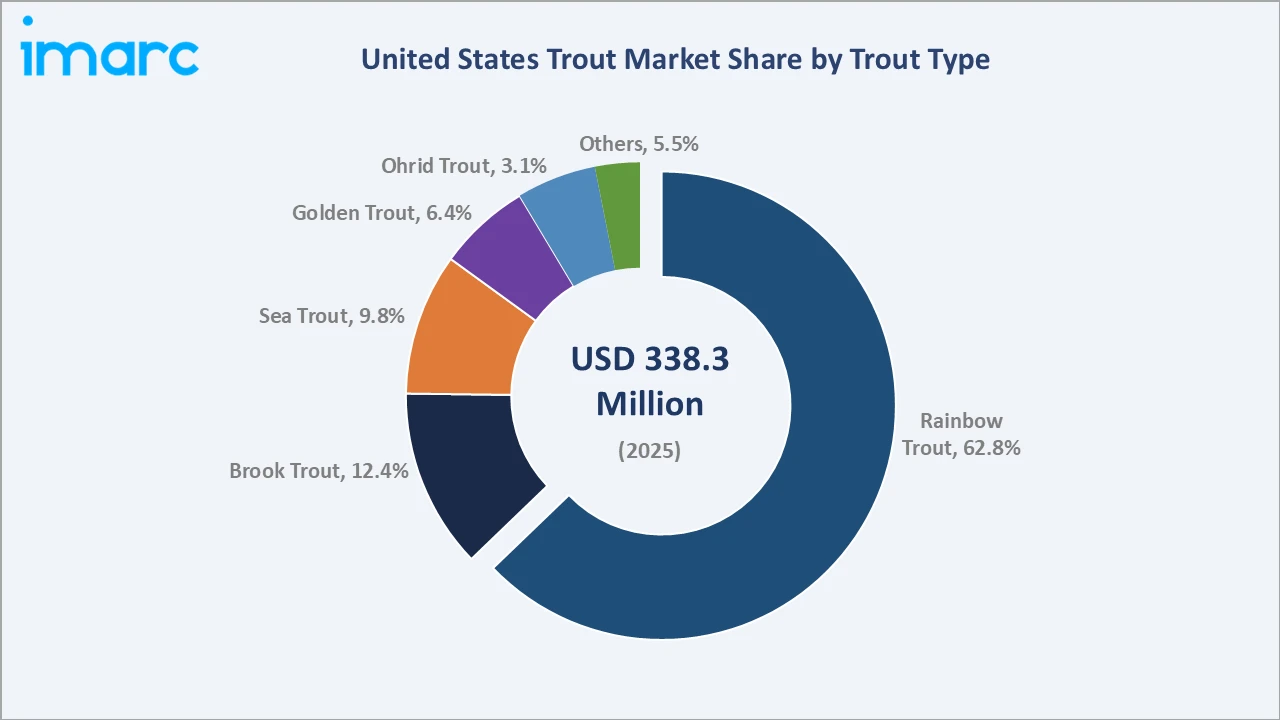
Rainbow trout dominates trout type at 62.8% of 2025 market value, reflecting its near-universal availability from domestic aquaculture operations, versatility across whole-fish, fillet, smoked, and canned product formats, and strong recognition among US consumers and chefs as the benchmark domestic trout variety.
Large trout size commands 58.6% of the size segment, serving whole-fish foodservice presentations, fillet production, and value-added smoking and processing applications where larger fish body size enables consistent portioning. Small trout at 41.4% serves pan-size restaurant preparations, recreational stocking programs requiring stocking-size fish, and consumer retail fresh whole-fish formats.
Key Market Insights
|
Insight |
Data |
| Largest Trout Type | Rainbow Trout – 62.8% share (2025) |
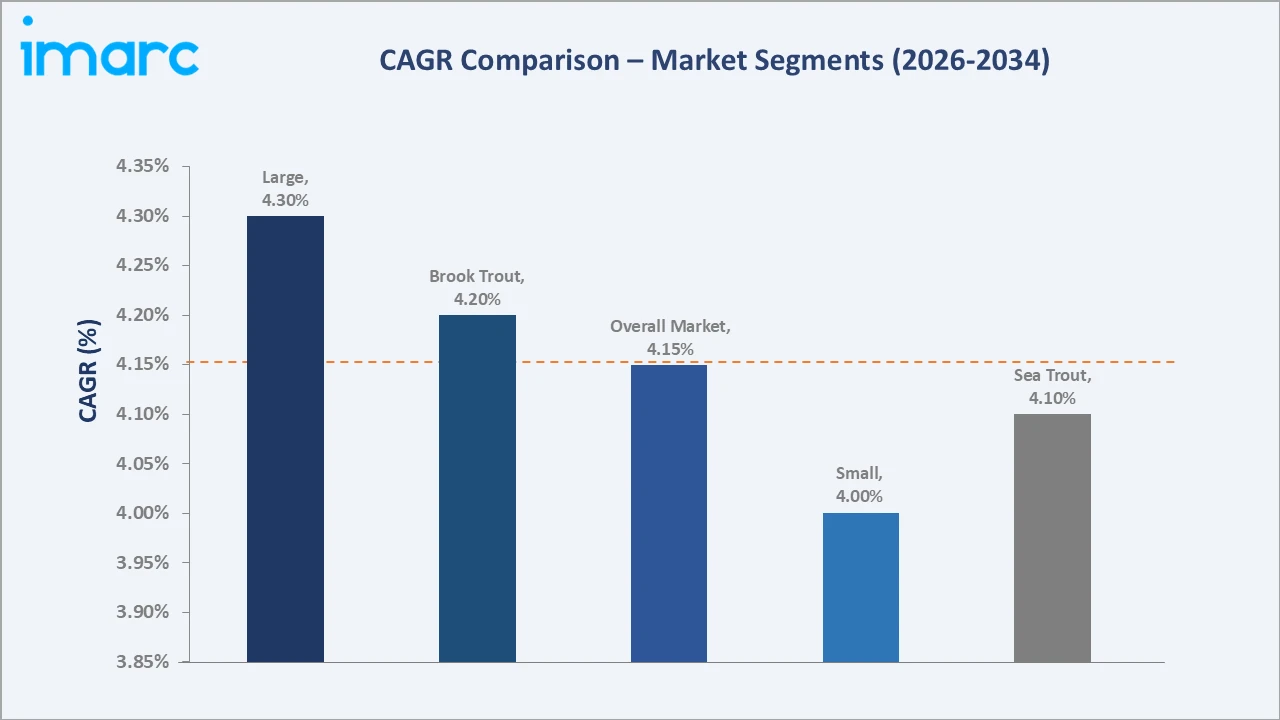
| Fastest Growing Trout Type | Brook Trout – ~4.2% CAGR (2026-2034) |
| Dominant Trout Size | Large – 58.6% share (2025) |
| Fastest Growing Size |
Small – ~4.0% CAGR (2026-2034) |
| Leading Region |
West – 36.4% share (2025) |
| Top Companies |
Riverence Holdings LLC, Sunburst Trout Farms, Rushing Waters Fisheries, Mowi ASA |
Key Analytical Observations Supporting The Above Data:
- Rainbow trout accounts for 62.8% of US trout market value in 2025, reflecting its dominance across all consumption channels from recreational stocking to retail fresh fish to high-volume foodservice.
- Large trout size’s 58.6% dominance (2025) reflects the foodservice sector's preference for fish of 1.5–3.5 pounds body weight that enable consistent fillet portioning at restaurants, combined with the value-added processing industry's requirement for larger fish that deliver sufficient flesh yield per unit for smoked fillet, trout pate, and ready-to-eat product formats that command premium retail price points.
- The West's 36.4% regional dominance (2025) is anchored by Idaho's position as the United States' largest commercial trout producer, accounting for approximately 70% of total US farm-raised trout output. The Idaho trout industry, centered on the Magic Valley's natural aquifer system, has produced rainbow trout commercially for over a century and now operates the most cost-efficient, high-volume aquaculture production infrastructure.
- The 4.15% market CAGR reflects a maturing but healthy growth profile driven by incremental per-capita seafood consumption gains and premiumization trends elevating average selling prices for branded and certified sustainable trout products.
United States Trout Market Overview
Trout is a freshwater fish species belonging to the Salmonidae family, encompassing several commercially and recreationally significant species including rainbow trout, brook trout, brown trout, golden trout, sea trout, and Ohrid trout. In the United States, trout occupies a unique market position as both a commercially farmed food fish and a recreationally significant sport fish supporting a stocking, guide service, and associated fishing industry.
The US commercial trout market is highly concentrated in domestic production, with Idaho's Magic Valley accounting for approximately 70% of farmed rainbow trout output through natural spring-water flow-through raceways that deliver exceptional water quality and low energy operating costs. The US trout industry's unique advantage creates a natural cost advantage over recirculating aquaculture systems (RAS) and net-pen marine trout farming that sustains Idaho's production dominance despite competition from Norwegian and Chilean salmon-trout imports.
Market Dynamics
To evaluate market opportunities, Request Sample
Market Drivers
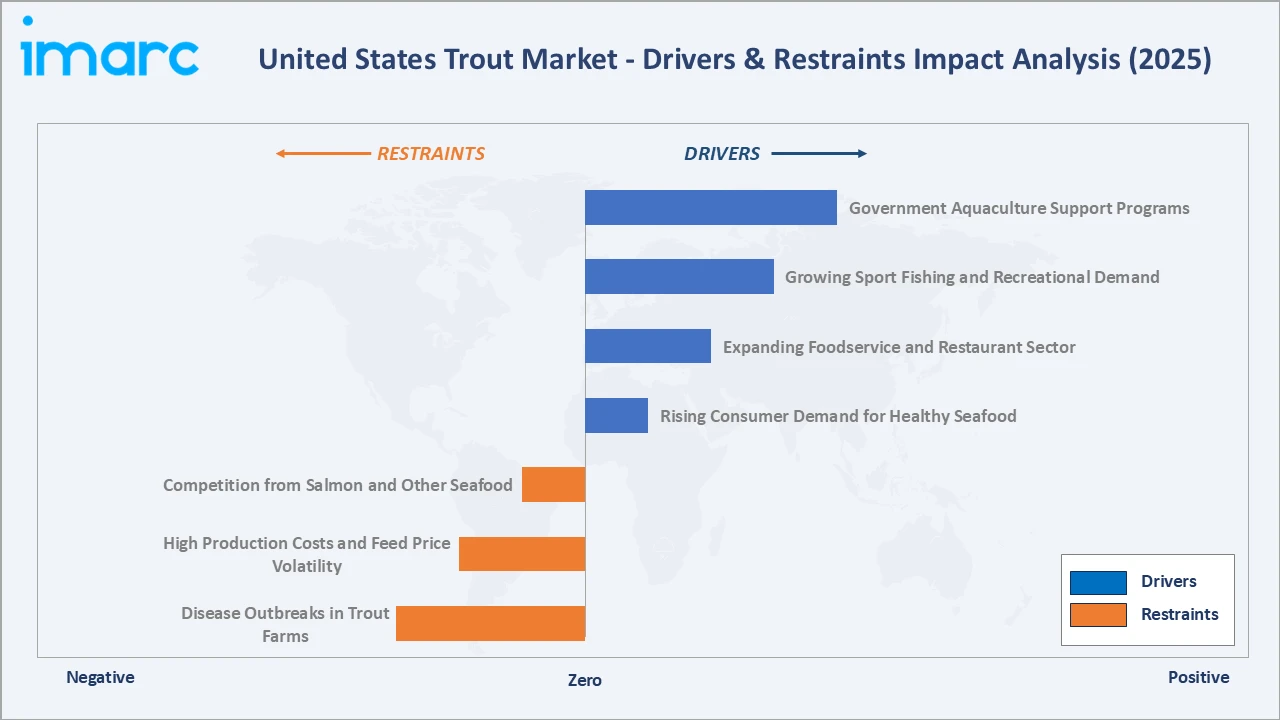
- Rising Consumer Demand for Healthy Seafood: US consumers are increasingly prioritizing seafood for its health benefits, with the 2020–2025 Dietary Guidelines for Americans recommending 8+ ounces of seafood per week for adults, creating substantial headroom for seafood consumption growth. Rainbow trout is particularly well-positioned as a health choice: it delivers 17–23 g protein and 1.5g omega-3 fatty acids per 3-oz serving, is low in mercury relative to larger predatory fish, and is domestically produced with environmental footprint advantages over imported alternatives.
- Expanding Foodservice and Restaurant Sector: The US foodservice industry, generating USD 1.1 Trillion in annual revenue (2024), represents the primary growth channel for premium trout products. Farm-to-table restaurant trends have elevated domestically sourced, traceable seafood as a menu differentiator, with Idaho rainbow trout and Sunburst smoked trout featuring on menus at Michelin-starred restaurants and casual dining chains alike.
- Growing Sport Fishing and Recreational Demand: The United States hosts approximately 74 million licensed freshwater anglers who collectively spend approximately USD 70 Billion annually on fishing-related expenditures. Trout is the most sought freshwater game fish in the US, with trout fishing generating more than 94 million angler-days for an average of 10 days per angler.
- Government Aquaculture Support Programs: The USDA Agricultural Marketing Service (AMS) and National Oceanic and Atmospheric Administration (NOAA) Fisheries both operate programs supporting domestic aquaculture development and seafood marketing. NOAA's Marine Aquaculture program provides grant funding for aquaculture innovation and market development, while USDA's AMS manages origin labelling requirements that advantage domestically-produced trout over imports at retail.
Market Restraints
- Disease Outbreaks in Trout Farms: Infectious hematopoietic necrosis (IHN), bacterial coldwater disease, and whirling disease represent persistent biosecurity threats to US trout aquaculture operations, with major outbreak events capable of eliminating 20–60% of inventory at affected farms.
- High Production Costs and Feed Price Volatility: Trout aquaculture feed is subject to global fishmeal and fish oil market price volatility driven by Peruvian anchovy fishery performance, competing demand from Atlantic salmon and shrimp aquaculture, and shipping cost fluctuations.
- Competition from Salmon and Other Seafood: Atlantic salmon is the primary competitive protein against which trout is positioned in the US seafood marketplace. Norwegian, Chilean, and Canadian farmed Atlantic salmon benefit from superior brand recognition among US consumers, greater retail SKU breadth, and established distributor and retail buyer relationships that trout must displace to grow share.
Market Opportunities
- Value-Added Trout Products: The development and retail expansion of value-added trout products represents the highest-margin growth opportunity in the US trout market. Sunburst Trout Farms' smoked trout products distributed through Whole Foods Market and specialty grocery have demonstrated consumer willingness to pay USD 12–18 per pound for premium value-added trout versus USD 6–9 for commodity fresh fillet.
- E-Commerce and Direct-to-Consumer Channels: The COVID-19 pandemic-accelerated adoption of online seafood purchasing has created a direct-to-consumer channel where artisanal trout producers and smokehouses can capture full retail margin without intermediary markup. Platforms including Crowd Cow, ButcherBox, and direct producer e-commerce sites have enabled small and mid-size US trout producers to access premium consumer segments in major metropolitan markets that lack local trout farming infrastructure.
- International Export Market Development: US-produced rainbow trout, certified to Best Aquaculture Practices (BAP) and Global Aquaculture Alliance (GAA) standards, commands quality premiums in European, Japanese, and Canadian export markets where domestic trout supply is insufficient to meet premium foodservice demand.
Market Challenges
- Water Rights and Environmental Regulation: Idaho's spring-water trout aquaculture depends on secure, perpetual water rights to the Snake River Plain aquifer, a shared resource facing increasing competition from agricultural irrigation, municipal water supply expansion, and aquifer recharge concerns driven by droughts and reduced snowpack from climate change.
- Limited Consumer Brand Awareness: Unlike Atlantic salmon, which benefits from decades of industry-coordinated marketing investment and near-universal consumer recognition at US retail, trout lacks an industry-wide marketing program comparable to the Norway Seafood Council's salmon promotion activities.
Emerging Market Trends
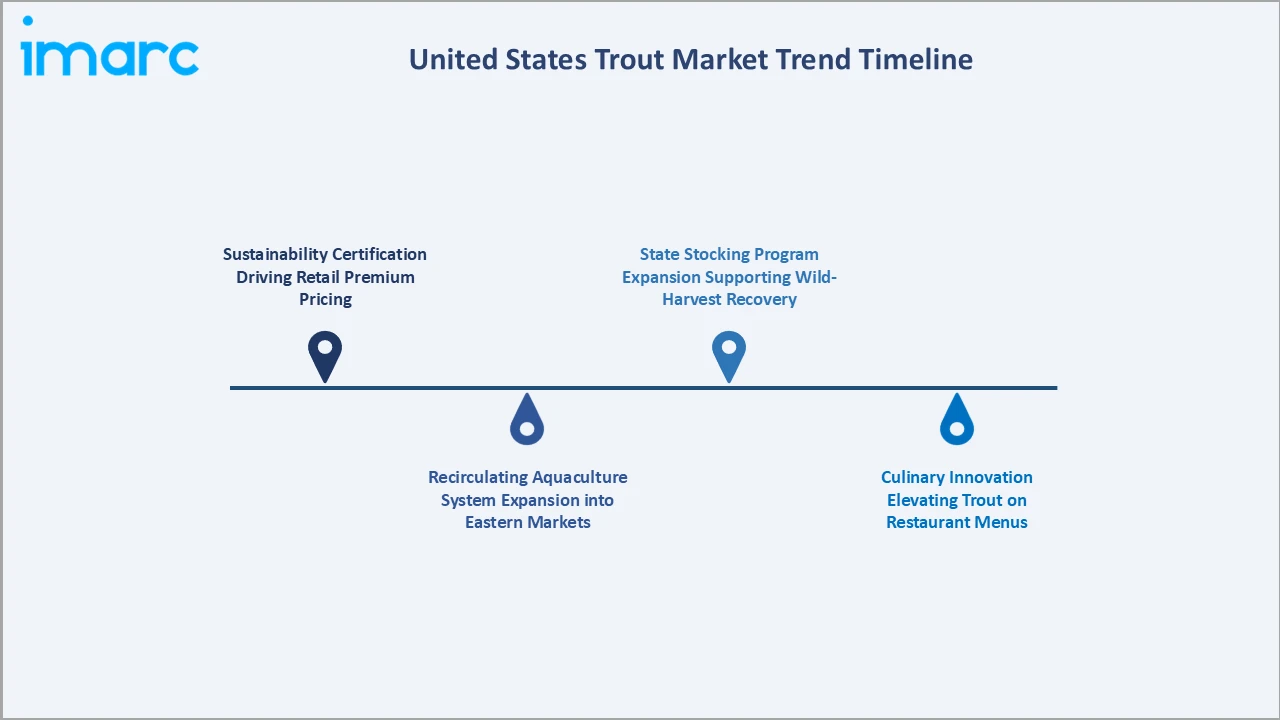
1. Sustainability Certification Driving Retail Premium Pricing
BAP (Best Aquaculture Practices) and Aquaculture Stewardship Council (ASC) certification of US trout farms is enabling certified producers to command 15–25% price premiums at major retailers including Whole Foods Market, Trader Joe's, and Costco, which mandate third-party sustainability certification for farmed seafood procurement. Riverence Holdings has pursued BAP certification across all 14 of its farm operations, enabling premium positioning of its branded products.
2. Recirculating Aquaculture System Expansion into Eastern Markets
While Idaho's natural spring-water aquaculture maintains the cost advantage for bulk commodity rainbow trout production, land-based recirculating aquaculture systems (RAS) are enabling trout farming in Eastern US markets where natural water resources are unavailable. Companies are producing premium, ultra-fresh trout within 24–48 hours of major metropolitan consumer markets, a freshness advantage that Idaho flow-through operations served by long-haul refrigerated trucking cannot match.
3. Culinary Innovation Elevating Trout on Restaurant Menus
Celebrity chef endorsement and culinary media coverage have elevated rainbow trout's fine dining profile, with Riverence's golden rainbow trout featured on menus at nationally recognized restaurants. Food media platforms including Bon Appetit, Food & Wine, and NYT Cooking have published premium rainbow trout recipes reaching millions of home cooks, driving retail trout demand in high-income metropolitan markets.
4. State Stocking Program Expansion Supporting Wild-Harvest Recovery
The majority of US states operate active trout stocking programs, purchasing millions of trout annually from licensed hatcheries to stock public streams, lakes, and reservoirs for recreational angling. Post-COVID angling participation surged 20–25% in 2020–2021 as outdoor recreation was one of the few available leisure activities, and state fish and wildlife agencies responded with expanded stocking budgets to meet increased angler demand.
Industry Value Chain Analysis
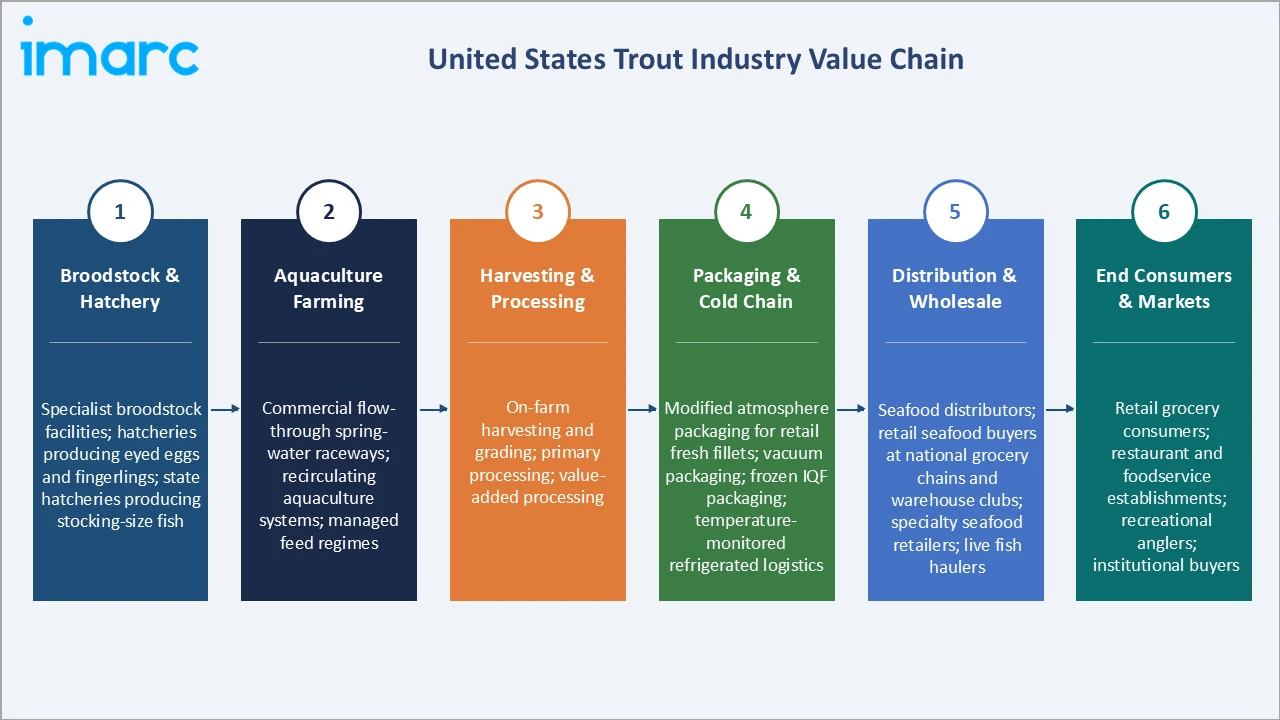
The US trout market value chain spans genetic broodstock management through consumer end-use, with the domestic industry's distinctive egg-to-plate supply chain control providing quality consistency and traceability advantages over imported seafood alternatives.
|
Stage |
Key Players / Examples |
| Broodstock & Hatchery |
Specialist broodstock facilities; hatcheries producing eyed eggs and fingerlings; state hatcheries producing stocking-size fish |
|
Aquaculture Farming |
Commercial flow-through spring-water raceways; recirculating aquaculture systems; managed feed regimes |
| Harvesting & Processing | On-farm harvesting and grading; primary processing; value-added processing |
| Packaging & Cold Chain | Modified atmosphere packaging for retail fresh fillets; vacuum packaging; frozen IQF packaging; temperature-monitored refrigerated logistics |
| Distribution & Wholesale | Seafood distributors; retail seafood buyers at national grocery chains and warehouse clubs; specialty seafood retailers; live fish haulers |
| End Consumers & Markets | Retail grocery consumers; restaurant and foodservice establishments; recreational anglers; institutional buyers |
Technology Landscape in the United States Trout Industry
Flow-Through Spring-Water Aquaculture Systems
Idaho's commercial trout industry is built upon flow-through raceway systems that continuously supply naturally temperature-stable spring water from the Snake River Plain aquifer through concrete or earthen raceways at production densities of 20–40 kg/m³ of raceway volume. The aquifer delivers water at a consistent 58°F (14°C) year-round without heating or cooling energy cost, and at sufficient dissolved oxygen levels to minimize aeration requirements.
Recirculating Aquaculture Systems (RAS)
RAS technology is enabling trout farming in geographic locations beyond Idaho's unique aquifer advantage. Modern trout RAS facilities monitor dissolved oxygen, CO2, pH, ammonia, nitrite, and temperature in real time through automated sensor networks, with AI-controlled feeding systems optimizing feed conversion ratios to reduce the primary production cost. RAS farms in Wisconsin, North Carolina, and emerging East Coast locations are accessing premium price markets through ultra-freshness, local sourcing marketing, and short supply chains to dense urban consumer populations.
Genetic Selection and Selective Breeding
US commercial trout producers have invested in decades-long selective breeding programs to develop proprietary trout strains optimized for specific commercial characteristics: faster growth rate, superior feed conversion efficiency, enhanced disease resistance to IHN and bacterial coldwater disease, and improved flesh color, texture, and omega-3 fatty acid content for premium product positioning.
Market Segmentation Analysis
The report covers the following segments:
|
Segment Category |
Leading Segment |
Market Share |
Year |
| Trout Type | Rainbow Trout |
62.8% |
2025 |
| Trout Size | Large |
58.6% |
2025 |
| Distribution |
🔒 |
🔒 |
2025 |
| Form |
🔒 |
🔒 |
2025 |
|
Region |
South |
34.6% |
2025 |

By Trout Type
The trout type segment is led by rainbow trout (62.8%), followed by brook trout (12.4%), sea trout (9.8%), golden trout (6.4%), Ohrid trout (3.1%), and others (5.5%). Rainbow trout's dominance reflects its dual role as both the primary commercial aquaculture species, produced in quantity by Idaho's spring-water farming systems at competitive pricing for mass-market retail and foodservice distribution, and a premium culinary species when produced as steelhead (seawater-migratory rainbow trout) or proprietary specialty strains.
To access detailed market analysis, Request Sample
Brook trout serves primarily the recreational stocking market, where it is the preferred species for cold-water stream environments across the Appalachians and Northeast. Sea trout, at 9.8%, serves coastal and Gulf South foodservice markets. Golden trout at 6.4% and Ohrid trout at 3.1% are specialty varieties commanding USD 25–45 per pound at premium restaurants and specialty retailers.
By Trout Size
The trout size segment is analyzed across large (58.6%) and small (41.4%). Large trout leads, driven by foodservice demand for 1.5–3.5 lb whole fish and the smoking and value-added processing industry's need for larger fish body size that enables economically viable fillet and smoked product yields.
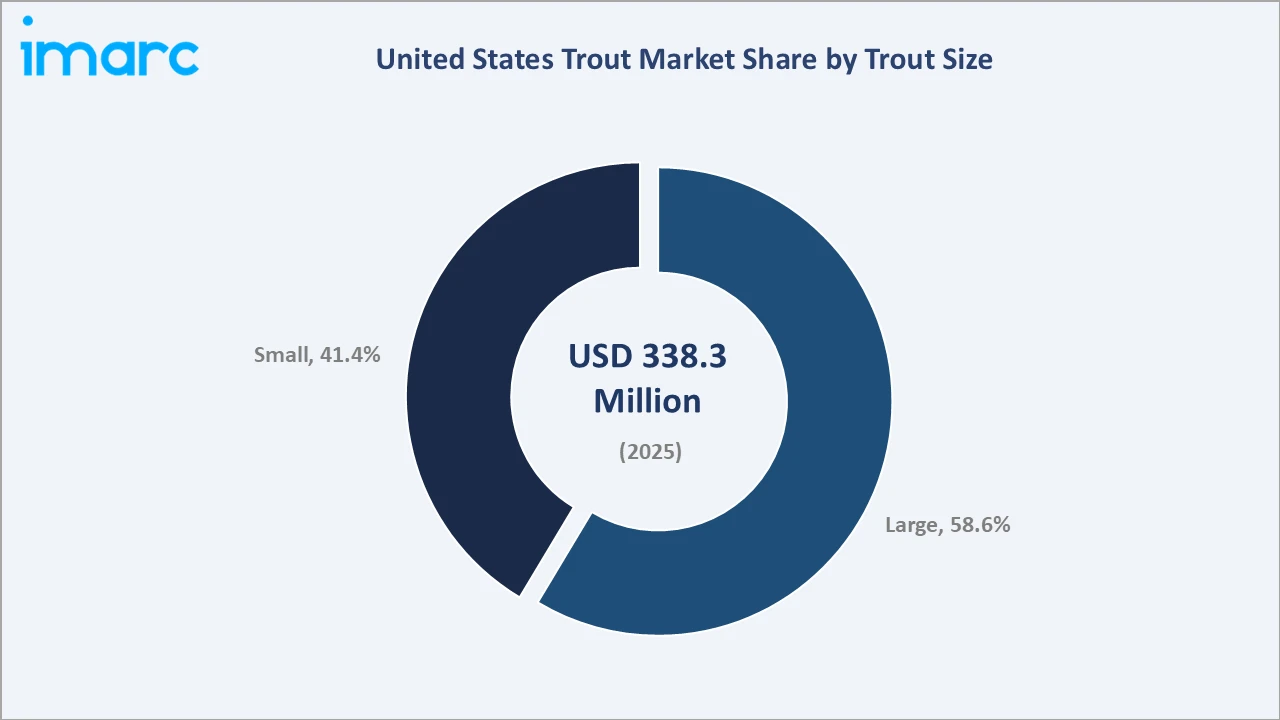
Small trout primarily serves the recreational stocking market (state agencies purchasing 8–12 inch catchable-size fish), pan-size restaurant preparations common in French and Italian cuisine, and consumer retail whole-fish fresh formats where 0.75–1.25 lb fish are preferred for individual home meal portions.
Regional Market Insights
The West's 36.4% market leadership reflects Idaho's position as the definitive center of US commercial trout production, with the Magic Valley's unique spring-water aquifer resource supporting continuous, year-round production of rainbow trout at volumes and cost structures unattainable in any other US region.
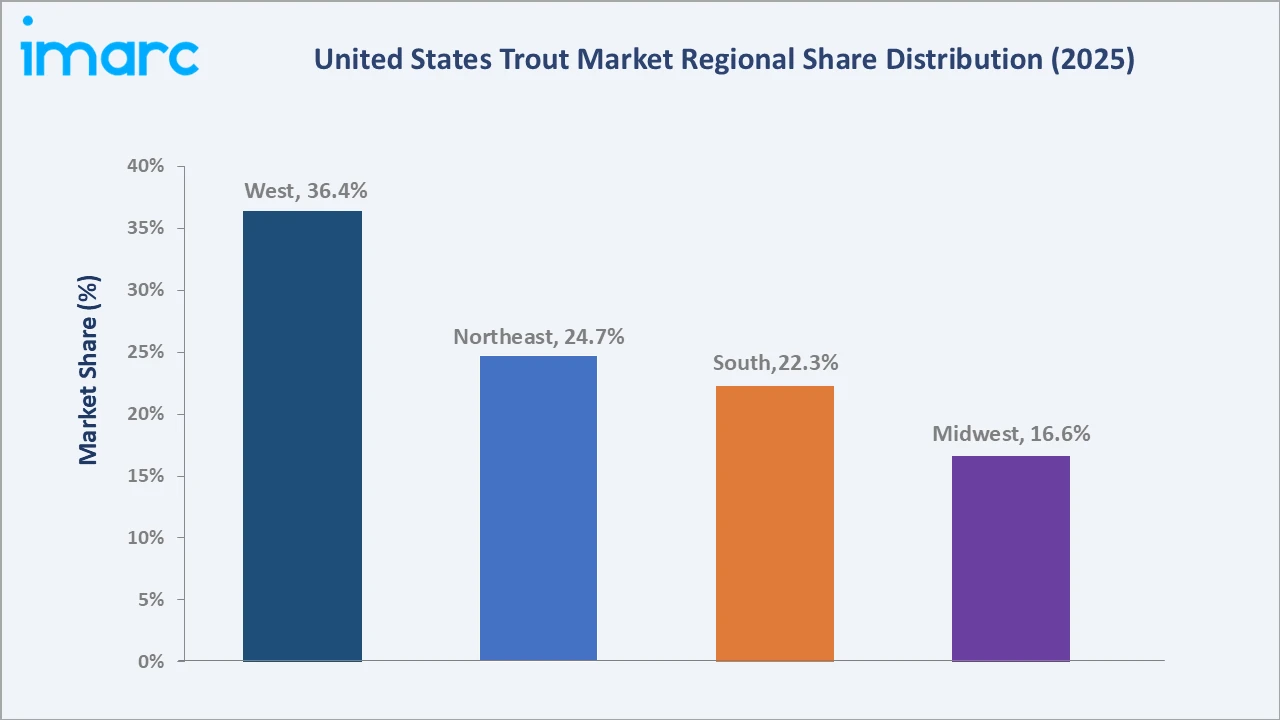
The Northeast at 24.7% represents the market's highest-density urban consumer base and greatest concentration of premium seafood restaurants that drive above-average trout product pricing and innovation.
|
Region |
Share (2025) |
Key Growth Drivers |
| West |
36.4% |
Idaho Magic Valley commercial spring-water rainbow trout aquaculture; Pacific Coast sport fishing activity; premium foodservice consumption in California and Pacific Northwest |
| Northeast |
24.7% |
High-density premium seafood foodservice market in major cities; Appalachian mountain recreational trout fishing tradition; artisanal RAS trout production proximate to urban consumer markets |
| South |
22.3% |
Gulf Coast sea trout commercial and recreational fishing activity; North Carolina artisanal aquaculture production; growing restaurant sector trout adoption |
| Midwest |
16.6% |
Great Lakes freshwater fishing culture supporting trout stocking and consumption; Wisconsin artisanal spring-water trout production; institutional foodservice demand for affordable domestic fresh fish |
Competitive Landscape
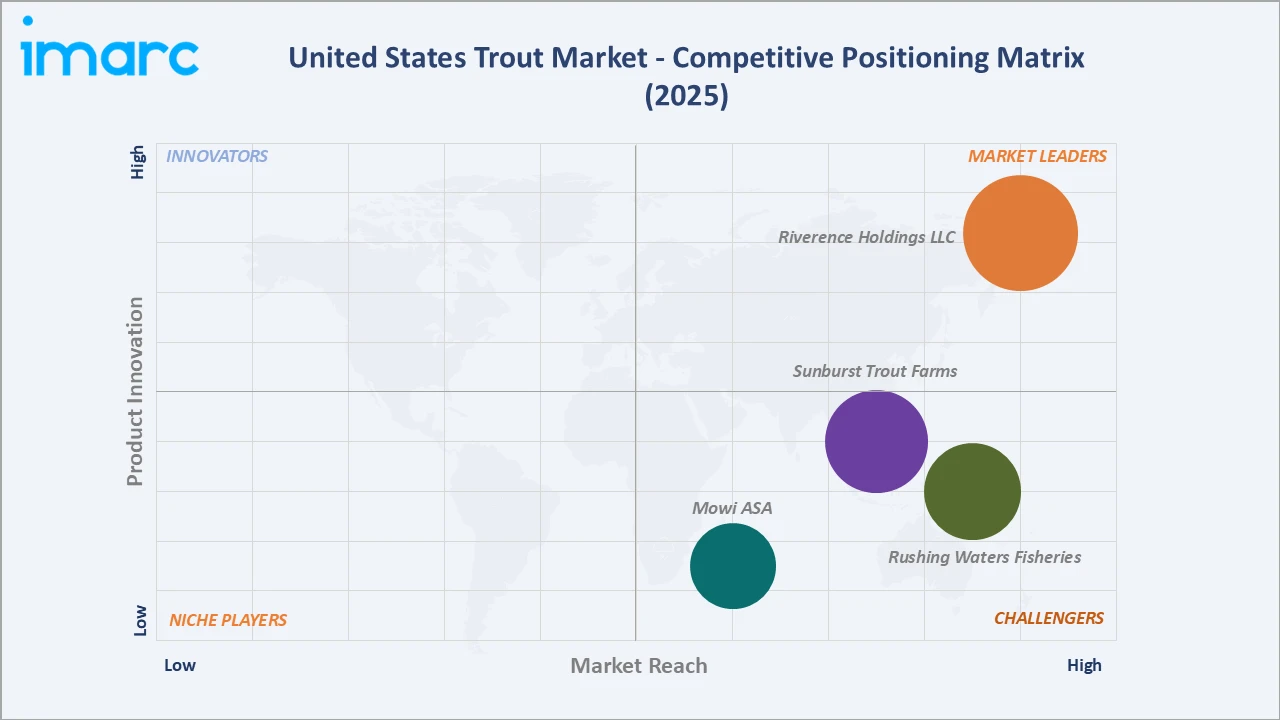
The US trout market is moderately concentrated at the commercial aquaculture production level, with key players commanding an estimated 55–65% of US farm-raised rainbow trout production volume.
|
Company |
Brand/Product |
Market Position |
Core Strength |
| Riverence Holdings LLC |
Rainbow Trout, Steelhead Trout, Frozen Retail Bags, Rainbow Trout Roe, Hot-Smoked Trout |
Market Leader |
Americas' largest land-based trout producer; BAP-certified; egg-to-plate supply chain; national distribution fleet |
| Sunburst Trout Farms |
Sunburst smoked trout, fresh rainbow trout fillets, among others |
Strong Challenger |
Southeastern US premium artisanal producer; Whole Foods Market supplier; award-winning smoked trout products |
| Rushing Waters Fisheries |
Smoked Rainbow Fillet Trout, Boneless Rainbow Trout Fillet |
Challenger |
Wisconsin artisanal RAS producer; ultra-fresh proximity to Midwest metro markets; restaurant and specialty retail focus; sustainable production credentials |
| Mowi ASA | Marine Harvest Farm Raised Trout Portions, Marine Harvest Farm Raised Steelhead Trout | Strong Challenger | Global salmon-trout major; established US retail and foodservice distribution; brand recognition; premium value-added product range |
Artisanal and regional producers compete on proximity to premium consumers, ultra-freshness, and locally sourced branding. International seafood companies compete in the premium smoked and value-added segment through their established US seafood distribution networks.
Key Company Profiles
Riverence Holdings LLC
Riverence Holdings LLC is one of the Americas' largest land-based trout producers following its February 2020 acquisition of Clear Springs Foods, Inc., providing complete egg-to-plate supply chain control.
- Product Portfolio: Rainbow trout, steelhead trout, frozen retail bags, rainbow trout roe, and hot-smoked trout.
- Strategic Focus: Premium market positioning through branded golden rainbow trout; BAP and sustainability certification expansion; direct foodservice account development in major cities; e-commerce and direct-to-consumer channel development; production capacity optimization at Magic Valley facilities.
Sunburst Trout Farms
Sunburst Trout Farms is one of the US Southeast's leading artisanal trout producers and the nation's most recognized smoked trout brand, producing and processing premium rainbow trout from its Blue Ridge Mountain spring-water operations.
- Product Portfolio: Sunburst smoked trout fillets (hot-smoked and cold-smoked); smoked trout dip and spread; fresh rainbow trout fillets; whole fresh trout; trout gravlax; gift sets and specialty packs for gourmet and holiday retail.
- Strategic Focus: National premium smoked trout brand building; e-commerce direct-to-consumer expansion; Whole Foods Market and specialty grocery distribution growth; value-added product innovation for holiday gift and gourmet retail segments; North Carolina spring-water production quality differentiation.
Market Concentration Analysis
The US commercial rainbow trout production market is highly concentrated following Riverence's 2020 acquisition of Clear Springs Foods, with the combined entity controlling an estimated 55–65% of US farm-raised rainbow trout production volume from their Idaho Magic Valley base. This concentration is structurally driven by the geographic specificity of the spring-water aquifer resource that enables low-cost production, creating a natural production cluster that is difficult to replicate elsewhere in the continental US.
Investment & Growth Opportunities
Fastest Growing Segments
Premium value-added trout products (smoked, cured, ready-to-eat) commanding USD 12–20/lb retail prices; artisanal RAS farms in proximity to Northeast and Midwest urban premium consumer markets; e-commerce direct-to-consumer smoked and specialty trout products; and international export of US premium certified trout to Japan, Canada, and European markets represent the highest-value growth investment vectors through 2034.
Emerging Market Expansion
The Eastern US — particularly the Northeast corridor from Boston to Washington DC — represents the most underpenetrated premium trout market relative to consumer income and seafood spending potential. Population density, restaurant sector concentration, and above-average willingness to pay for premium, locally sourced seafood create a compelling addressable market for premium proximity-to-market RAS trout producers.
Venture and Institutional Investment Trends
- Aquaculture innovation investment is flowing into trout RAS technology companies and land-based seafood producers following the success of Atlantic salmon RAS projects such as Atlantic Sapphire and Nordic Aquafarms, with trout RAS operators seen as lower technical risk than salmon RAS due to trout's more tolerant temperature and water chemistry requirements.
- Sustainable aquaculture certification bodies (ASC, BAP, Seafood Watch) and ESG-focused food industry investors are directing capital toward land-based trout aquaculture as a model of sustainable protein production with demonstrably lower environmental impact per kilogram than beef, pork, and even many marine fisheries.
Future Market Outlook (2026-2034)
The United States trout market is positioned for steady, value-accretive growth through 2034. From a base of USD 338.3 Million in 2025, the market is projected to reach USD 493.1 Million by 2034 at a CAGR of 4.15%, representing total incremental value creation of USD 154.8 Million. This growth is underpinned by structural demographic trends favoring seafood consumption, the premiumization of the domestic trout category through branding and value-added product development, and continued investment in domestic aquaculture production infrastructure.
By 2034, the US trout market will be characterized by greater product segmentation between commodity fresh whole fish (produced at scale by Idaho aquaculture) and premium branded products (smoked, value-added, specialty varieties) where margin concentration and brand investment are most intense. Rainbow trout will retain dominance at 60–65% of market value, but specialty varieties will command growing value share at premium price points.
Research Methodology
Primary Research
Primary research comprised structured interviews with over 60 industry participants in 2024–2025, including commercial trout aquaculture operators, seafood processors and smokehouses, retail seafood buyers, restaurant executive chefs, state fish and wildlife stocking program managers, seafood distributors, and trout industry association representatives across the West, Northeast, South, and Midwest regions.
Secondary Research
Secondary research encompassed USDA National Agricultural Statistics Service (NASS) trout aquaculture production data, NOAA Fisheries commercial landings and aquaculture statistics, American Sportfishing Association angler activity and license purchase data, US Fish and Wildlife Service trout stocking program reports, FDA seafood import and export trade statistics, state fish and wildlife agency stocking program budget reports, and trade publications.
Forecasting Models
Market size estimations were derived using top-down and bottom-up forecasting, incorporating USDA NASS historical trout production data by volume and farm-gate value, average selling price trajectory models accounting for premium product mix shift, recreational stocking program demand projections from state agency budget trends, import and export volume forecasts from US Census Bureau trade data, and regional demand growth modelling using per-capita seafood consumption trends by US Census region.
United States Trout Market Report Coverage:
| Report Features | Details |
|---|---|
| Base Year of the Analysis | 2025 |
| Historical Period | 2020-2025 |
| Forecast Period | 2026-2034 |
| Units | Million USD |
| Scope of the Report | Exploration of Historical and Forecast Trends, Industry Catalysts and Challenges, Segment-Wise Historical and Predictive Market Assessment:
|
| Trout Types Covered | Rainbow Trout, Ohrid Trout, Sea Trout, Golden Trout, Brook Trout, Others |
| Trout Sizes Covered | Large, Small |
| Distributions Covered |
|
| Forms Covered | Fresh, Frozen, Canned, Others |
| Regions Covered | Northeast, Midwest, South, West |
| Companies Covered | Riverence Holdings LLC, Sunburst Trout Farms, Rushing Waters Fisheries, Mowi ASA, etc. |
| Customization Scope | 10% Free Customization |
| Post-Sale Analyst Support | 10-12 Weeks |
| Delivery Format | PDF and Excel through Email (We can also provide the editable version of the report in PPT/Word format on special request) |
Key Benefits for Stakeholders:
- IMARC’s report offers a comprehensive quantitative analysis of various market segments, historical and current market trends, market forecasts, and dynamics of the United States trout market from 2020-2034.
- The research study provides the latest information on the market drivers, challenges, and opportunities in the United States trout market.
- Porter's five forces analysis assist stakeholders in assessing the impact of new entrants, competitive rivalry, supplier power, buyer power, and the threat of substitution. It helps stakeholders to analyze the level of competition within the United States trout industry and its attractiveness.
- Competitive landscape allows stakeholders to understand their competitive environment and provides an insight into the current positions of key players in the market.
Frequently Asked Questions About the United States Trout Market Report
The United States trout market reached USD 338.3 Million in 2025 and is projected to reach USD 493.1 Million by 2034, growing at a CAGR of 4.15% during 2026-2034.
The market is expected to grow at a CAGR of 4.15% during 2026-2034, driven by rising consumer demand for healthy, high-protein seafood, expanding foodservice adoption of premium trout varieties, sustained recreational fishing activity, and government aquaculture support programs.
The West leads with a 36.4% market share in 2025, anchored by Idaho's Magic Valley commercial rainbow trout aquaculture operations, which collectively produce the majority of US commercially farmed rainbow trout.
Rainbow trout dominates with a 62.8% share in 2025, reflecting its near-exclusive role as the primary US commercial aquaculture trout species, universal consumer recognition, and versatility across fresh whole fish, fillet, smoked, and value-added product applications.
Large trout holds the largest size segment share at 58.6%, driven by foodservice demand for 1.5–3.5 lb whole fish and fillet production, the smoking and value-added processing industry's requirement for larger fish body size, and institutional buyer preferences for larger, more economically portionable fish.
Some of the key players include Riverence Holdings LLC, Sunburst Trout Farms, Rushing Waters Fisheries, and Mowi ASA.
Key drivers include rising consumer demand for healthy omega-3-rich seafood, expanding restaurant and foodservice adoption of premium trout, aquaculture development support, and premiumization through value-added product development and sustainability certification.
Key challenges include disease outbreaks threatening farm biosecurity, high feed cost and aquafeed price volatility, competition from Atlantic salmon and other seafood proteins for shelf space and menu placement, and limited consumer brand awareness relative to Atlantic salmon.
Need more help?
- Speak to our experienced analysts for insights on the current market scenarios.
- Include additional segments and countries to customize the report as per your requirement.
- Gain an unparalleled competitive advantage in your domain by understanding how to utilize the report and positively impacting your operations and revenue.
- For further assistance, please connect with our analysts.
 Request Customization
 Speak to an Analyst
 Request Brochure
 Inquire Before Buying
Benefits of Customization
- Personalize this research
- Triangulate with your data
- Get data as per your format and definition
- Gain a deeper dive into a specific application, geography, customer, or competitor
- Any level of personalization
Get in Touch With Us
UNITED STATES
Phone: +1-201-971-6302
INDIA
Phone: +91-120-433-0800
UNITED KINGDOM
Phone: +44-753-714-6104
Email: [email protected]
Client Testimonials




.webp)




.webp)













Related Reports

Choose your plan
*Please note that the prices mentioned below are starting prices for each bundle type. Kindly contact our team for further details.*
Single User License
- 1 User License, Access on 2 Devices
- PDF Report + Excel Dataset (Password Protected)
- Lifetime Access
- No Printing Rights
- 10% Free Report Customization
- 10–12 Weeks of Analyst Support
Five User License
- Access for 5 Users, 2 Devices per User
- PDF Report + Excel Dataset (Password Protected)
- Lifetime Access
- Dedicated Account Manager
- 12–14 Weeks of Analyst Support
- No Printing Rights
- 15% Free Report Customization
- 25% Discount on Your Next Purchase
Corporate User License
- Unlimited User Access (Within Your Organization)
- PDF Report + Excel Dataset
- Lifetime Access
- Dedicated Account Manager
- 14–20 Weeks of Analyst Support
- No Printing Rights
- 20% Free Report Customization
- 30% Discount on Your Next Purchase
Essential Insights
What's included:
3 reports
- Lifetime Access
- PDF Reports
- Excel Datasets
- 2 Weeks of Free Analyst Support
- 2 User Licenses
- Access on 2 Devices
- Printing Rights
- Complimentary PowerPoint (PPT) Version
- Complimentary License Upgrade
Professional Access
What's included:
5 reports
- Lifetime Access
- PDF Reports
- Excel Datasets
- 8 Weeks of Free Analyst Support
- 2 User Licenses
- Access on 2 Devices
- Printing Rights
- Complimentary PowerPoint (PPT) Version
- Complimentary License Upgrade
Business Advantage
What's included:
8 reports
- Lifetime Access
- PDF Reports
- Excel Datasets
- 14 Weeks of Free Analyst Support
- 2 User Licenses
- Access on 2 Devices
- Printing Rights
- Complimentary PowerPoint (PPT) Version
- Complimentary License Upgrade
Enterprise Intelligence
What's included:
10 reports
- Lifetime Access
- PDF Reports
- Excel Datasets
- 20 Weeks of Free Analyst Support
- 2 User Licenses
- Access on 2 Devices
- Printing Rights
- Complimentary PowerPoint (PPT) Version
- Complimentary License Upgrade