
Cement Grinding Aid and Performance Enhancers Market Report by Type (Cement Grinding Aid, Cement Performance Enhancers), Application (Residential Building, Commercial Building, Industrial Building), and Region 2026-2034
Cement Grinding Aid and Performance Enhancers Market Size:
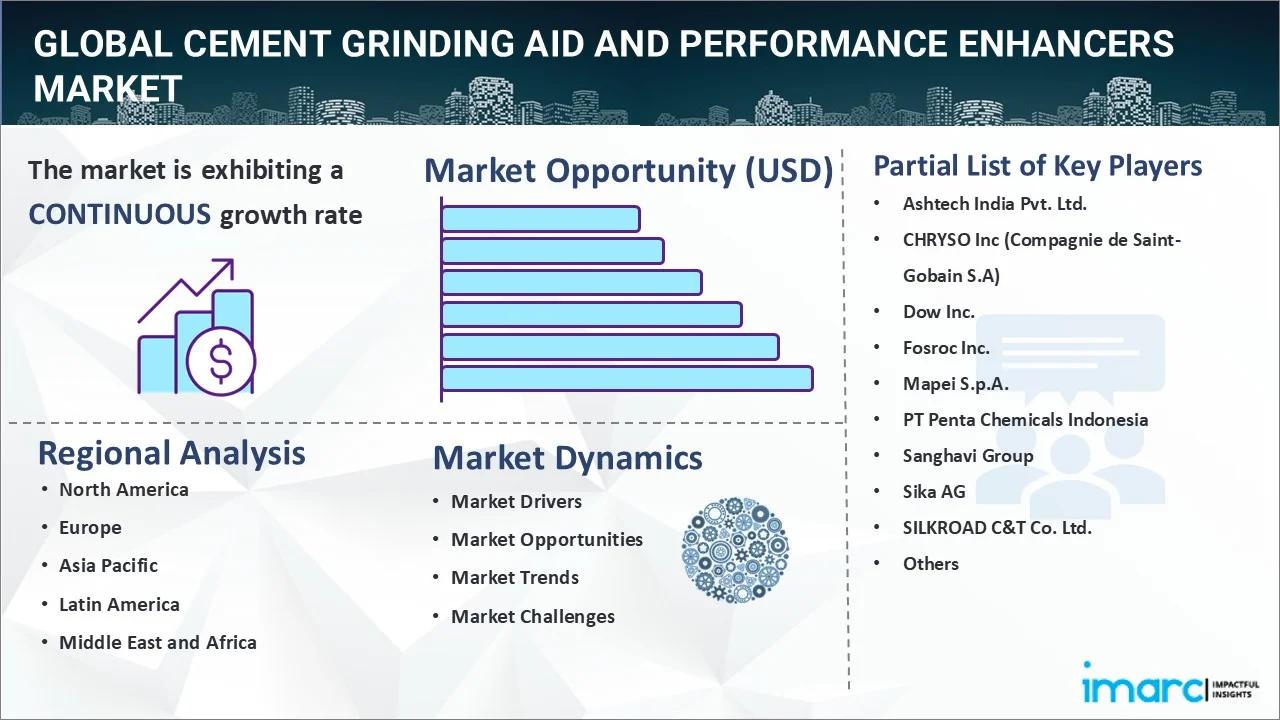
The global cement grinding aid and performance enhancers market size reached USD 3.5 Million in 2025. Looking forward, IMARC Group expects the market to reach USD 4.6 Million by 2034, exhibiting a growth rate (CAGR) of 2.90% during 2026-2034. The market is growing rapidly, driven by the increasing cement production across the globe, heightened concerns regarding the energy efficiency of the grinding process, ongoing enhancements in cement performance, rising emphasis on sustainability and environmental concerns in the cement industry, and the imposition of various governmental regulations and standards.
|
Report Attribute
|
Key Statistics
|
|---|---|
|
Base Year
|
2025 |
|
Forecast Years
|
2026-2034 |
|
Historical Years
|
2020-2025
|
| Market Size in 2025 | USD 3.5 Million |
| Market Forecast in 2034 | USD 4.6 Million |
| Market Growth Rate (2026-2034) | 2.90% |
Cement Grinding Aid and Performance Enhancers Market Analysis:
- Market Growth and Size: The market is witnessing stable growth, driven by the escalating demand for cement fueled by global urbanization and infrastructural projects. Additionally, the increasing need for efficient, sustainable, and quality cement production is boosting the cement grinding aid and performance enhancers market share.
- Major Market Drivers: Key drivers influencing the market growth include the rising construction activities across the globe, the imperative for energy efficiency in cement production, and the growing emphasis on enhancing cement quality and performance. Additionally, the heightened sustainability and environmental concerns that are pushing the adoption of these additives to reduce carbon emissions and energy consumption is favoring the market growth.
- Technological Advancements: Recent innovations in chemical formulations and the development of advanced additives, offering improved grinding efficiency, cement performance, and compatibility with various cement types, are driving the market growth.
- Industry Applications: The market is experiencing high product demand in residential, commercial, and industrial building sectors, for ensuring the durability, strength, and sustainability of the constructed structures.
- Key Market Trends: The key market trends involve the ongoing shift towards sustainability, with a focus on developing eco-friendly additives that contribute to reduced energy consumption and lower carbon dioxide emissions.
- Geographical Trends: North America leads the market due to its booming construction sector and rapid urbanization. Other regions are also showing significant growth, fueled by increasing emphasis on sustainability and the imposition of high-quality construction standards.
- Competitive Landscape: The market is competitive, with key players focusing on innovation, strategic expansions, and collaborations to enhance their cement grinding aids and performance enhancers market share. Additionally, companies are investing in research and development (R&D) to introduce advanced solutions that meet the evolving demands of the construction industry.
- Challenges and Opportunities: The market faces various challenges, such as stringent regulatory standards and the need for high initial investments. However, the development of products that align with the ongoing shift towards sustainable and efficient construction practices is creating new opportunities for the market growth.
To get more information on this market Request Sample
Cement Grinding Aid and Performance Enhancers Market Trends:
Increasing cement production across the globe
The escalating demand for cement across the globe, owing to the surge in construction activities, urbanization, and infrastructural projects, is propelling the market growth. In line with this, grinding aids and performance enhancers play an important role in optimizing the manufacturing process of cement. They aid in enhancing the grinding process, increasing the mill output, and reducing energy consumption. Additionally, the booming construction sector, prompting the demand for efficient and effective cement production, is driving the market growth. Furthermore, the rapid recovery of the construction sector post-economic downturns or global crises, leading to a robust resurgence in cement demand, is fueling the market growth. Moreover, the continuous focus on infrastructural development by governments, coupled with investments in commercial and residential constructions, is acting as another growth-inducing factor.
Heightened concerns regarding the energy efficiency of the grinding process
The intensive energy consumption of the grinding process and the rising focus on reducing operational costs are propelling the market growth. In line with this, cement grinding aids play a vital role in enhancing the grinding process's efficiency, thereby significantly lowering energy consumption and associated costs. Furthermore, these additives facilitate the milling process, reducing the clinker grinding energy by preventing agglomeration of the cement particles, leading to energy savings. Additionally, the rising focus on energy efficiency and environmental sustainability in the cement industry, prompting manufacturers to adopt grinding aids, is bolstering the cement grinding aids and performance enhancers market share. In this context, these additives reduce the carbon footprint of cement production, aligning with global sustainability goals and regulatory mandates for energy conservation and emission reduction.
Ongoing enhancements in cement performance
The enhancement of cement performance is a crucial factor driving the demand for grinding aids and performance enhancers. These additives significantly improve the physical and mechanical properties of cement, including its strength, set time, and workability, which are vital for high-quality construction outcomes. Furthermore, the increasing awareness about the ability of grinding aids to optimize the grinding process, resulting in finer particles and a more homogeneous cement, which contributes to the strength and durability of the finished concrete structures, is favoring the market growth. Additionally, the incorporation of performance enhancers to augment the chemical properties of the cement, facilitating improved hydration, reducing clinker content, and enabling the use of supplementary cementitious materials, is driving the cement grinding aids and performance enhancers market share.
Rising emphasis on sustainability and environmental concerns in the cement industry
The rising sustainability and environmental concerns in the cement industry, primarily due to the sector's substantial carbon footprint and resource intensity, are boosting the market growth. In line with this, cement grinding aids and performance enhancers contribute to the reduction of energy consumption and greenhouse gas emissions (GHGs) associated with cement production. Furthermore, these additives enable more efficient grinding processes, leading to lower energy requirements and, consequently, reduced carbon emissions. Moreover, they facilitate the use of alternative raw materials, such as slag, fly ash, and natural pozzolans, in cement production. It not only reduces the reliance on traditional clinker but also contributes to the circular economy by diverting waste from landfills.
Imposition of various government regulations and standards
The cement industry is subject to a variety of regulations and standards that govern emissions, energy consumption, and the quality of building materials. These regulations are compelling cement manufacturers to adopt additives that can help them meet these requirements. In line with this, grinding aids and performance enhancers improve the efficiency of the cement grinding process, leading to lower energy utilization and reduced greenhouse gas emissions. It is relevant in the context of global efforts to combat climate change, where reducing industrial carbon emissions is a priority. Furthermore, these additives facilitate more efficient grinding and promote the use of alternative cementitious materials, leading to the production of environmentally friendly cement that conforms to regulatory mandates for lower carbon footprints.
Cement Grinding Aid and Performance Enhancers Industry Segmentation:
IMARC Group provides an analysis of the key trends in each segment of the market, along with forecasts at the global, regional, and country levels for 2026-2034. Our report has categorized the market based on type and application.
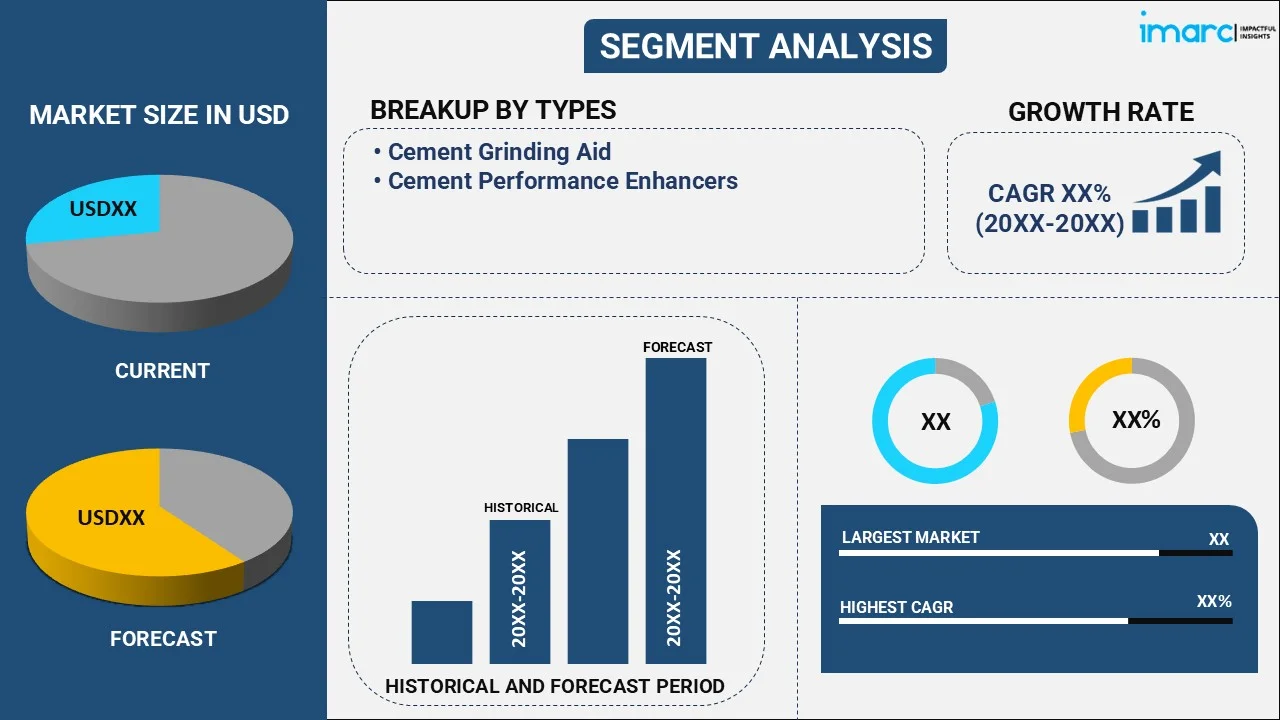
Breakup by Type:
To get detailed segment analysis of this market Request Sample
- Cement Grinding Aid
- Cement Performance Enhancers
Cement grinding aid accounts for the majority of the market share
The report has provided a detailed breakup and analysis of the market based on the type. This includes cement grinding aid and cement performance enhancers. According to the report, cement grinding aid represented the largest segment.
Chemical grinding aids are the largest segment within the market, primarily due to their extensive use in enhancing the efficiency of the cement grinding process. These additives are formulated to improve the milling process and reduce energy consumption by preventing the agglomeration of cement particles, thus facilitating easier grinding. Additionally, the increasing awareness about the effectiveness of chemical grinding aids in increasing the mill throughput, thus reducing the energy costs per ton of cement produced, is boosting the market growth. Moreover, these additives are essential in enabling cement producers to meet the growing demand for cement, maintain cost-effectiveness, and achieve sustainability goals by lowering energy consumption and reducing carbon dioxide emissions.
The cement performance enhancers segment focuses on improving the intrinsic properties of cement, thereby enhancing the quality and durability of the final concrete structures. It improves various cement characteristics, such as strength, setting time, and workability. Furthermore, these additives are designed to facilitate the use of supplementary cementitious materials, reduce clinker content, and modify the microstructure of the cement, enhancing its performance in concrete applications.
Breakup by Application:
- Residential Building
- Commercial Building
- Industrial Building
Commercial building holds the largest share in the industry
A detailed breakup and analysis of the market based on the application have also been provided in the report. This includes residential, commercial, and industrial buildings. According to the report, commercial building accounted for the largest market share.
Commercial buildings hold the largest cement grinding aids and performance enhancers market share, as it includes office buildings, shopping malls, hotels, schools, hospitals, and other commercial infrastructures. These additives are extensively used in commercial construction to produce durable and high-strength concrete that can support large structures and withstand heavy usage and environmental stresses. Furthermore, the imposition of stringent regulations regarding commercial construction projects, necessitating the use of additives to achieve the desired quality, efficiency, and sustainability standards, is boosting the market growth. Besides this, the increasing emphasis on aesthetic and structural integrity in the construction sector, along with the need for rapid construction schedules, is favoring the market growth.
The residential segment encompasses the use of cement grinding aids and performance enhancers in the construction of housing units, apartments, and other residential structures. These additives are used to improve the efficiency of cement grinding and the overall performance of the cement, ensuring the durability and longevity of residential buildings.
The industrial segment includes the application of cement grinding aids and performance enhancers in the construction of factories, warehouses, industrial plants, and other heavy-duty structures. Additionally, the heightened demand for specialized cement properties in the industrial sector to withstand harsh operational environments, such as exposure to chemicals, heavy loads, and extreme temperatures, is contributing to the cement grinding aids and performance enhancers market share.
Breakup by Region:
To get more information on the regional analysis of this market Request Sample
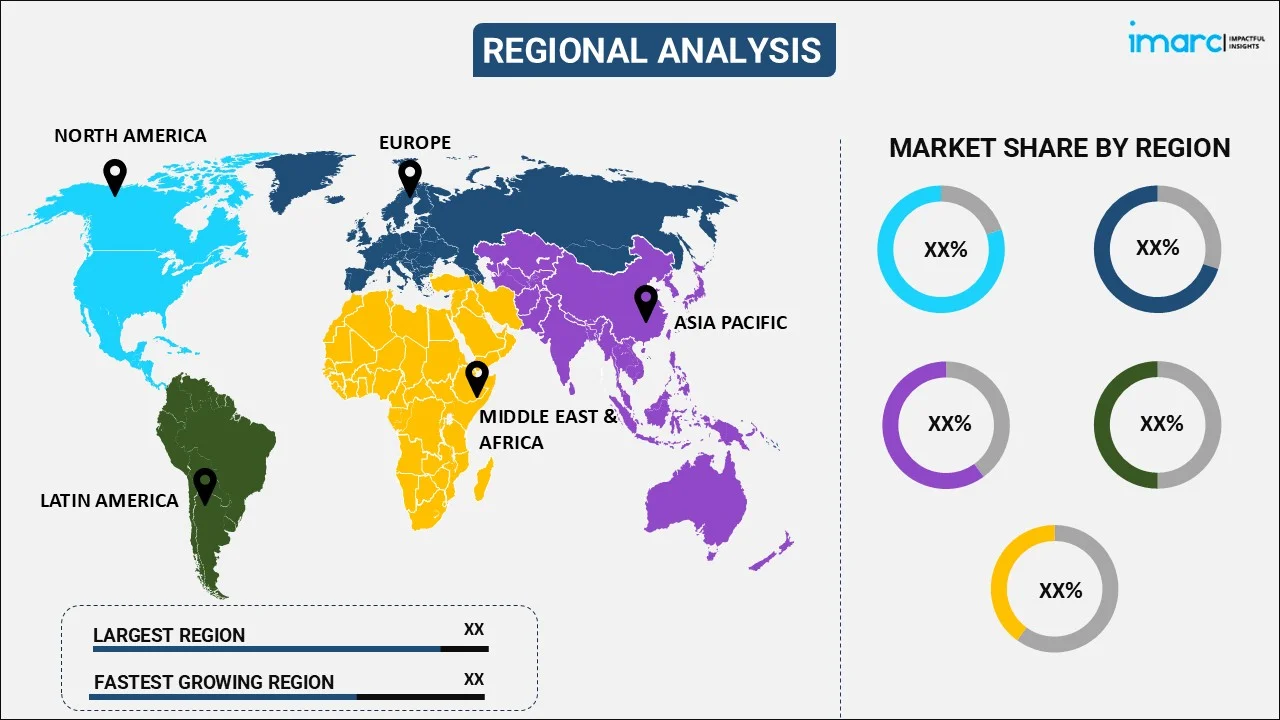
- North America
- United States
- Canada
- Asia-Pacific
- China
- Japan
- India
- South Korea
- Australia
- Indonesia
- Others
- Europe
- Germany
- France
- United Kingdom
- Italy
- Spain
- Russia
- Others
- Latin America
- Brazil
- Mexico
- Others
- Middle East and Africa
North America leads the market, accounting for the largest cement grinding aid and performance enhancers market share
The market research report has also provided a comprehensive analysis of all the major regional markets, which include North America (the United States and Canada); Asia Pacific (China, Japan, India, South Korea, Australia, Indonesia, and others); Europe (Germany, France, the United Kingdom, Italy, Spain, Russia, and others); Latin America (Brazil, Mexico, and others); and the Middle East and Africa. According to the report, North America accounted for the largest market share.
North America represents the largest cement grinding aids and performance enhancers market share, owing to substantial investments in construction and infrastructural development, coupled with stringent regulations regarding emissions and energy efficiency. Additionally, the rising demand for advanced construction materials in the region, including high-performance cement, is boosting the market growth. Besides this, the heightened focus on sustainable construction practices, along with the need for renovation and upgrading of the existing infrastructure, is supporting the market growth. In line with this, cement grinding aids and performance enhancers are crucial in enhancing the efficiency of the cement grinding process, reducing energy consumption, and improving the quality of the cement.
The cement grinding aids and performance enhancers market in the Asia Pacific region is characterized by rapid urbanization, significant infrastructure development, and a booming construction industry. Additionally, the rapid economic development and the increasing urban population in the region are positively impacting the market growth.
Europe's market for cement grinding aids and performance enhancers is driven by the region's focus on sustainability, energy efficiency, and stringent environmental regulations. Additionally, the presence of a well-established construction industry in Europe, characterized by advanced technologies and high standards for building materials, which requires the use of these additives to produce high-quality cement, is bolstering the cement grinding aids and performance enhancers market share.
Latin America's cement grinding aids and performance enhancers market is growing due to increasing urbanization, infrastructural development, and industrialization across countries. Furthermore, the expanding construction industry in the region, with a rising demand for modern, sustainable, and efficient building solutions, is contributing to the market growth. Moreover, the increasing focus on improving infrastructure, coupled with the rising standards for construction materials, is supporting the market growth.
The cement grinding aids and performance enhancers market in the Middle East and Africa region is driven by infrastructure development and rapid urbanization trends. Additionally, the significant growth in the construction sector due to economic diversification efforts and the substantial investments in infrastructure, commercial, and residential projects is bolstering the market growth. Moreover, the presence of harsh climatic conditions in the region, which necessitate the use of high-quality cement, is favoring the market growth.
Leading Key Players in the Cement Grinding Aid and Performance Enhancers Industry:
Top companies are continuously investing in research and development (R&D) to improve and expand their product offerings. They are focusing on developing advanced grinding aids and performance enhancers that provide superior performance, such as increased strength, improved workability, and enhanced durability of the cement. Furthermore, many leading firms are expanding their geographic footprint and diversifying their product portfolios to cater to different market needs and tap into new markets. Additionally, they are collaborating with other companies, research institutions, and construction firms to enhance product development, access new technologies, and co-develop solutions tailored to specific regional needs.
The market research report has provided a comprehensive analysis of the competitive landscape. Detailed profiles of all major companies have also been provided. Some of the key players in the market include:
- Ashtech India Pvt. Ltd.
- CHRYSO Inc (Compagnie de Saint-Gobain S.A)
- Dow Inc.
- Fosroc Inc.
- Mapei S.p.A.
- PT Penta Chemicals Indonesia
- Sanghavi Group
- Sika AG
- SILKROAD C&T Co. Ltd.
- Thermax Limited
(Please note that this is only a partial list of the key players, and the complete list is provided in the report.)
Latest News:
- In September 2020, CHRYSO Inc. introduced a new technology called CHRYSO ICARE, which can improve the grinding process performance and cement reactivity.
- In June 2023, Fosroc Inc. opened a new state-of-the-art construction chemical factory in Bangladesh to meet the growing domestic demand for construction chemical materials and solutions.
- In February 2024, SILKROAD C&T partnered with Lotte Chemical Co., Sika Korea Ltd., and the Korea Concrete Institute for the development of carbon-neutral construction materials.
Cement Grinding Aid and Performance Enhancers Market Report Scope:
| Report Features | Details |
|---|---|
| Base Year of the Analysis | 2025 |
| Historical Period | 2020-2025 |
| Forecast Period | 2026-2034 |
| Units | Million USD |
| Scope of the Report | Exploration of Historical Trends and Market Outlook, Industry Catalysts and Challenges, Segment-Wise Historical and Future Market Assessment:
|
| Types Covered | Cement Grinding Aid, Cement Performance Enhancers |
| Applications Covered | Residential Building, Commercial Building, Industrial Building |
| Regions Covered | Asia Pacific, Europe, North America, Latin America, Middle East and Africa |
| Countries Covered | United States, Canada, Germany, France, United Kingdom, Italy, Spain, Russia, China, Japan, India, South Korea, Australia, Indonesia, Brazil, Mexico |
| Companies Covered | Ashtech India Pvt. Ltd., CHRYSO Inc (Compagnie de Saint-Gobain S.A), Dow Inc., Fosroc Inc., Mapei S.p.A., PT Penta Chemicals Indonesia, Sanghavi Group, Sika AG, SILKROAD C&T Co. Ltd., Thermax Limited, etc. |
| Customization Scope | 10% Free Customization |
| Post-Sale Analyst Support | 10-12 Weeks |
| Delivery Format | PDF and Excel through Email (We can also provide the editable version of the report in PPT/Word format on special request) |
Key Benefits for Stakeholders:
- IMARC’s industry report offers a comprehensive quantitative analysis of various market segments, historical and current market trends, market forecasts, and dynamics of the cement grinding aid and performance enhancers market from 2020-2034.
- The research report provides the latest information on the market drivers, challenges, and opportunities in the global cement grinding aid and performance enhancers market.
- The study maps the leading, as well as the fastest-growing, regional markets. It further enables stakeholders to identify the key country-level markets within each region.
- Porter's five forces analysis assists stakeholders in assessing the impact of new entrants, competitive rivalry, supplier power, buyer power, and the threat of substitution. It helps stakeholders to analyze the level of competition within the cement grinding aid and performance enhancers industry and its attractiveness.
- The competitive landscape allows stakeholders to understand their competitive environment and provides insight into the current positions of key players in the market.
Frequently Asked Questions About the Cement Grinding Aid and Performance Enhancers Market Report
The cement grinding aid and performance enhancers market was valued at USD 3.5 Million in 2025.
IMARC estimates the cement grinding aid and performance enhancers market to exhibit a CAGR of 2.90% during 2026-2034.
The global cement grinding aid and performance enhancers market is driven by increasing demand for energy-efficient and environmentally sustainable construction solutions, along with the growing need for high-performance cement in infrastructure projects.
North America dominates the market due to the region's advanced infrastructure development, high demand for high-quality cement, and significant investments in construction and renovation projects.
Some of the major players in the cement grinding aid and performance enhancers market include Ashtech India Pvt. Ltd., CHRYSO Inc (Compagnie de Saint-Gobain S.A), Dow Inc., Fosroc Inc., Mapei S.p.A., PT Penta Chemicals Indonesia, Sanghavi Group, Sika AG, SILKROAD C&T Co. Ltd., Thermax Limited, etc.
Need more help?
- Speak to our experienced analysts for insights on the current market scenarios.
- Include additional segments and countries to customize the report as per your requirement.
- Gain an unparalleled competitive advantage in your domain by understanding how to utilize the report and positively impacting your operations and revenue.
- For further assistance, please connect with our analysts.
 Request Customization
 Speak to an Analyst
 Request Brochure
 Inquire Before Buying
Benefits of Customization
- Personalize this research
- Triangulate with your data
- Get data as per your format and definition
- Gain a deeper dive into a specific application, geography, customer, or competitor
- Any level of personalization
Get in Touch With Us
UNITED STATES
Phone: +1-201-971-6302
INDIA
Phone: +91-120-433-0800
UNITED KINGDOM
Phone: +44-753-714-6104
Email: [email protected]
Client Testimonials


.webp)


