
Children’s Entertainment Centers Market Size, Share, Trends and Forecast by Visitor Demographics, Facility Size, Revenue Source, Activity Area, and Region, 2026-2034
Global Children's Entertainment Centers Market Size, Share, Trends & Forecast (2026-2034)
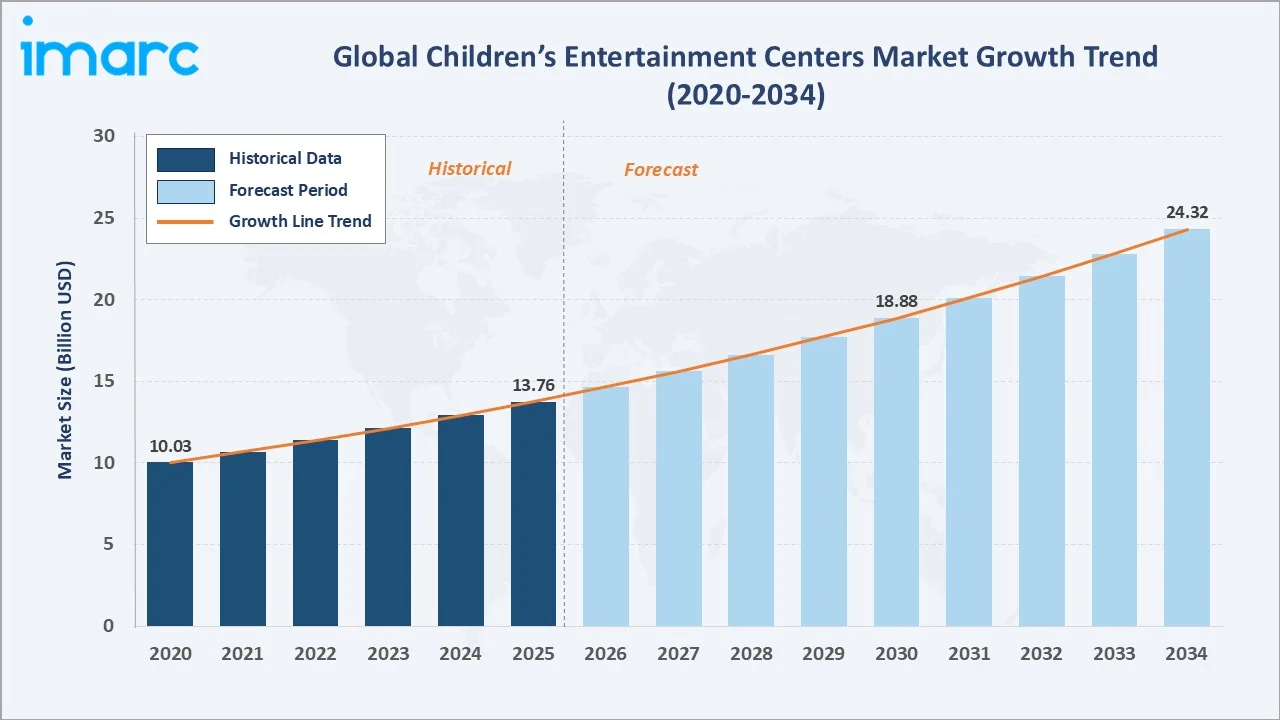
The global children's entertainment centers market size was valued at USD 13.76 Billion in 2025 and is projected to reach USD 24.32 Billion by 2034, exhibiting a CAGR of 6.53% during the forecast period 2026-2034. Rising urban disposable income, the rapid adoption of AR and VR gaming experiences, growing parental spend on weekend family entertainment, and the post-pandemic resurgence of mall footfall are propelling the children's entertainment centers market growth. Arcade Studios lead the activity area segment with a 31.8% share in 2025, while Teenagers (12-18) dominate visitor demographics at 40.2%. Asia-Pacific accounts for 33.7% of global revenue in 2025, the world's largest regional market.
Market Snapshot
|
Metric |
Value |
|
Market Size (2025) |
USD 13.76 Billion |
|
Forecast Market Size (2034) |
USD 24.32 Billion |
|
CAGR (2026-2034) |
6.53% |
|
Base Year |
2025 |
|
Historical Period |
2020-2025 |
|
Forecast Period |
2026-2034 |
|
Largest Region |
Asia-Pacific (33.7% share, 2025) |
|
Fastest Growing Region |
Asia-Pacific (CAGR ~7.5%) |
|
Leading Activity Area |
Arcade Studios (31.8%, 2025) |
|
Leading Visitor Group |
Teenagers 12-18 (40.2%, 2025) |
The global children's entertainment centers market growth trajectory from 2020 through 2034 reflects a strong post-pandemic recovery base, alongside a sustained forecast curve powered by AR/VR gaming expansion, premium birthday-party formats, and rising mall-anchor retail demand across Asia-Pacific.
To get more information on this market, Request Sample
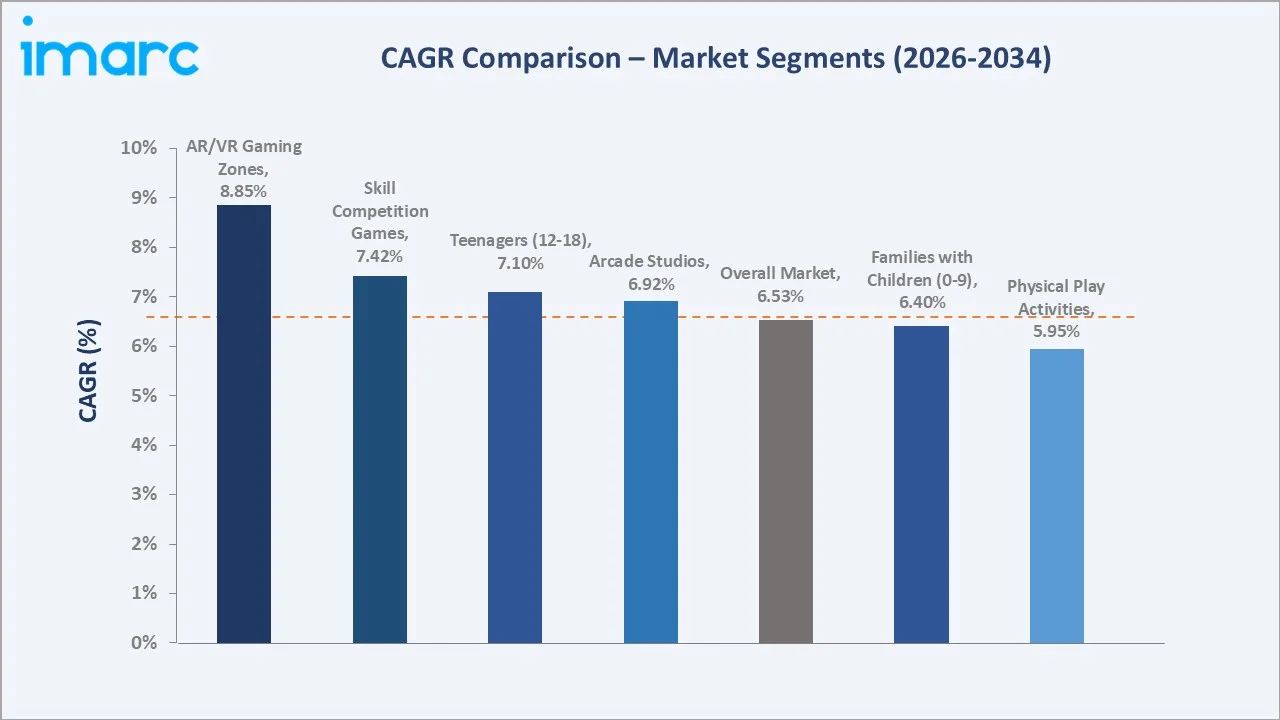
Segment-level CAGR comparisons highlight AR/VR gaming zones and skill/competition games as the fastest-growing activity sub-categories within the global children's entertainment centers industry analysis through 2034.
Executive Summary
The global children's entertainment centers market is undergoing structured expansion driven by the convergence of digital gaming, experiential retail, and family leisure spending. Valued at USD 13.76 Billion in 2025, the market is forecast to reach USD 24.32 Billion by 2034 at a CAGR of 6.53%. According to industry estimates, global mall footfall recovered to 92% of pre-pandemic levels by early 2024, with entertainment-anchor venues outperforming traditional retail tenants on dwell time and average spend per visit.
Arcade Studios command the dominant activity area share at 31.8% in 2025, supported by the long-standing popularity of redemption games, ticket-based reward systems, and the broad demographic appeal across ages 6 to 18. AR and VR Gaming Zones at 24.7% are the faster-growing activity area, fuelled by venue-based VR (VBVR) installations from operators such as Smaaash, Sandbox VR, and Two Bit Circus.
Asia-Pacific dominates with a 33.7% global revenue share in 2025, led by China, India, and Southeast Asian markets where mall-based family entertainment is a primary leisure category. North America holds 26.4%, anchored by chains such as Chuck E. Cheese and Dave & Buster's, while Europe contributes 19.8%, supported by KidZania-style edutainment formats and high per-capita leisure spending.
Key Market Insights
|
Insight |
Data |
|
Largest Activity Area |
Arcade Studios - 31.8% share (2025) |
|
Leading Visitor Group |
Teenagers (12-18) - 40.2% share (2025) |
|
Leading Region |
Asia-Pacific - 33.7% revenue share (2025) |
|
Second Region |
North America - 26.4% revenue share (2025) |
|
Top Companies |
CEC Entertainment Concepts, LP, Dave and Buster’s, Inc., KidZania, Smaaash Entertainment Private Limited, Landmark Group, Lucky Strike Entertainment, FB Holdings, LLC., and Urban Air |
Key Analytical Observations Supporting the Above Data:
- Arcade Studios' 31.8% dominance in 2025 reflects the entrenched popularity of redemption-based gameplay, with prize-ticket arcade formats commanding the broadest cross-generational appeal across global mall and standalone venue formats.
- Teenagers (12-18) lead visitor demographics at 40.2% in 2025, driven by group socialisation patterns, birthday-party occasions, and the sweet-spot price-point fit between pocket-money budgets and ticket redemption value.
- Asia-Pacific's 33.7% global dominance in 2025 reflects China's expanding shopping mall footprint, India's rising urban middle class, and aggressive mall-based entertainment center rollouts by operators such as Smaaash, Funcity, and Timezone across the region.
Global Children's Entertainment Centers Market Overview
Children's entertainment centers (CECs) are dedicated indoor leisure venues offering a combination of arcade games, AR/VR experiences, soft-play structures, climbing walls, trampolines, redemption prize counters, and themed party rooms. Modern CECs serve as the primary destination for family weekend leisure, school holiday programmes, and birthday party hosting, with average visit durations exceeding 90 minutes and average spend per family ranging from USD 15 to USD 20 across major markets.
Applications span standalone destination centers, mall-anchor entertainment tenants, hotel and resort amenities, and increasingly hybrid edutainment formats that blend STEM learning with active play. Birthday parties contribute 28-35% of total revenue at most established CEC venues globally.
Macroeconomic enablers include rising urban household disposable income, the global expansion of shopping mall floorspace, and growing parental willingness to spend on experiential leisure over physical goods, particularly in Asia-Pacific and the Middle East.
Market Dynamics
To evaluate market opportunities, Request Sample
Market Drivers
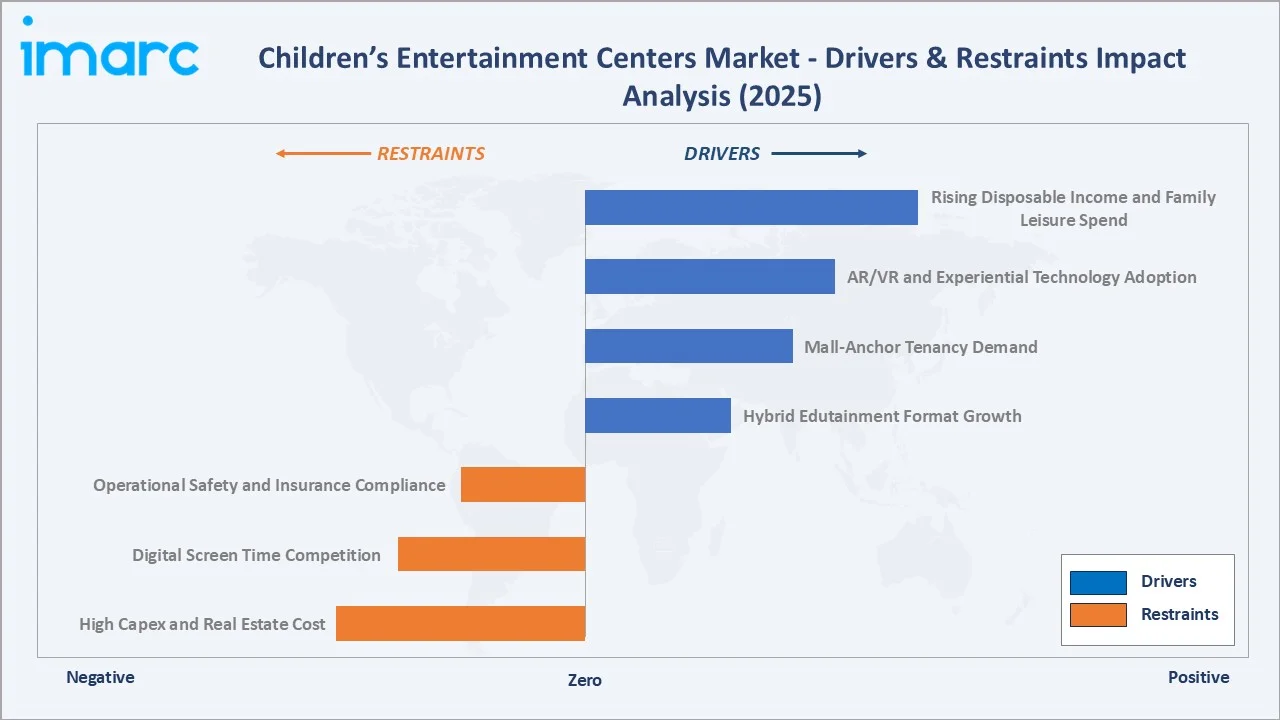
- Rising Disposable Income and Family Leisure Spend: Urban household disposable income across Asia-Pacific has grown steadily through 2024, with experiential leisure capturing a rising share of family budgets. Parental willingness to spend USD 30-100 per visit is the strongest structural driver of CEC revenue growth across all major markets.
- AR/VR and Experiential Technology Adoption: Venue-based VR installations are expanding globally, with operators such as Sandbox VR, Two Bit Circus, and Smaaash deploying multi-player VR arenas as the new headline attraction across CEC venues. For instance, Sandbox VR is rapidly expanding its global footprint, surpassing 80 locations worldwide and announcing continued expansion across the U.S., Europe, and Canada through 2026.
- Mall-Anchor Tenancy Demand: Shopping mall operators globally are increasingly favouring entertainment anchors over traditional retail to drive footfall and dwell time. Entertainment tenants now occupy 8-15% of total mall floorspace in flagship developments across UAE, Singapore, and the United States.
Market Restraints
- High Capex and Real Estate Cost: Building a flagship CEC venue requires substantial capex for fit-out, gaming equipment, and AR/VR systems, while rental costs in tier-1 mall locations remain significantly high.
- Digital Screen Time Competition: Mobile gaming, streaming services, and home VR systems compete for children's leisure time. Industry surveys indicate rising screen time among 8-14 year olds, narrowing the share-of-leisure window for out-of-home entertainment.
Market Opportunities
- Hybrid Edutainment Formats: STEM-themed play, coding labs, robotics workshops, and immersive science exhibits represent the highest-margin growth tier. KidZania, Imagination Playground, and Crayola Experience are leading the format internationally, with parents willing to pay premium pricing for educational positioning.
- Birthday Party and Group Event Monetisation: Birthday-party packages drive CEC revenue at established venues. Premium packages with VR experiences, themed catering, and exclusive zones command USD 350-1,000 per booking, creating significant white-space across emerging markets.
- Tier-2 City Expansion: Mid-size cities across India, China, Brazil, and Southeast Asia represent the most accessible expansion frontier, with rising mall floorspace and untapped middle-class family leisure demand. Major operators such as Smaaash and Funcity are also expanding into tier-2 cities.
Market Challenges
- Operational Safety and Insurance Compliance: CECs face stringent safety requirements for soft play, trampoline parks, and ride installations. Insurance costs have risen 15-25% post-2022 across major markets following several high-profile injury incidents and regulatory tightening.
- Talent and Operational Staffing: Front-line staff turnover in CEC venues exceeds 60% annually in many markets, driving training overhead and service-quality variability. The trend is most acute in North America and Europe where wage inflation has compressed venue operating margins.
Emerging Market Trends
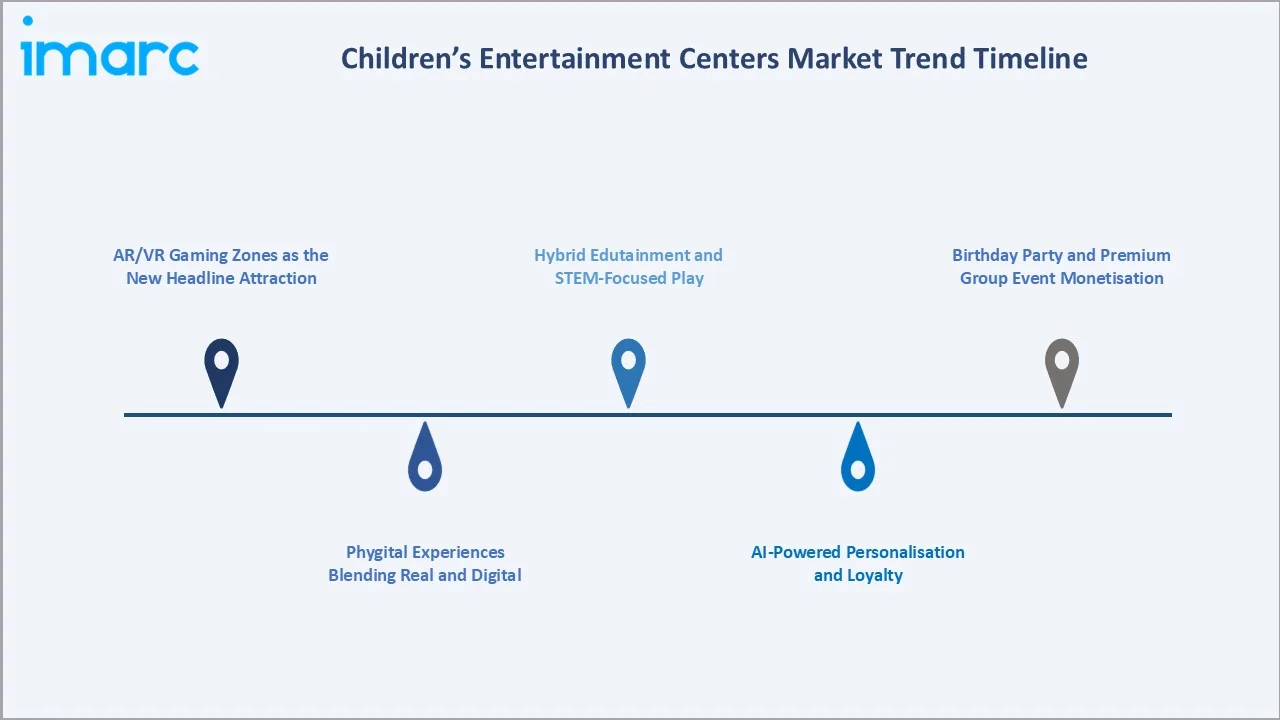
1. AR/VR Gaming Zones as the New Headline Attraction
Venue-based VR has shifted from novelty to mainstream CEC anchor. Operators such as Sandbox VR, Zero Latency, Two Bit Circus, and Smaaash have deployed full-body VR arenas across global venues. Industry estimates suggest VBVR generates the highest revenue per minute of any CEC attraction format.
2. Hybrid Edutainment and STEM-Focused Play
STEM-themed play centers, robotics workshops, and immersive science exhibits are gaining shelf space across global mall and resort venues. KidZania operates over 25 immersive role-play city venues globally, while operators such as Crayola Experience and Imagination Playground are scaling edutainment formats targeting parents seeking enrichment-led leisure.
3. Birthday Party and Premium Group Event Monetisation
Birthday parties have evolved into the highest-margin revenue category for CECs, with premium packages including VR experiences, themed catering, and exclusive zones commanding USD 350-1,000 per booking.
4. Phygital Experiences Blending Real and Digital
Phygital attractions, blending physical play with digital overlays through projection mapping, interactive flooring, and augmented sandbox systems, are emerging as the next-generation CEC format. Brands such as Funovation, Lai Games, and Holovis are deploying phygital systems globally targeting premium mall installations.
5. AI-Powered Personalisation and Loyalty
CECs are deploying AI-powered visitor analytics, personalised recommendations, and dynamic loyalty programmes to drive repeat visitation. Operators including Dave & Buster's, Chuck E. Cheese, and Smaaash are integrating mobile-app loyalty systems with personalised game suggestions.
Industry Value Chain Analysis
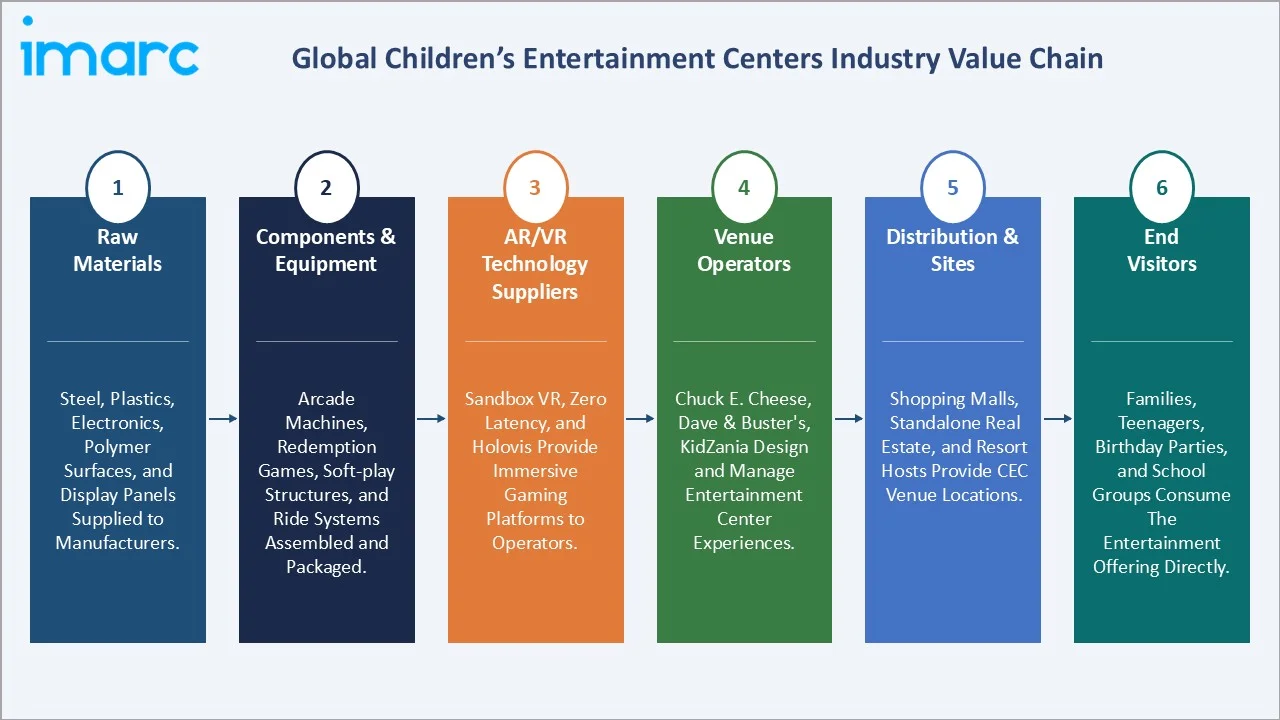
The children's entertainment centers value chain spans five integrated stages from gaming equipment manufacturing through end-visitor experience delivery. Each stage features distinct competitive dynamics, capex profiles, and value capture, with venue operators occupying the highest revenue share position.
|
Stage |
Key Players / Examples |
|
Raw Materials |
Steel, plastics, electronics, polymer surfaces, and display panels supplied to manufacturers. |
|
Components & Equipment |
Arcade machines, redemption games, soft-play structures, and ride systems assembled and packaged. |
|
AR/VR Technology Suppliers |
Sandbox VR, Zero Latency, and Holovis provide immersive gaming platforms to operators. |
|
Venue Operators |
Chuck E. Cheese, Dave & Buster's, KidZania design and manage entertainment center experiences. |
|
Distribution & Sites |
Shopping malls, standalone real estate, and resort hosts provide CEC venue locations. |
|
End Visitors |
Families, teenagers, birthday parties, and school groups consume the entertainment offering directly. |
Venue operators such as Chuck E. Cheese, Dave & Buster's, KidZania, Smaaash, and Funcity command the highest strategic value position by combining real estate selection, gaming equipment integration, F&B operations, and brand-driven family leisure marketing into a unified consumer experience. Below this tier, equipment manufacturers and AR/VR technology suppliers compete to embed their content into the largest venue networks.
Technology Landscape in the Children's Entertainment Centers Industry
AR/VR and Immersive Gaming Technology
AR/VR has shifted from optional add-on to core CEC infrastructure. Sandbox VR's free-roam VR arenas, Two Bit Circus's micro-amusement park concept, and Smaaash's cricket VR simulators represent the category's leading-edge installations. Average per-session pricing of USD 12-20 makes VR the highest revenue-per-minute attraction across the CEC format.
Cashless Payment and Loyalty Systems
RFID wristbands, app-based wallets, and cashless ticket-redemption systems have become standard at premium CEC venues globally. Companies such as Embed, Intercard, and Semnox provide integrated cashless point-of-sale systems that capture visitor analytics and improve operational throughput.
Edutainment Content and STEM Integration
Educational technology partnerships are reshaping CEC content portfolios. Robotics labs, coding workshops, and STEM-themed escape rooms increasingly co-exist with traditional arcade games, supported by content platforms such as KidZania's role-play curricula and Crayola's creativity-led experiences across global mall venues.
Market Segmentation Analysis
The report covers the following segments:
|
Segment Category |
Leading Segment |
Market Share |
Year |
| Visitor Demographics | Teenagers (12-18) | 40.2% |
2025 |
| Facility Size | 1 to 10 Acres | 28.5% |
2025 |
| Revenue Source | Entry Fees and Ticket Sales | 37.4% |
2025 |
| Activity Area | Arcade Studios | 31.8% |
2025 |
| Region | Asia-Pacific | 33.7% |
2025 |

By Activity Area
Arcade Studios command a 31.8% majority share in 2025, anchored by redemption-game economics, broad demographic appeal, and high revenue-per-square-foot performance. Major equipment suppliers such as Sega Amusements, Bandai Namco Amusement, and LAI Games supply the bulk of arcade installations across global venues.
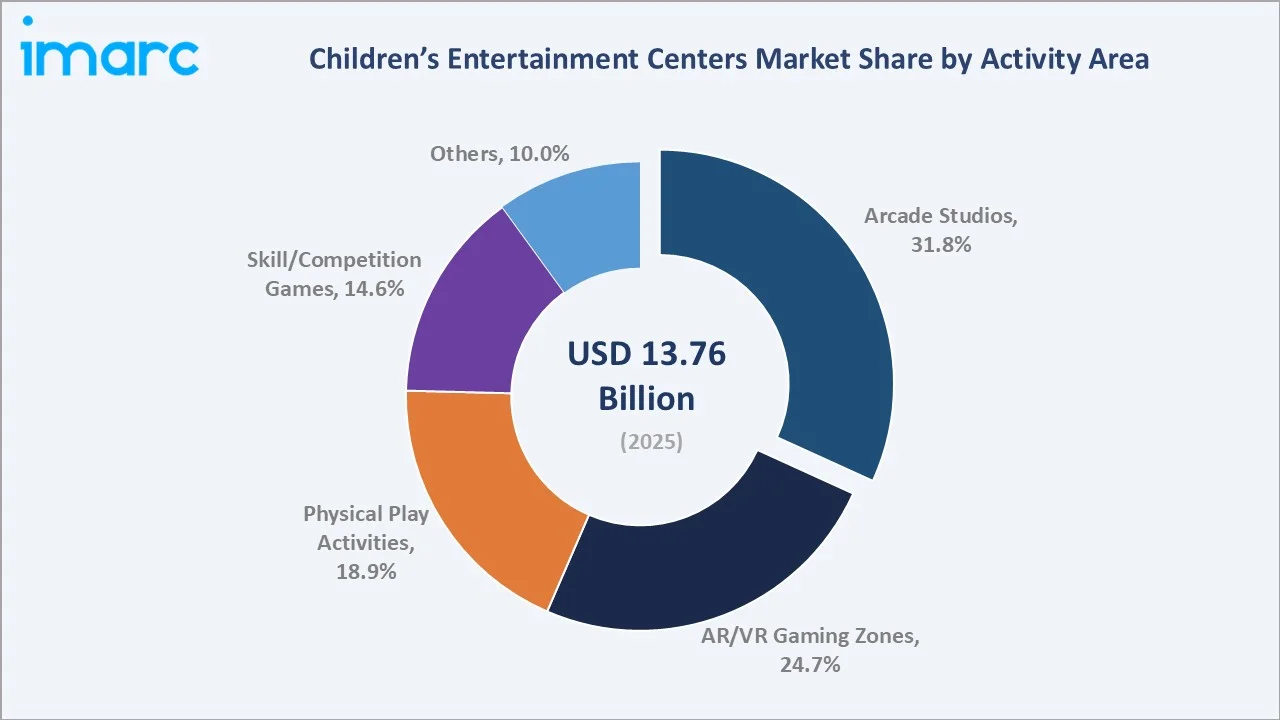
To access detailed market analysis, Request Sample
AR and VR Gaming Zones at 24.7% in 2025 are the faster-growing activity area, fuelled by venue-based VR deployments. Physical Play Activities at 18.9% include trampoline parks, soft-play structures, and climbing walls. Skill/Competition Games at 14.6% cover racing simulators, basketball games, and skee-ball formats. Others (10.0%) include themed retail, F&B-led entertainment, and party-room exclusives.
By Visitor Demographics
Teenagers (12-18) dominate at 40.2% in 2025, supported by group socialisation patterns, birthday party occasions, and the sweet-spot fit between pocket-money budgets and arcade redemption pricing.
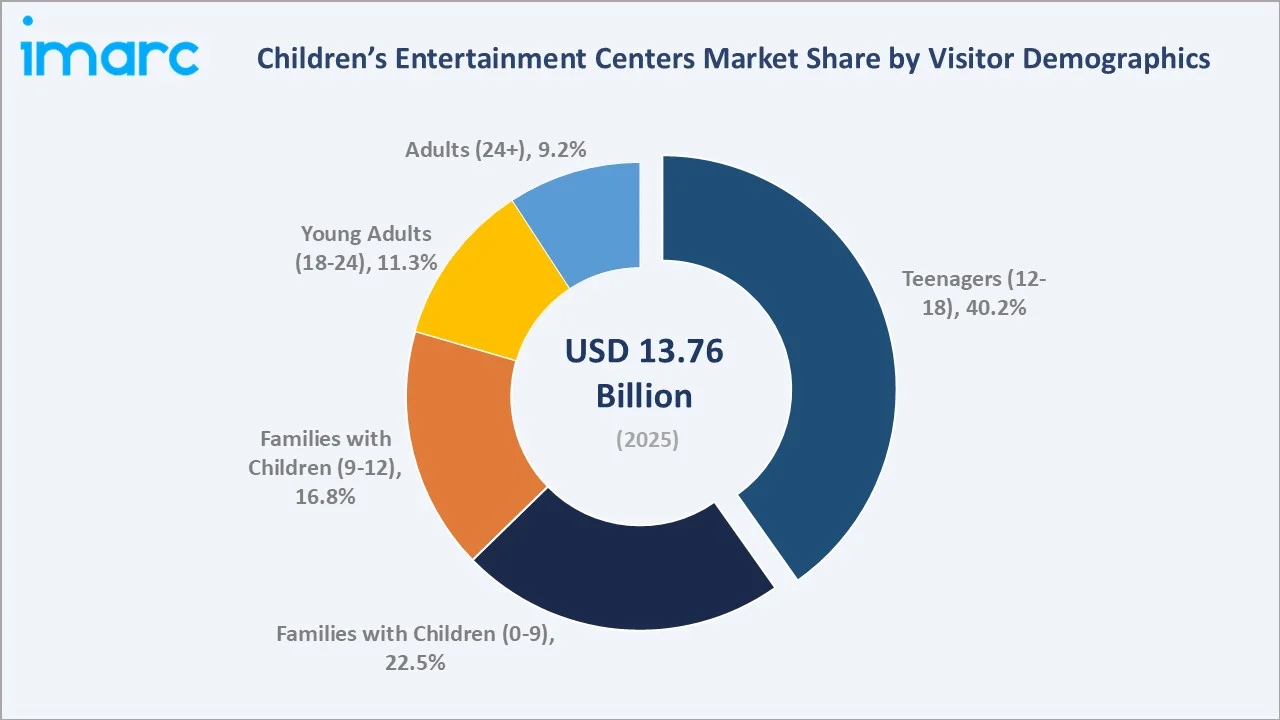
Families with Children (0-9) at 22.5% in 2025 are anchored by soft-play and physical activity zones, while Families with Children (9-12) at 16.8% blend arcade and AR/VR usage. Young Adults (18-24) at 11.3% are increasingly captured by competitive socialising formats such as Dave & Buster's and Lucky Strike. Adults (24+) at 9.2% reflect the rise of corporate team-building and adult-focused VR experiences.
Regional Market Insights
|
Region |
Share (2025) |
Key Growth Drivers |
|
Asia-Pacific |
33.7% |
China mall expansion, India urban middle class, Smaaash and Funcity rollouts |
|
North America |
26.4% |
Chuck E. Cheese / Dave & Buster's networks, Main Event, Urban Air growth |
|
Europe |
19.8% |
KidZania edutainment, Hollywood Bowl Group, premium per-capita leisure spend |
|
Latin America |
11.2% |
Brazil and Mexico growth, KidZania flagship venues, mall infrastructure |
|
Middle East & Africa |
8.9% |
UAE flagship venues (KidZania Dubai), Magic Planet, Adventure HQ growth |
Asia-Pacific commands a 33.7% global revenue share in 2025, the largest regional position. China, India, Japan, and Southeast Asian markets together account for the bulk of regional revenue, supported by an expanding base of active CEC venues across the region. China's expanding shopping mall footprint, India's rising urban middle class, and aggressive mall-based entertainment rollouts by Smaaash, Funcity, and Timezone anchor the region's structural strength.
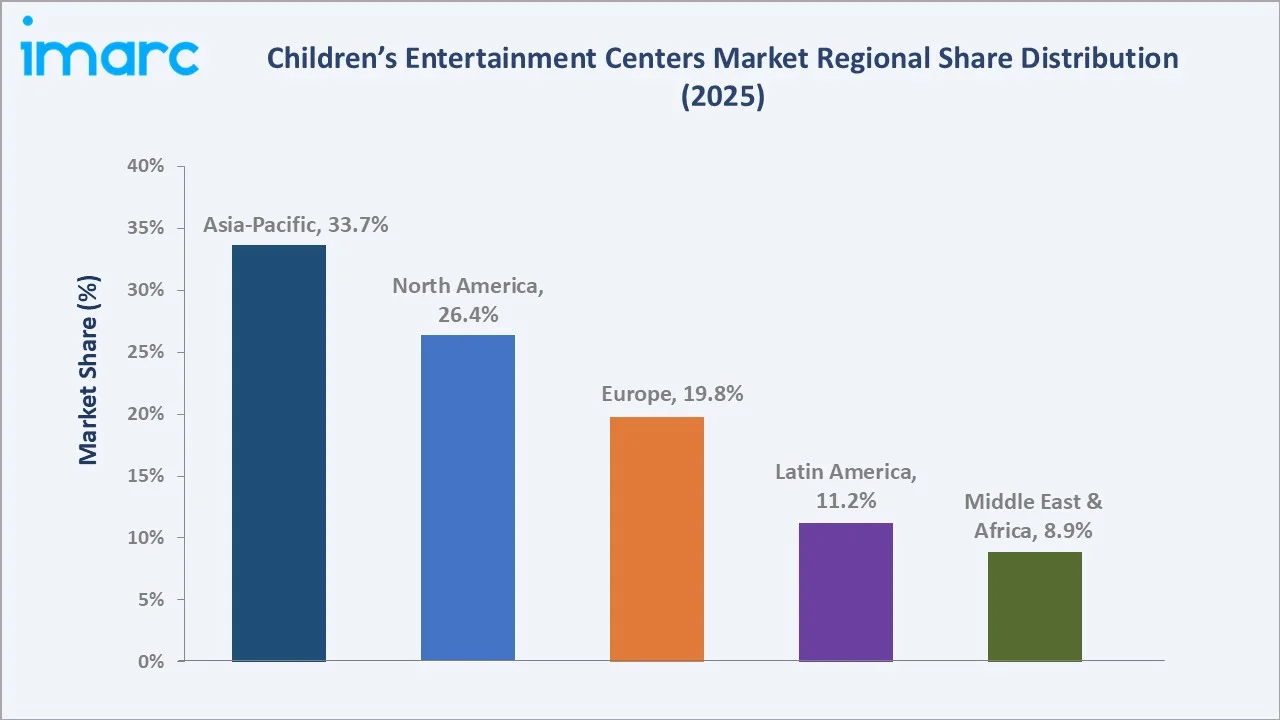
North America holds 26.4% in 2025, anchored by Chuck E. Cheese (over 470 locations), Dave & Buster's (over 220 locations), Main Event, and Urban Air Trampoline Park networks. Europe at 19.8% is led by KidZania, Hollywood Bowl Group, and the Vacanze Felix family entertainment networks across the UK, Germany, France, and Italy. Latin America (11.2%) is led by Brazil and Mexico. Middle East & Africa (8.9%) is anchored by UAE flagship venues including KidZania Dubai, Magic Planet, and Adventure HQ.
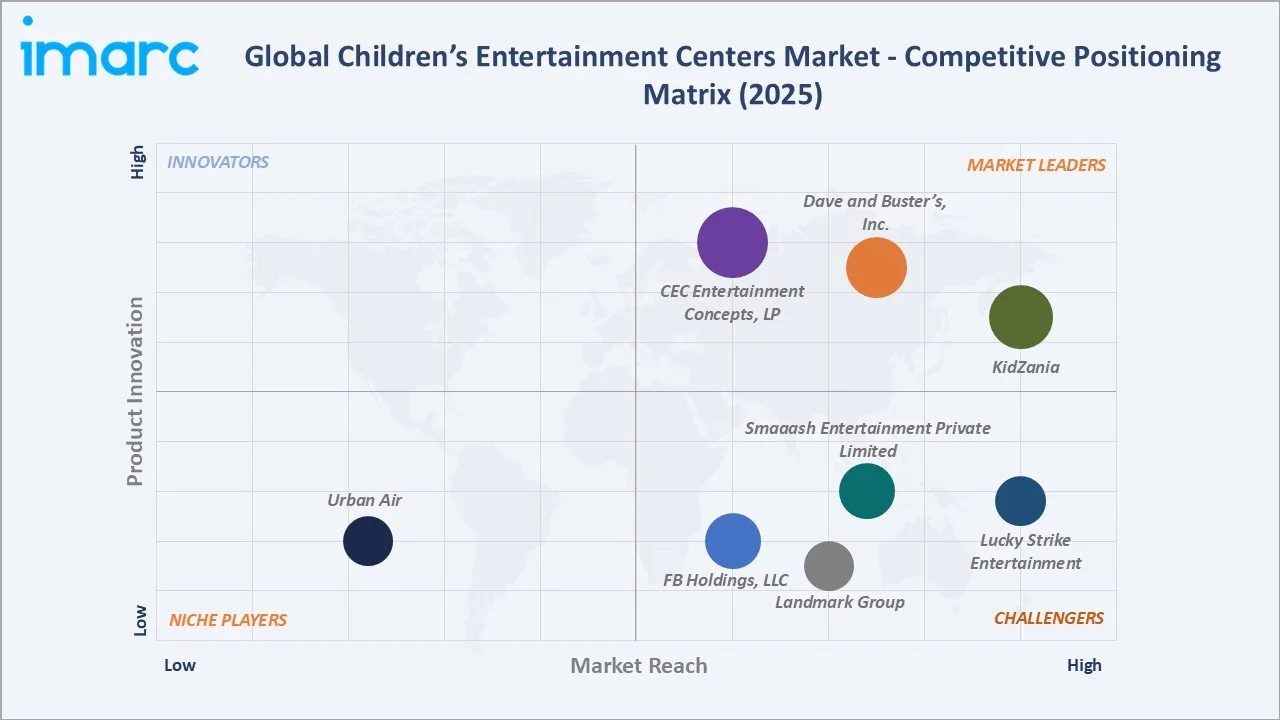
Competitive Landscape
|
Company Name |
Key Brand |
Market Position |
Core Strength |
|
CEC Entertainment Concepts, LP |
Chuck E. Cheese |
Leader |
Largest US chain, 470+ locations, birthday-party leadership |
|
Dave and Buster’s, Inc. |
Dave & Buster's |
Leader |
Competitive socialising, 220+ venues, mobile loyalty |
|
KidZania |
KidZania |
Leader |
Edutainment role-play city, 25+ global venues |
|
Smaaash Entertainment Private Limited |
Smaaash |
Challenger |
Asia/India-led VR cricket and sports entertainment |
|
Landmark Group |
Funcity |
Challenger |
Middle East / South Asia mall-based CEC leader |
|
Lucky Strike Entertainment |
Lucky Strike, Boomers |
Challenger |
Premium bowling and games entertainment |
|
FB Holdings, LLC |
Pump It Up |
Challenger |
Inflatable parties and toddler-led play |
|
Urban Air |
Urban Air Adventure Park |
Emerging |
Trampoline park franchise, 350+ locations |
The global children's entertainment centers competitive landscape is characterised by a mix of international chain operators, regional entertainment specialists, and emerging AR/VR-led concepts. Top operators including Chuck E. Cheese, Dave & Buster's, KidZania, Smaaash, and Funcity collectively account for an estimated 18-25% of global revenue, while the remainder is distributed across thousands of independent and regional venues.
Key Company Profiles
CEC Entertainment Concepts, LP
CEC Entertainment, parent company of Chuck E. Cheese and Peter Piper Pizza, is one of the largest children's entertainment center operators globally with over 470 locations across the United States, Canada, and 18+ international markets. The company generated estimated revenue above USD 900 Million in 2024.
- Brand Portfolio: Chuck E. Cheese, Peter Piper Pizza, Pasqually's Pizza & Wings (virtual brand).
- Recent Developments: In April 2026, Chuck E. Cheese is expanding its “Adventure World” concept with a new indoor playground location planned in West Fargo, North Dakota, announced. The project, valued at approximately USD 1.2 million, reflects continued rollout of active-play focused formats.
- Strategic Focus: CEC Entertainment prioritises venue modernisation, birthday-party revenue expansion, international franchising in Asia-Pacific and the Middle East, and integration of digital loyalty and mobile-app booking platforms across its global network.
Dave and Buster’s, Inc.
Dave & Buster's is a leading North American competitive socialising and family entertainment operator with over 220 venues across the United States and Canada, and growing international presence. The company reported revenue of approximately USD 2.1 Billion in fiscal 2024.
- Brand Portfolio: Dave & Buster's flagship venues, Main Event Entertainment (acquired 2022), digital and AR-enabled gaming attractions across all venues.
- Recent Developments: In April 2026, Dave & Buster's is executing a "Back to Basics" turnaround strategy. The company will launch 10 new games and attractions in fiscal 2026, partnering with high-profile IPs including John Wick and Stranger Things.
- Strategic Focus: Dave & Buster's targets premium competitive socialising experiences for adults and families, integration of digital loyalty across the combined network, and selective international franchise expansion across the Middle East and Asia-Pacific markets.
KidZania
KidZania is a Mexico-headquartered global edutainment operator running role-play city venues where children experience real-world professions in scaled urban environments. The company operates over 25 venues globally with brand partners including Coca-Cola, Honda, and Walmart sponsoring occupational stations within each venue.
- Brand Portfolio: KidZania role-play city flagship venues, KidZania at Home digital programmes, in-venue branded occupational experiences with corporate partners.
- Recent Developments: In April 2026, Kaspersky expanded its first-of-its-kind Cyber Investigation Centre role-play to KidZania Delhi NCR. The role-play places children aged 6+ in real-world cybersecurity missions investigating phishing, identity theft, and cyberbullying using Kaspersky's tools.
- Strategic Focus: KidZania emphasises edutainment leadership, brand-partner sponsorship monetisation, global franchise expansion through master franchisees, and continuous content refresh aligned to STEM, sustainability, and 21st-century workforce themes.
Market Concentration Analysis
The global children's entertainment centers market exhibits low-to-moderate concentration. The top five operators (Chuck E. Cheese, Dave & Buster's, KidZania, Smaaash, and Urban Air) collectively account for an estimated 18-25% of global revenue in 2025, with the remainder fragmented across thousands of regional and independent operators.
The market structure is bifurcated. At the international chain tier, consolidation is intensifying as scale economics, branded loyalty programmes, and capex-heavy AR/VR investments favour the largest operators. Cedar Fair's acquisition of Six Flags (2024) and Dave & Buster's acquisition of Main Event (2022) illustrate this consolidation trajectory.
Simultaneously, the regional and independent tier remains highly fragmented across emerging markets. Asia-Pacific alone hosts a large and diverse base of CEC venues across thousands of operators ranging from single-mall installations to regional chains such as Funcity, Timezone, and Landmark Group's Fun City brand across the Middle East and South Asia.
Investment & Growth Opportunities
Fastest-Growing Segments
AR and VR gaming zones are the highest-growth activity area, supported by venue-based VR deployments and the rising willingness of consumers to pay premium pricing for immersive group experiences. Skill/Competition games are the second-highest growth segment.
Emerging Market Expansion
Tier-2 cities across India, China, Brazil, Indonesia, and Vietnam represent the most accessible expansion frontier, with rising mall floorspace, untapped middle-class family leisure demand, and aggressive expansion pipelines from operators such as Smaaash, Funcity, and Timezone targeting 100+ new venue openings collectively through 2028.
Venture & Private Investment Trends
Private equity has accelerated activity in the CEC sector. Cedar Fair-Six Flags, Sun Capital's investments in CEC operators, and Apollo Global Management's involvement in entertainment venue platforms reflect strategic interest. Venture capital is also flowing into AR/VR concept operators including Sandbox VR, Zero Latency, and Two Bit Circus across multiple funding rounds through 2025.
Future Market Outlook (2026-2034)
The global children's entertainment centers market forecast projects steady value expansion from USD 13.76 Billion in 2025 to USD 24.32 Billion by 2034 at a CAGR of 6.53%. The growth trajectory is underpinned by AR/VR adoption, premium birthday-party formats, mall-anchor tenant demand, and tier-2 city expansion, even as the category navigates digital screen time competition.
Three structural shifts are likely to reshape the market through 2034. First, AR/VR and phygital experiences will become the dominant differentiator for new venue formats. Second, hybrid edutainment with STEM positioning will capture a rising share of family leisure spend. Third, consolidation at the global chain tier will continue alongside fragmented regional growth.
By 2034, the children's entertainment centers industry is forecast to operate as a hybrid physical-digital leisure category, with AR/VR-led venues, AI-powered personalisation, and edutainment-positioned formats commanding premium pricing. The category's resilience reflects deep structural family-leisure demand and the limits of fully-digital alternatives.
Research Methodology
Primary Research
Primary research included over 50 structured interviews conducted in 2024-2025 with industry stakeholders, including venue operators, CEC equipment suppliers (Sega, Bandai Namco, LAI Games), AR/VR technology providers, mall real-estate owners, and trade body representatives at IAAPA (International Association of Amusement Parks and Attractions). Primary insights validated market sizing, segmentation estimates, and competitive positioning.
Secondary Research
Secondary sources include IAAPA industry reports, BCG Family Leisure Spending studies, Statista amusement and recreation indices, USDA and EU consumer expenditure data, ICSC mall footfall reports, Cushman & Wakefield retail real estate analyses, and company annual reports of leading CEC operators including Dave & Buster's, KidZania, and Smaaash.
Forecasting Models
Market size estimations and growth projections were derived using a combined top-down and bottom-up modelling approach. Top-down inputs included global GDP forecasts, household disposable income trends, and shopping mall floorspace expansion. Bottom-up inputs included operator-level revenue tracking, venue-level visitor and ticket-spend estimates, and AR/VR session pricing. Scenario analysis was performed across base, optimistic, and conservative cases.
Children’s Entertainment Centers Market Report Scope:
| Report Features | Details |
|---|---|
| Base Year of the Analysis | 2025 |
| Historical Period | 2020-2025 |
| Forecast Period | 2026-2034 |
| Units | Billion USD |
| Scope of the Report |
Exploration of Historical Trends and Market Outlook, Industry Catalysts and Challenges, Segment-Wise Historical and Future Market Assessment:
|
| Visitors Demographics Covered | Families with Children (0-9), Families with Children (9-12), Teenagers (12-18), Young Adults (18-24), Adults (Ages 24+) |
| Facility Sizes Covered | Up to 5,000 Sq. Ft., 5,001 to 10,000 Sq. Ft., 10,001 to 20,000 Sq. Ft., 20,001 to 40,000 Sq. Ft., 1 to 10 Acres, 11 to 30 Acres, Over 30 Acres |
| Revenue Sources Covered | Entry Fees and Ticket Sales, Food and Beverages, Merchandising, Advertisement, Others |
| Activity Areas Covered | Arcade Studios, AR and VR Gaming Zones, Physical Play Activities, Skill/Competition Games, Others |
| Regions Covered | North America, Asia Pacific, Europe, Latin America, Middle East and Africa |
| Countries Covered | United States, Canada, Germany, France, United Kingdom, Italy, Spain, Russia, China, Japan, India, South Korea, Australia, Indonesia, Brazil, Mexico |
| Companies Covered | CEC Entertainment Concepts, LP, Dave and Buster’s, Inc., KidZania, Smaaash Entertainment Private Limited, Landmark Group, Lucky Strike Entertainment, FB Holdings, LLC., Urban Air, etc. |
| Customization Scope | 10% Free Customization |
| Post-Sale Analyst Support | 10-12 Weeks |
| Delivery Format | PDF and Excel through Email (We can also provide the editable version of the report in PPT/Word format on special request) |
Key Benefits for Stakeholders:
- IMARC’s report offers a comprehensive quantitative analysis of various market segments, historical and current market trends, entertainment centers market outlook, and dynamics of the children’s entertainment centers market from 2020-2034.
- The children’s entertainment centers market research report provides the latest information on the market drivers, challenges, and opportunities in the global market.
- The study maps the leading, as well as the fastest-growing, regional markets. It further enables stakeholders to identify the key country-level markets within each region.
- Porter's five forces analysis assist stakeholders in assessing the impact of new entrants, competitive rivalry, supplier power, buyer power, and the threat of substitution. It helps stakeholders to analyze the level of competition within the children’s entertainment centers industry and its attractiveness.
- Competitive landscape allows stakeholders to understand their competitive environment and provides an insight into the current positions of key players in the market.
Frequently Asked Questions About the Children’s Entertainment Centers Market Report
The global children's entertainment centers market was valued at USD 13.76 Billion in 2025, supported by mall footfall recovery, AR/VR adoption, and rising family leisure spending across all regions.
The market is projected to reach USD 24.32 Billion by 2034, growing at a CAGR of 6.53% during 2026-2034, driven by AR/VR gaming, premium birthday-party formats, and tier-2 city expansion.
Arcade Studios lead with a 31.8% share in 2025, supported by redemption-game economics, broad demographic appeal, and high revenue-per-square-foot performance across global venues.
Teenagers (12-18) dominate at 40.2% in 2025, driven by group socialisation, birthday-party occasions, and the price-point fit between pocket-money budgets and arcade redemption pricing.
Asia-Pacific leads with a 33.7% share in 2025, driven by China's mall expansion, India's urban middle-class growth, and aggressive rollouts from Smaaash, Funcity, and Timezone across the region.
Key drivers include rising household disposable income, AR/VR gaming adoption, mall-anchor tenancy demand, and growing parental willingness to spend on experiential leisure for children.
AR/VR Gaming Zones are the fastest-growing activity area at approximately 8.85% CAGR through 2034, fuelled by venue-based VR deployments from operators such as Sandbox VR, Smaaash, and Two Bit Circus.
Leading companies include CEC Entertainment Concepts, LP, Dave and Buster’s, Inc., KidZania, Smaaash Entertainment Private Limited, Landmark Group, Lucky Strike Entertainment, FB Holdings, LLC., and Urban Air.
AR/VR has shifted from optional add-on to flagship attraction, generating USD 25-45 per session per player and ranking as the highest revenue-per-minute format across CEC venues globally.
Birthday parties contribute 28-35% of total revenue at established CECs, with premium VR-themed packages commanding USD 350-1,200 per booking and creating a high-margin growth tier.
Need more help?
- Speak to our experienced analysts for insights on the current market scenarios.
- Include additional segments and countries to customize the report as per your requirement.
- Gain an unparalleled competitive advantage in your domain by understanding how to utilize the report and positively impacting your operations and revenue.
- For further assistance, please connect with our analysts.
 Request Customization
 Speak to an Analyst
 Request Brochure
 Inquire Before Buying
Benefits of Customization
- Personalize this research
- Triangulate with your data
- Get data as per your format and definition
- Gain a deeper dive into a specific application, geography, customer, or competitor
- Any level of personalization
Get in Touch With Us
UNITED STATES
Phone: +1-201-971-6302
INDIA
Phone: +91-120-433-0800
UNITED KINGDOM
Phone: +44-753-714-6104
Email: [email protected]
Client Testimonials


.webp)


