
Japan Renewable Energy Market Size, Share, Trends and Forecast by Type and Region, 2026-2034
Japan Renewable Energy Market Size, Share, Trends & Forecast (2026-2034)
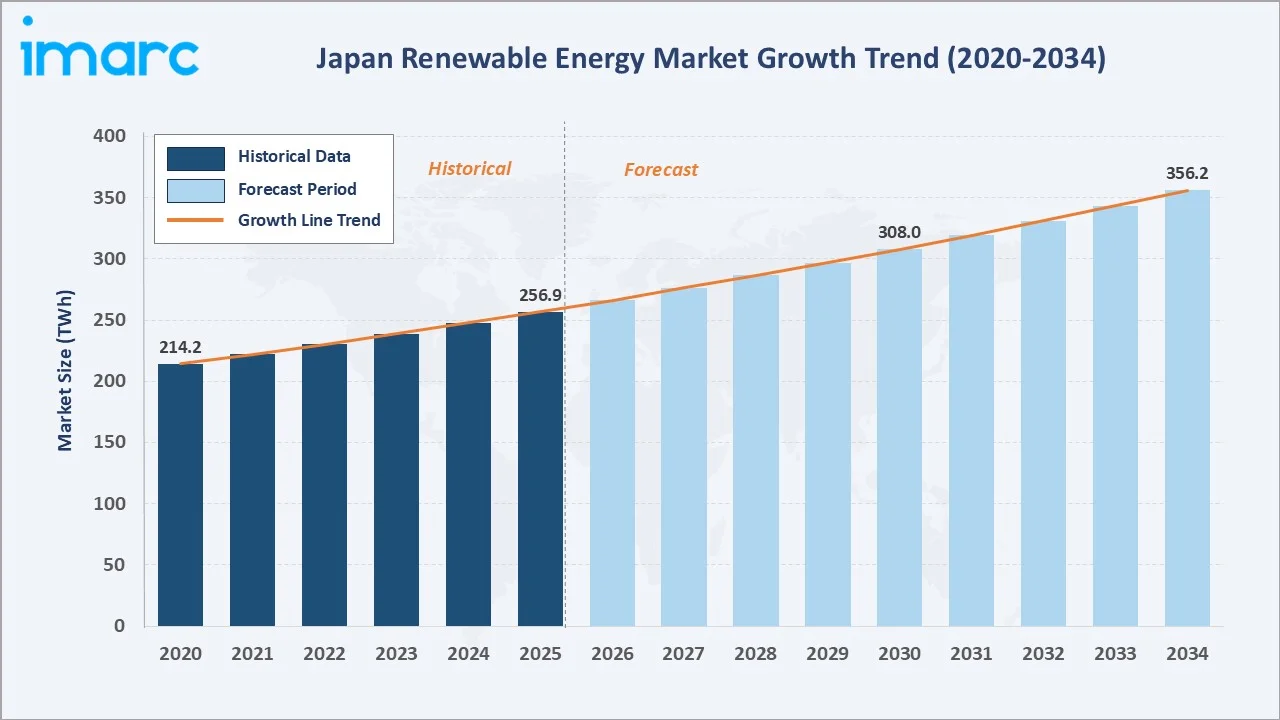
The Japan renewable energy market reached 256.9 TWh in 2025 and is projected to reach 356.2 TWh by 2034, growing at a CAGR of 3.70% during 2026-2034. Growth is driven by decarbonization policy, FIT/FIP incentive schemes, falling solar and wind costs, and post-Fukushima energy security diversification. Solar leads the type segment at 46.8%, while the Kanto Region commands the largest regional share at 34.7%.
Market Snapshot
|
Metric |
Value |
|
Market Size (2025) |
256.9 TWh |
|
Forecast Market Size (2034) |
356.2 TWh |
|
CAGR (2026-2034) |
3.70% |
|
Base Year |
2025 |
|
Historical Period |
2020-2025 |
|
Forecast Period |
2026-2034 |
|
Dominant Type |
Solar (46.8%, 2025) |
|
Leading Region |
Kanto Region (34.7%, 2025) |
The market expanded from an estimated 214.2 TWh in 2020 to 256.9 TWh in 2025, anchored at approximately 308.0 TWh in 2030 and forecast to reach 356.2 TWh by 2034. Grid congestion and land scarcity have moderated growth, but offshore wind auctions and corporate renewable PPA demand continue to underpin expansion.
To get more information on this market, Request Sample
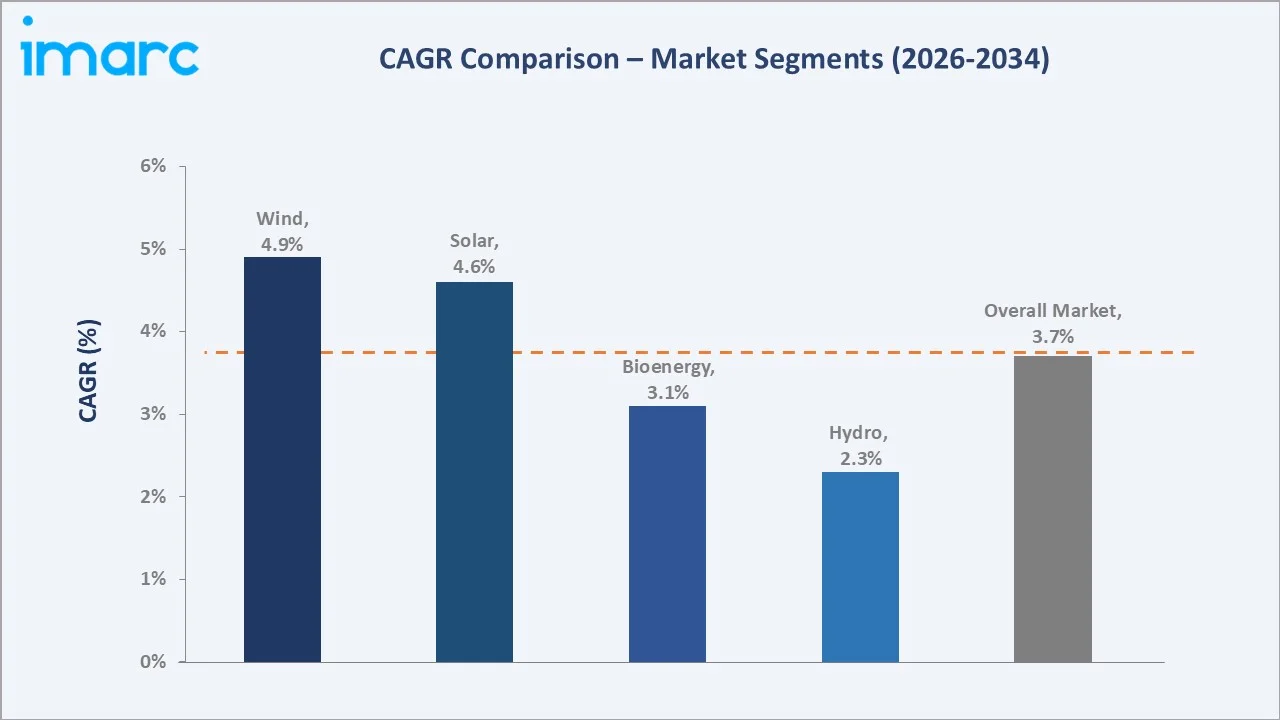
Solar generation grows steadily as rooftop and non-FIT utility-scale capacity expands, while wind, led by offshore auctions in Tohoku and Kyushu, registers the fastest CAGR among all types through 2034 as fixed-bottom and floating projects reach commercial operation.
Executive Summary
The Japan renewable energy market reached 256.9 TWh in 2025, reflecting the country's structural shift toward decarbonized power generation following the Sixth Strategic Energy Plan and net-zero-by-2050 commitment. The market is projected to reach 356.2 TWh by 2034, a 3.70% CAGR, as solar, wind, and storage-integrated projects scale nationwide.
Solar leads at 46.8% share, supported by distributed rooftop, non-FIT utility-scale, and agrivoltaic deployment. Hydro remains the second-largest contributor at 21.4% through legacy large-scale assets, while wind at 18.7% is expanding fastest as offshore auction capacity reaches commercial operation. The Kanto Region leads regionally at 34.7% through concentrated C&I and data-center power demand.
Key Market Insights
|
Insight |
Data |
|
Dominant Type |
Solar - 46.8% share (2025) |
|
Leading Region |
Kanto Region - 34.7% market share (2025) |
|
Market Opportunity |
Offshore wind auctions; floating solar and agrivoltaics; battery storage and VPP integration |
- Solar at 46.8%: Solar dominates as the most mature, cost-competitive, and land-flexible renewable technology in Japan, supported by rooftop, non-FIT utility-scale, and agrivoltaic project pipelines nationwide.
- Hydro at 21.4%: Hydro's legacy large-scale reservoir and run-of-river assets continue to anchor baseload renewable generation, particularly across the Chubu and Tohoku regions.
- Kanto Region at 34.7%: Kanto's dense concentration of corporate and industrial power demand, including data-center PPAs, drives the region's leading 34.7% share of the national renewable energy market.
Japan Renewable Energy Market Overview
The Japan renewable energy market encompasses the generation of electricity from solar, wind, hydro, bioenergy, and other renewable sources, spanning utility-scale independent power producers, corporate self-consumption assets, and residential rooftop systems across all eight regions of Japan.
The ecosystem integrates equipment and component manufacturers, project developers, EPC and O&M providers, grid operators, regulatory bodies including METI, financiers, and corporate and residential offtakers. Macroeconomic factors include FIT/FIP policy design, decarbonization targets, and rising electricity demand from AI-driven data centers.
Market Dynamics
To evaluate market opportunities, Request Sample
Market Drivers
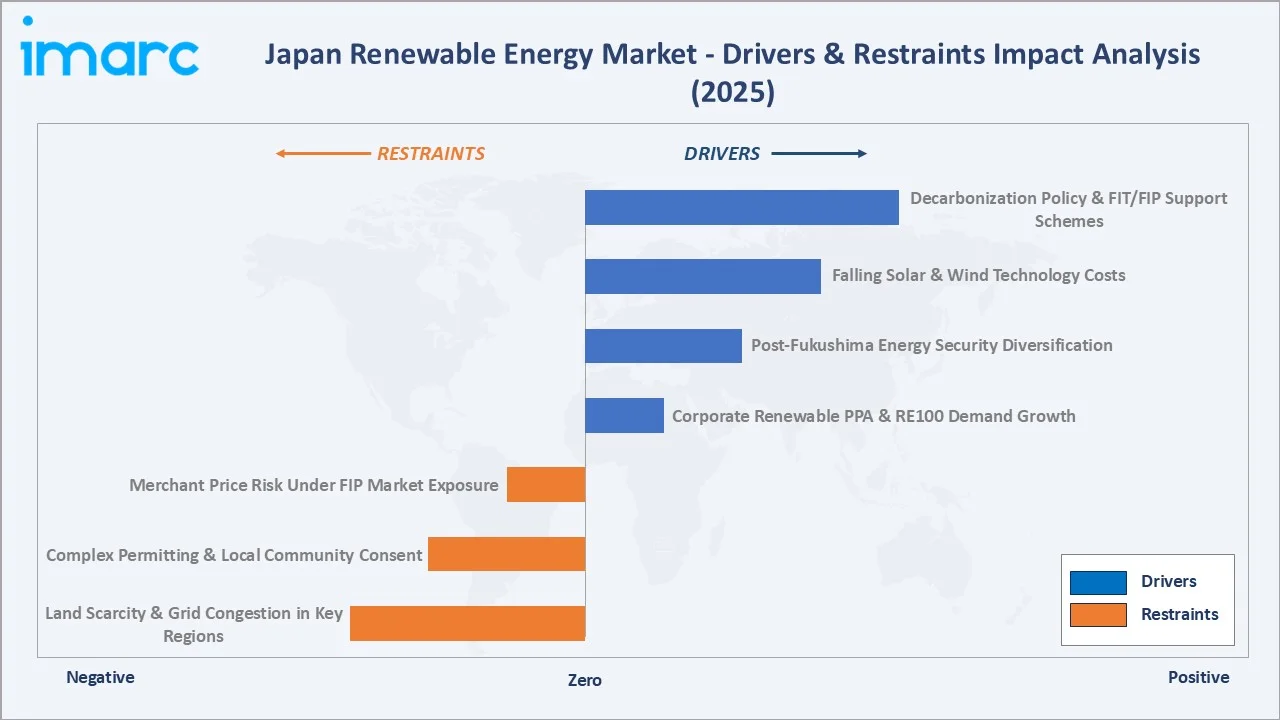
- Decarbonization Policy & FIT/FIP Support Schemes: Japan's Sixth Strategic Energy Plan and FIT/FIP support schemes are accelerating renewable capacity additions by guaranteeing revenue certainty for developers, encouraging solar, wind, and storage project financing across utility-scale and distributed segments.
- Falling Solar & Wind Technology Costs: Continued cost declines in solar modules and wind turbines are improving renewable project economics, enabling non-FIT merchant projects to compete directly with conventional generation on levelized cost.
- Post-Fukushima Energy Security Diversification: Japan's continued diversification away from nuclear and imported fossil fuels since the Fukushima accident is reinforcing long-term policy support for domestic renewable energy capacity expansion.
- Corporate Renewable PPA & RE100 Demand Growth: Rising corporate RE100 commitments and data-center power demand are driving long-term renewable PPAs, directly boosting utility-scale solar and wind project development nationwide.
Market Restraints
- Land Scarcity & Grid Congestion in Key Regions: Mountainous terrain and dense urban development are restricting available land for utility-scale solar and onshore wind, pushing developers toward marginal sites and floating solar alternatives.
- Complex Permitting & Local Community Consent: Lengthy permitting timelines and local community consent requirements, particularly for offshore wind and large solar farms, are delaying project commissioning and increasing development costs.
- Merchant Price Risk Under FIP Market Exposure: The shift to Feed-in Premium exposes developers to wholesale price volatility, complicating project financing relative to the prior fixed feed-in tariff regime.
Market Opportunities
- Offshore Wind Auction Pipeline Expansion: Sequential offshore wind auction rounds across Tohoku and Kyushu are opening large-scale fixed-bottom and, increasingly, floating wind development opportunities for domestic and international developers.
- Battery Storage & VPP Integration: Battery energy storage and virtual power plant integration are creating new revenue streams for renewable developers by managing curtailment and balancing intermittent solar and wind output.
Market Challenges
- Grid Curtailment During Peak Solar Output: Solar curtailment during high-output midday periods in regions such as Kyushu is reducing effective capacity utilization and pressuring project economics.
- Import Competition on Equipment Supply: Rising competition from international turbine suppliers and Chinese module manufacturers is intensifying pricing pressure on domestic equipment and EPC providers.
Emerging Market Trends
1. Offshore Wind Auction Scale-Up
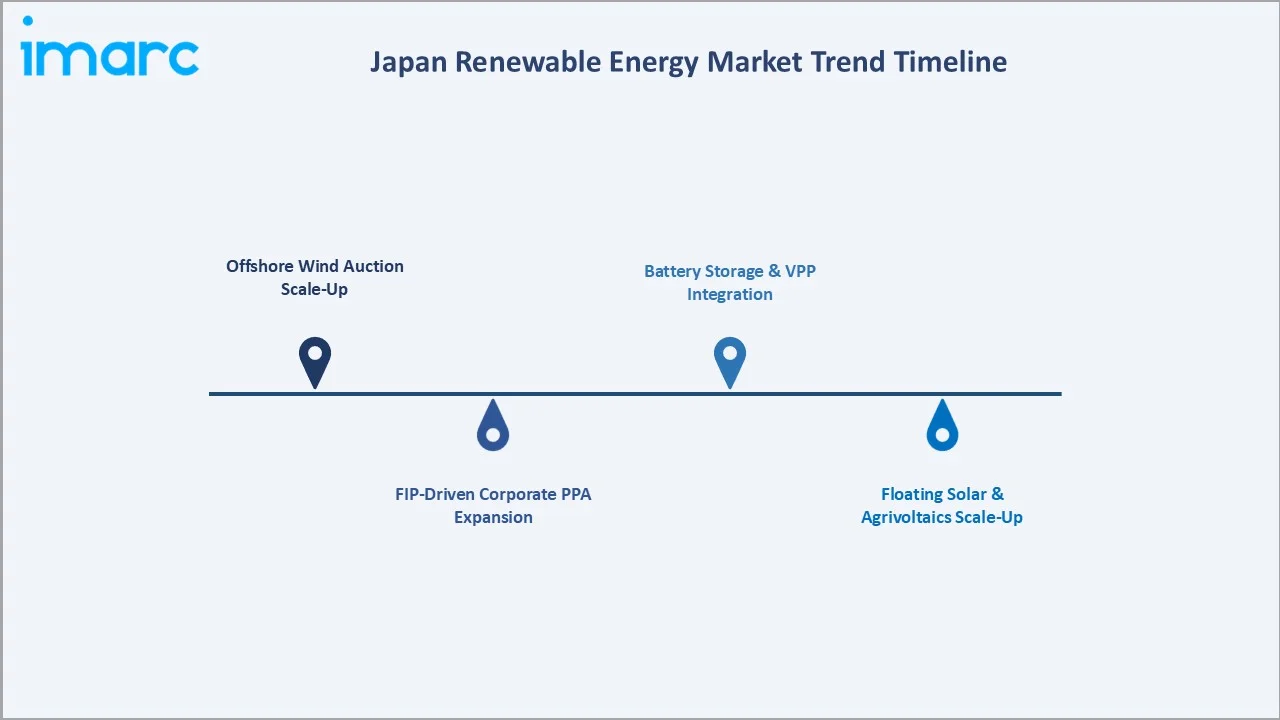
Sequential government auction rounds are allocating fixed-bottom offshore wind capacity across Tohoku and Kyushu coastal zones, with commissioned projects validating economics in sub-50-meter depths and establishing a domestic supply chain for future rounds.
2. FIP-Driven Corporate PPA Expansion
The shift toward Feed-in Premium is encouraging direct corporate power purchase agreements, as data centers and manufacturers seek long-term renewable supply contracts to hedge wholesale price exposure while meeting decarbonization targets.
3. Battery Storage & VPP Integration
Utility-scale battery storage and virtual power plant platforms are being deployed alongside solar and wind assets to manage curtailment, provide grid balancing services, and improve renewable project revenue stability.
4. Floating Solar & Agrivoltaics Scale-Up
Land constraints are driving adoption of floating solar on reservoirs and agrivoltaic installations that combine agricultural use with power generation, unlocking new site availability for utility-scale solar expansion.
Industry Value Chain Analysis
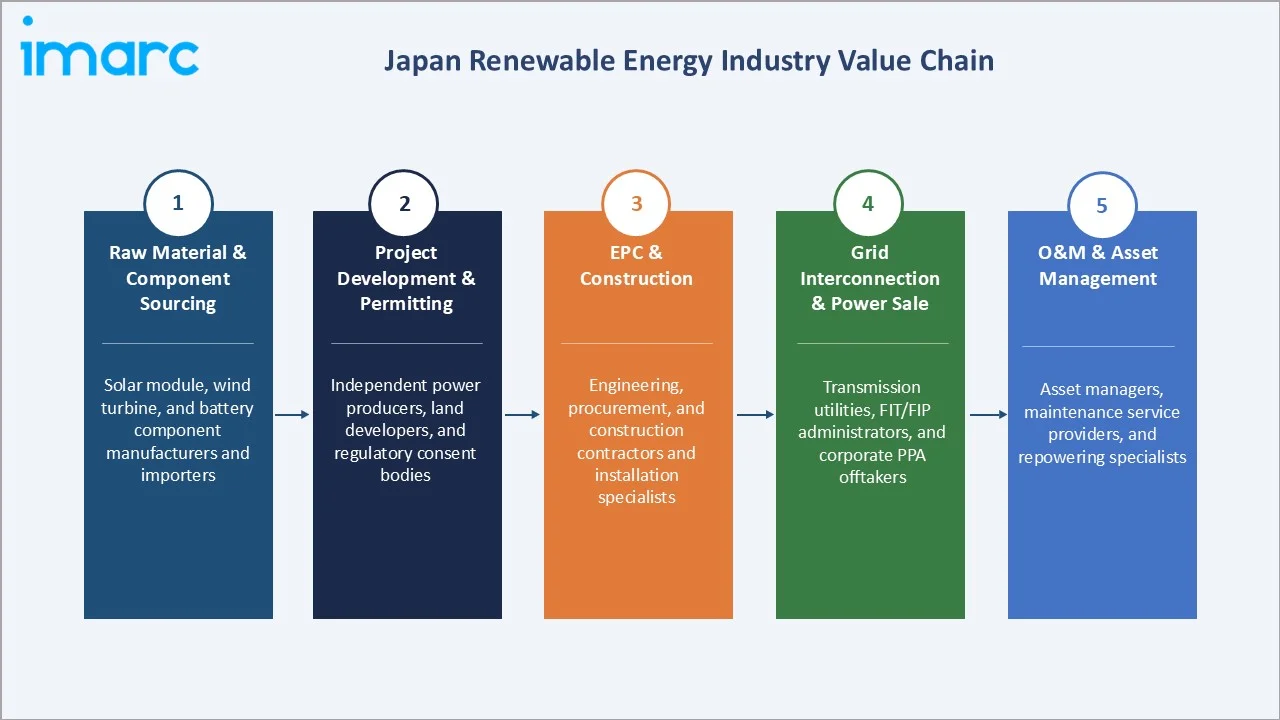
The Japan renewable energy value chain integrates raw material and component sourcing, project development and permitting, EPC and construction, grid interconnection and power sale, and ongoing operations and maintenance across solar, wind, hydro, and bioenergy assets nationwide.
|
Stage |
Key Participants |
|
Raw Material & Component Sourcing |
Solar module, wind turbine, and battery component manufacturers and importers |
|
Project Development & Permitting |
Independent power producers, land developers, and regulatory consent bodies |
|
EPC & Construction |
Engineering, procurement, and construction contractors and installation specialists |
|
Grid Interconnection & Power Sale |
Transmission utilities, FIT/FIP administrators, and corporate PPA offtakers |
|
O&M & Asset Management |
Asset managers, maintenance service providers, and repowering specialists |
Technology Landscape in the Japan Renewable Energy Industry
Photovoltaic (PV) Solar Technology
PV solar technology, spanning rooftop, ground-mount, and floating installations, remains Japan's most widely deployed renewable technology due to falling module costs, land-flexible siting, and non-FIT merchant project viability.
Offshore & Onshore Wind Technology
Offshore and onshore wind technology is scaling through sequential auction rounds, with fixed-bottom turbines dominating current capacity and floating wind pilots targeting deepwater sites in southern prefectures beyond 2026.
Battery Energy Storage Systems (BESS)
Battery energy storage systems are increasingly paired with solar and wind assets to manage curtailment, provide frequency regulation, and enable virtual power plant participation in Japan's balancing markets.
Market Segmentation Analysis
The report covers the following segments:
|
Segment Category |
Leading Segment |
Market Share |
Year |
|
Type |
Solar |
46.8% |
2025 |
|
Region |
Kanto Region |
34.7% |
2025 |

By Type
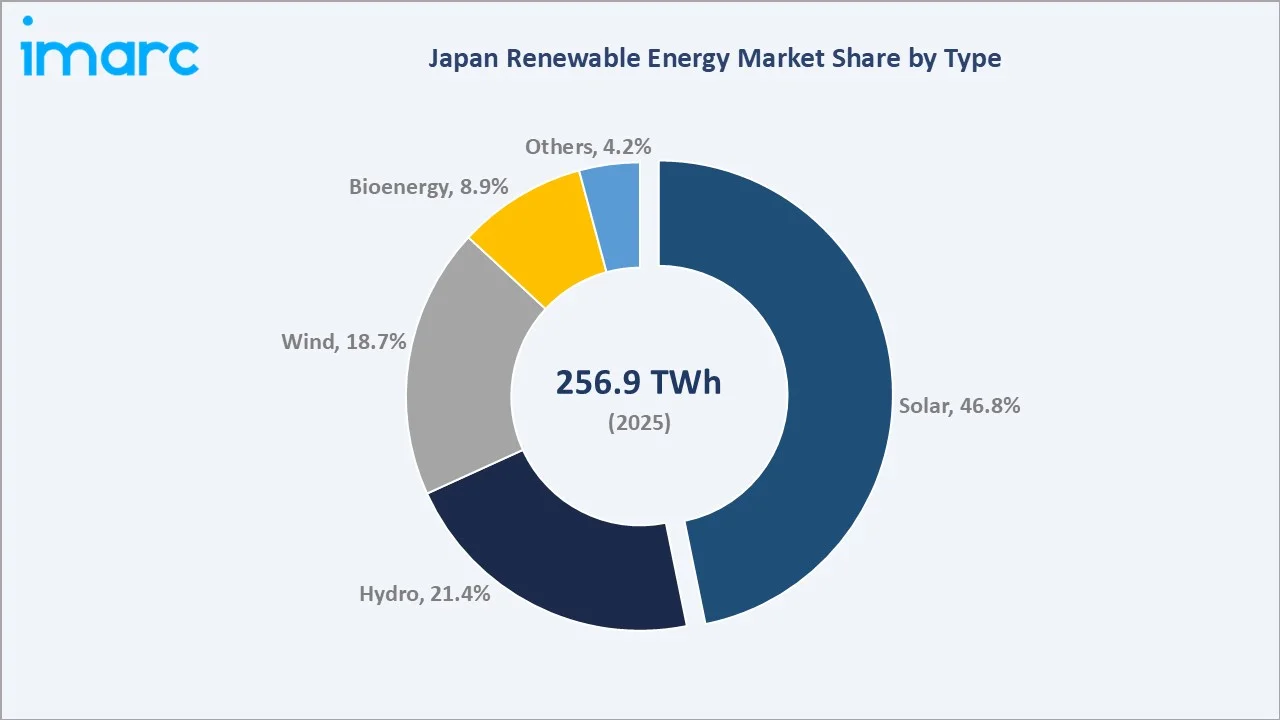
Solar leads the type segment at 46.8% in 2025, followed by hydro at 21.4%, wind at 18.7%, bioenergy at 8.9%, and other renewable sources, including geothermal, at 4.2%.
To access detailed market analysis, Request Sample
Wind is forecast to grow fastest among all types through 2034, driven by offshore auction commissioning, while solar's non-FIT and agrivoltaic pipeline sustains its leading share across the forecast period.
Regional Market Insights
|
Region |
Share (2025) |
Key Market Drivers & Characteristics |
|
Kanto Region |
34.7% |
Driven by dense corporate and data-center power demand, concentrated C&I solar deployment, and strong grid infrastructure |
|
Kansai/Kinki Region |
18.5% |
Supported by industrial energy demand and expanding solar and biomass capacity |
|
Central/Chubu Region |
15.6% |
Anchored by legacy hydro assets and growing utility-scale solar development |
|
Kyushu-Okinawa Region |
9.3% |
High solar penetration with periodic curtailment; emerging offshore wind interest |
|
Tohoku Region |
7.2% |
Leading offshore and onshore wind auction node with favorable coastal wind resources |
|
Chugoku Region |
5.5% |
Moderate solar and biomass capacity supported by regional industrial demand |
|
Hokkaido Region |
5.1% |
Strong wind resource potential with grid capacity investment underway |
|
Shikoku Region |
4.1% |
Smaller-scale solar and hydro capacity serving regional demand |
Kanto, at 34.7%, leads through concentrated corporate and data-center power demand alongside strong grid infrastructure. Kansai/Kinki, at 18.5%, and Central/Chubu, at 15.6%, reflect established industrial demand and legacy hydro capacity respectively.
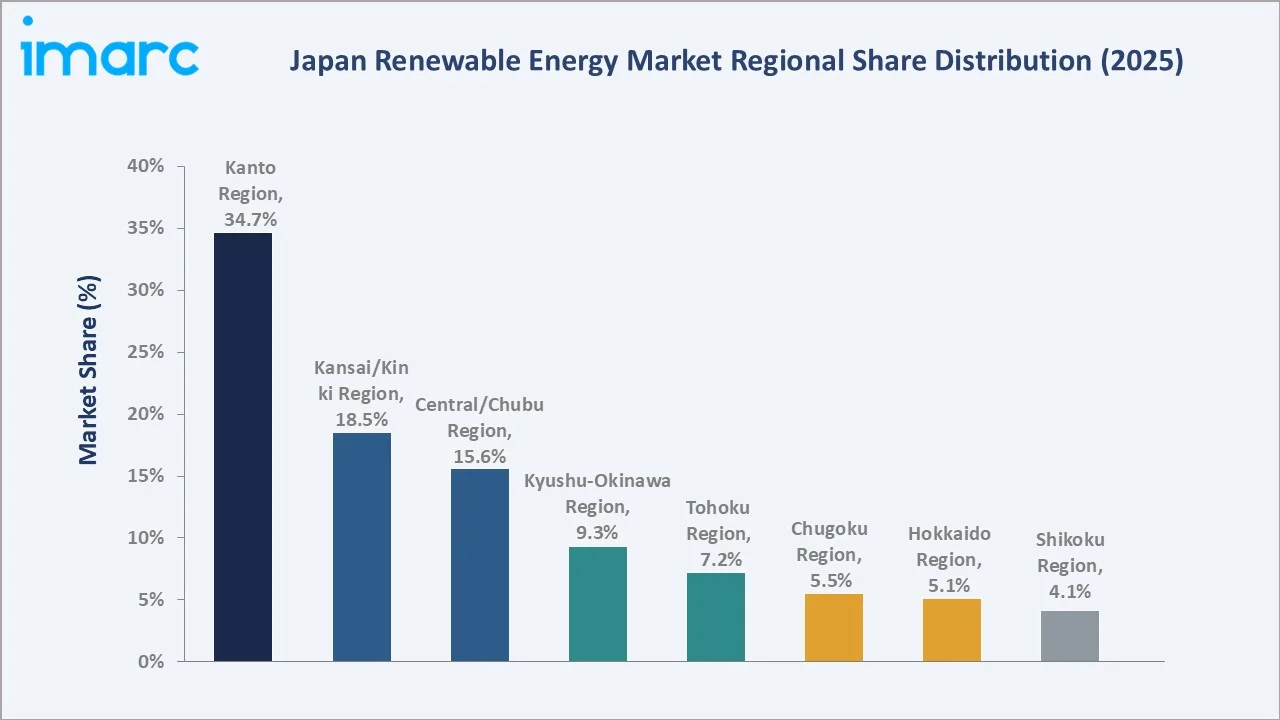
Kyushu-Okinawa, at 9.3%, and Tohoku, at 7.2%, represent Japan's leading solar curtailment and offshore wind auction nodes respectively, while Chugoku, Hokkaido, and Shikoku collectively represent smaller but steadily growing renewable markets.
Competitive Landscape
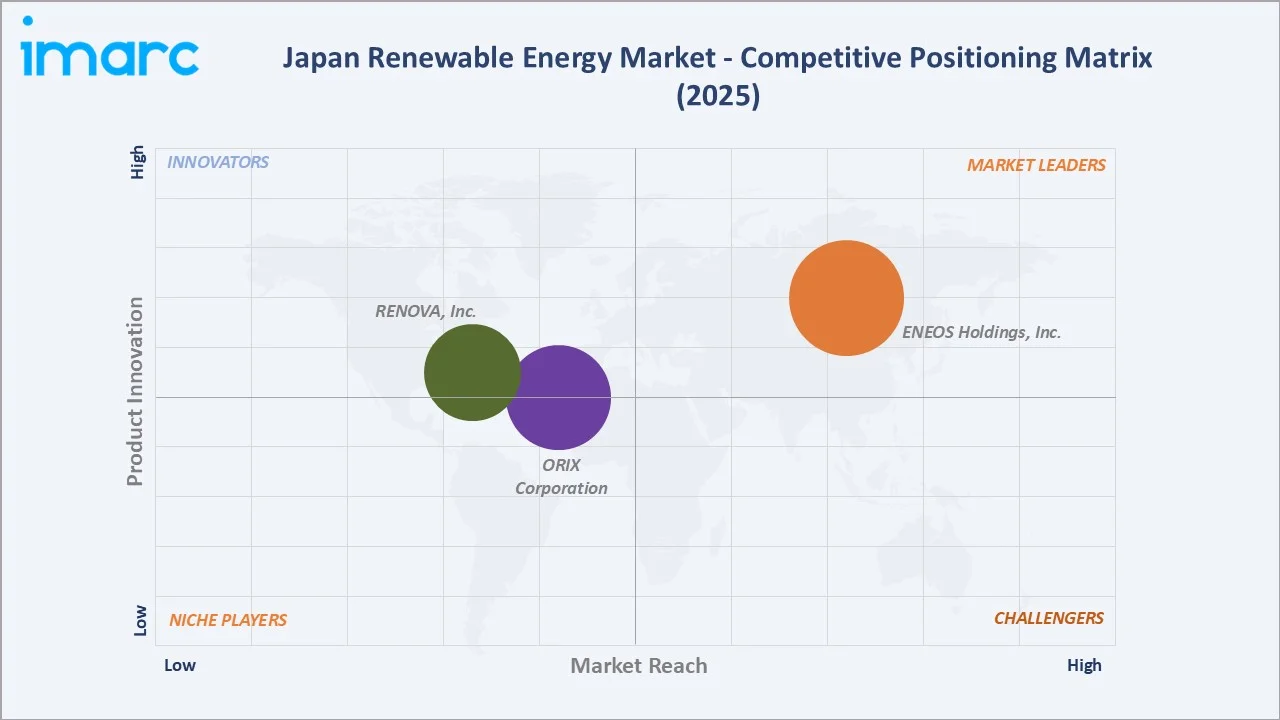
The Japan renewable energy market competitive landscape is moderately fragmented, comprising diversified utility-affiliated developers, independent power producers, and trading house-backed renewable platforms competing across solar, wind, and hydro asset classes.
|
Company Name |
Key Products |
Market Position |
Core Strength |
|
ENEOS Holdings, Inc. |
Solar & Wind Power Generation |
Market Leader |
Nationwide energy infrastructure and retail distribution network |
|
RENOVA, Inc. |
Solar PV, Biomass, Wind, Geothermal Power Plants |
Established Player |
Independent power producer of renewable capacity energy with a nationwide network |
|
ORIX Corporation |
Solar & Wind Power Generation Assets |
Established Player |
Diversified financial and leasing group with a nationwide renewable asset portfolio |
Key players include ENEOS Holdings, Inc., RENOVA, Inc., ORIX Corporation, and others.
Key Company Profiles
ENEOS Holdings, Inc.
ENEOS Holdings, Inc. is Japan's largest energy conglomerate, developing and operating solar, onshore and offshore wind, and biomass power generation assets nationwide through its renewable energy subsidiary.
- Key Products: Solar & Wind Power Generation
- Recent Developments: In 2026, JERA continued scaling JERA Nex's global renewable platform, targeting 20 GW of cumulative renewable capacity by 2035, up from approximately 3.4 GW currently in operation.
- Strategic Focus: Expanding cumulative renewable capacity, mainly through solar and onshore wind, while advancing offshore wind projects and strengthening PPA-based revenue models with storage battery integration.
RENOVA, Inc.
RENOVA, Inc. is a Tokyo-headquartered independent power producer developing and operating solar, wind, biomass, and geothermal power plants across Japan and select Asian markets.
- Key Products: Solar PV, onshore wind, biomass, and geothermal power plants, alongside non-FIT solar and energy storage development.
- Strategic Focus: Scaling non-FIT solar and diversified renewable asset development while advancing green transformation (GX) business initiatives.
Market Concentration Analysis
The Japan renewable energy market is moderately fragmented, with the top 5-6 key players collectively representing a significant share of utility-scale renewable capacity, alongside numerous regional and independent developers. Concentration is expected to rise moderately as offshore wind auction winners scale commissioned capacity through 2034.
Investment & Growth Opportunities
Highest Growth Segments
Offshore wind, battery storage-integrated solar, and corporate PPA-backed non-FIT solar represent the highest-growth investment vectors through 2034, supported by sequential auction rounds and rising corporate decarbonization demand.
Emerging Investment Opportunities
Floating solar and agrivoltaics represent Japan's highest-potential emerging opportunity, unlocking new site availability in a land-constrained market while diversifying revenue for agricultural landowners and developers alike.
Investment Themes
- Offshore Wind Auction Capacity Allocation: Offshore wind auction participation offers long-term capacity allocation for developers able to navigate local content requirements and fishery consultation processes across Tohoku and Kyushu nodes.
- Battery Storage & VPP Revenue Stacking: Battery storage and VPP integration create a structural revenue advantage for developers managing curtailment risk under Japan's evolving Feed-in Premium market design.
Future Market Outlook (2026-2034)
The Japan renewable energy market is projected to grow from 256.9 TWh in 2025 to 356.2 TWh by 2034, delivering a 3.70% CAGR. By 2030, the market is expected to reach approximately 308.0 TWh as offshore wind auction capacity, non-FIT solar, and battery storage integration scale nationwide.
Three structural forces define growth through 2034: continued FIT/FIP policy support sustaining project financing, rising corporate PPA demand from data centers and manufacturers, and offshore wind auction commissioning unlocking Japan's largest untapped renewable resource base.
Research Methodology
Primary Research
Primary research comprised structured interviews with industry stakeholders, including renewable project developers, utility executives, policy analysts, and corporate offtake managers across Japan's renewable energy sector.
Secondary Research
Secondary research encompassed company annual reports, METI policy publications, offshore wind auction results, and industry association data covering Japan's renewable energy capacity and generation trends.
Forecasting Models
Market forecasts were developed using a bottom-up generation model incorporating installed capacity by type, capacity factor assumptions, regional grid constraints, and policy-driven capacity addition schedules through 2034.
Japan Renewable Energy Market Report Coverage:
| Report Features | Details |
|---|---|
| Base Year of the Analysis | 2025 |
| Historical Period | 2020-2025 |
| Forecast Period | 2026-2034 |
| Units | TWh |
| Scope of the Report | Exploration of Historical and Forecast Trends, Industry Catalysts and Challenges, Segment-Wise Historical and Predictive Market Assessment:
|
| Types Covered | Solar, Wind, Hydro, Bioenergy, Others |
| Regions Covered | Kanto Region, Kansai/Kinki Region, Central/ Chubu Region, Kyushu-Okinawa Region, Tohoku Region, Chugoku Region, Hokkaido Region, Shikoku Region |
| Companies Covered | ENEOS Holdings, Inc., RENOVA, Inc., ORIX Corporation, etc. |
| Customization Scope | 10% Free Customization |
| Post-Sale Analyst Support | 10-12 Weeks |
| Delivery Format | PDF and Excel through Email (We can also provide the editable version of the report in PPT/Word format on special request) |
Key Benefits for Stakeholders:
- IMARC’s industry report offers a comprehensive quantitative analysis of various market segments, historical and current market trends, market forecasts, and dynamics of the Japan renewable energy market from 2020-2034.
- The research report provides the latest information on the market drivers, challenges, and opportunities in the Japan renewable energy market.
- Porter's five forces analysis assist stakeholders in assessing the impact of new entrants, competitive rivalry, supplier power, buyer power, and the threat of substitution. It helps stakeholders to analyze the level of competition within the Japan renewable energy industry and its attractiveness.
- Competitive landscape allows stakeholders to understand their competitive environment and provides an insight into the current positions of key players in the market.
Frequently Asked Questions About the Japan Renewable Energy Market Report
The Japan renewable energy market reached 256.9 TWh in 2025, driven by solar's 46.8% type share and the Kanto Region's 34.7% regional share.
The market grows at a 3.70% CAGR during 2026-2034, reaching 356.2 TWh by 2034.
Solar leads at 46.8% in 2025, followed by hydro at 21.4% and wind at 18.7%.
The Kanto Region leads at 34.7%, followed by Kansai/Kinki at 18.5% and Central/Chubu at 15.6%.
Leading companies include ENEOS Holdings, Inc., RENOVA, Inc., ORIX Corporation, and others.
The market is projected to reach approximately 308.0 TWh by 2030, supported by offshore wind auction commissioning and non-FIT solar expansion.
Priority opportunities include offshore wind auction capacity allocation, battery storage and VPP integration, and floating solar and agrivoltaic development.
Land scarcity and grid congestion, complex permitting and local consent requirements, and merchant price risk under the Feed-in Premium regime are the primary restraints.
Need more help?
- Speak to our experienced analysts for insights on the current market scenarios.
- Include additional segments and countries to customize the report as per your requirement.
- Gain an unparalleled competitive advantage in your domain by understanding how to utilize the report and positively impacting your operations and revenue.
- For further assistance, please connect with our analysts.
 Request Customization
 Speak to an Analyst
 Request Brochure
 Inquire Before Buying
Benefits of Customization
- Personalize this research
- Triangulate with your data
- Get data as per your format and definition
- Gain a deeper dive into a specific application, geography, customer, or competitor
- Any level of personalization
Get in Touch With Us
UNITED STATES
Phone: +1-201-971-6302
INDIA
Phone: +91-120-433-0800
UNITED KINGDOM
Phone: +44-753-714-6104
Email: [email protected]
Client Testimonials




.webp)




.webp)













Related Reports

Choose your plan
*Please note that the prices mentioned below are starting prices for each bundle type. Kindly contact our team for further details.*
Single User License
- 1 User License, Access on 2 Devices
- PDF Report + Excel Dataset (Password Protected)
- Lifetime Access
- No Printing Rights
- 10% Free Report Customization
- 10–12 Weeks of Analyst Support
Five User License
- Access for 5 Users, 2 Devices per User
- PDF Report + Excel Dataset (Password Protected)
- Lifetime Access
- Dedicated Account Manager
- 12–14 Weeks of Analyst Support
- No Printing Rights
- 15% Free Report Customization
- 25% Discount on Your Next Purchase
Corporate User License
- Unlimited User Access (Within Your Organization)
- PDF Report + Excel Dataset
- Lifetime Access
- Dedicated Account Manager
- 14–20 Weeks of Analyst Support
- No Printing Rights
- 20% Free Report Customization
- 30% Discount on Your Next Purchase
Essential Insights
What's included:
3 reports
- Lifetime Access
- PDF Reports
- Excel Datasets
- 2 Weeks of Free Analyst Support
- 2 User Licenses
- Access on 2 Devices
- Printing Rights
- Complimentary PowerPoint (PPT) Version
- Complimentary License Upgrade
Professional Access
What's included:
5 reports
- Lifetime Access
- PDF Reports
- Excel Datasets
- 8 Weeks of Free Analyst Support
- 2 User Licenses
- Access on 2 Devices
- Printing Rights
- Complimentary PowerPoint (PPT) Version
- Complimentary License Upgrade
Business Advantage
What's included:
8 reports
- Lifetime Access
- PDF Reports
- Excel Datasets
- 14 Weeks of Free Analyst Support
- 2 User Licenses
- Access on 2 Devices
- Printing Rights
- Complimentary PowerPoint (PPT) Version
- Complimentary License Upgrade
Enterprise Intelligence
What's included:
10 reports
- Lifetime Access
- PDF Reports
- Excel Datasets
- 20 Weeks of Free Analyst Support
- 2 User Licenses
- Access on 2 Devices
- Printing Rights
- Complimentary PowerPoint (PPT) Version
- Complimentary License Upgrade