
Pressure Gauge Market Size, Share, Trends and Forecast by Output Type, Technology, Application, and Region, 2026-2034
Pressure Gauge Market Size and Share:
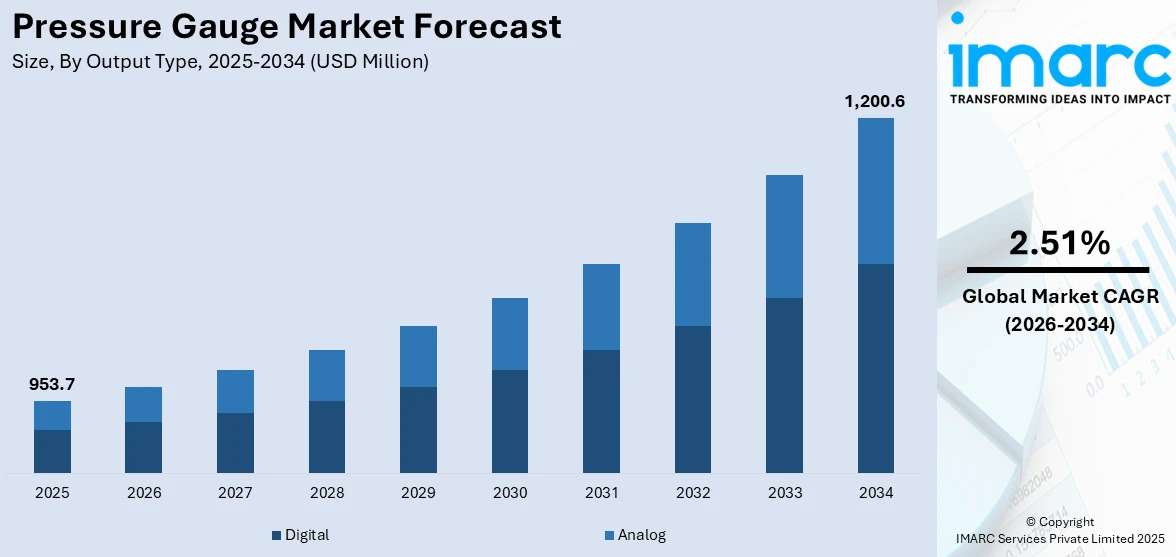
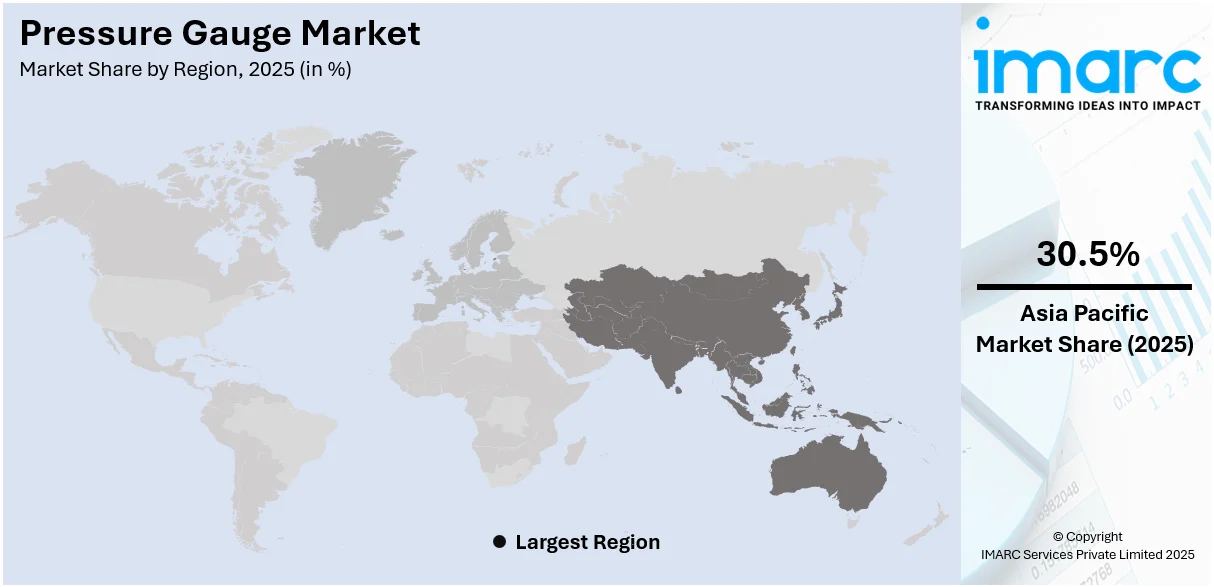
The global pressure gauge market size was valued at USD 953.7 Million in 2025. Looking forward, IMARC Group estimates the market to reach USD 1,200.6 Million by 2034, exhibiting a CAGR of 2.51% from 2026-2034. Asia-Pacific currently dominates the market, holding a market share of over 30.5% in 2025. The pressure gauge market share is expanding, driven by the increasing adoption of precision pressure monitoring tools in various end-use industries, technological advancements leading to the introduction of product variants with enhanced accuracy and durability, and rising stringency for regulatory compliance.
|
Report Attribute
|
Key Statistics
|
|---|---|
|
Base Year
|
2025
|
|
Forecast Years
|
2026-2034
|
|
Historical Years
|
2020-2025
|
| Market Size in 2025 | USD 953.7 Million |
| Market Forecast in 2034 | USD 1,200.6 Million |
| Market Growth Rate (2026-2034) | 2.51% |
At present, increase in industrial activities is impelling the market growth. Firms utilize pressure gauges to monitor fluid and gas pressure, preventing equipment failures and ensuring smooth operations. Besides this, rising investments in infrastructure projects are driving the demand for pressure gauges, especially in water treatment plants and heating, ventilation, and air conditioning (HVAC) systems. Additionally, with the increasing adoption of automation, businesses need more precise and reliable pressure regulating solutions. Digital pressure gauges with remote tracking are further making operations more efficient. Moreover, government agencies implement strict workplace safety and environmental rules, encouraging industries to wager on better tools.
To get more information on this market Request Sample
The United States has emerged as a major region in the pressure gauge market owing to many factors. The rise of automation is offering a favorable pressure gauge market outlook. This is encouraging industries to employ digital pressure gauges for better accuracy and remote monitoring. Besides this, with the country’s high investments in the energy sector, pressure gauges are essential for monitoring pipelines, refineries, and power plants. In addition, government agencies are coming up with strict workplace safety and environmental rules, making reliable pressure gauges a priority. In July 2024, the Occupational Safety and Health Administration (OSHA) declared new financial support for initiatives aimed at workplace safety in the US. The grants sought to improve job quality for the US workforce by offering instructor-led training for employees, supervisors, and employers in small businesses, including sectors with elevated injury, illness, and death rates. As industries focus on efficiency and compliance, pressure gauges remain an important tool for keeping systems safe and running smoothly.
Pressure Gauge Market Trends:
Industrial Growth and Rising Demand for Automation
As activities in industries like chemical, manufacturing, and power generation are expanding, the need for accurate pressure monitoring is increasing. The rise in industrial automation also plays an important role, as automation systems require precise and reliable instrumentation to ensure optimal performance and safety. Advanced pressure gauges are crucial for supervising systems, such as pipelines, reactors, and compressors, helping industries to maintain operational efficiency and meet safety standards. Furthermore, the well-established manufacturing base in India promotes the usage of pressure gauges. According to IBEF, India has a potential export worth USD 1 Trillion by 2030, positioning it as one of the biggest manufacturing centers worldwide. Since manufacturing activities in India are on the rise, the requirement for effective pressure gauges in industries is high.
Safety Regulations and Compliance
The rising implementation of stringent safety standards and regulations is impelling the pressure gauge market growth. In June 2024, the Offshore Petroleum and Greenhouse Gas Storage Legislation Amendment (Safety and Other Measures) Act 2024 was enacted to offer welfare for workers in offshore oil and gas sectors in Australia. It aimed to improve employees’ health and well-being by safeguarding them from discrimination and coercion. Major industries, such as oil and gas, are required to adhere to strict protection protocols, which mandate the use of reliable pressure gauges to ensure safe operations. Compliance with regulatory bodies like the OSHA and the International Organization for Standardization (ISO) necessitates the integration of high-quality accurate pressure gauges. These instruments are crucial in meeting safety requirements, ensuring system integrity, and preventing accidents. As regulations continue to evolve and become more rigorous, the demand for pressure gauges increases, encouraging innovations and adoption across various sectors.
Technological Advancements and Innovations
The growing development of smart pressure gauges with advanced features, such as wireless communication, the Internet of Things (IoT) connectivity, and digital displays is positively influencing the market. These advancements allow for immediate oversight and foresight in maintenance, boosting operational effectiveness and minimizing idle time across industries, such as automotive, HVAC, and water management. Additionally, ongoing advancements in pressure gauge technologies are increasing their versatility and broadening their applications in various sectors. A notable example is Honeywell International Inc., which unveiled the modern generation of its cabin pressure control and monitoring system in January 2021. This new system is all-electric, lightweight, and employed in both commercial and military aircraft, including business, regional aviation, and tactical or military trainer-sized aircraft. Such advanced pressure regulating systems, integrated into aerospace applications, are evidence of the increasing utilization of smart pressure gauges in various industries and the high demand for more complex and efficient solutions.
Pressure Gauge Industry Segmentation:
IMARC Group provides an analysis of the key trends in each segment of the global pressure gauge market, along with forecast at the global, regional, and country levels from 2026-2034. The market has been categorized based on output type, technology, and application.
Analysis by Output Type:
- Analog
- Digital
Digital accounted for 71.8% of the market share in 2025. Digital pressure gauges with their greater accuracy, clarity, and other features compared with normal analogic gauges are favored in sectors, such as oil and gas, manufacturing, and healthcare for real-time monitoring, remote management, and user-friendly interface. As automation rises, companies seek reliable pressure gauges to ensure safety and effectiveness. Digital gauges often include wireless capabilities and smart technology, making such gauges perfect for modern-day industrial environments. They eliminate human error because they give precise pressure values that can be read more easily and do not require interpretation. Numerous digital models offer data recording and alarm systems that aid industries in pinpointing problems and preventing malfunctions. As technology advances, the comfort with which interactive digital pressure gauges are manufactured and handled makes them cheaper and more available, thus aiding their wider uses in many industries. The digital pressure gauges rank the best in the market due to their consistent reliability, ease of use, and adaptability to higher levels of automation.
Analysis by Technology:
- Piezoresistive Pressure Gauge
- Capacitive Pressure Gauge
- Electromagnetic Pressure Gauge
- Resonant Solid State Pressure Gauge
- Optical Pressure Gauge
Piezoresistive pressure gauge holds 45.1% of the market share. They provide excellent accuracy, strength, and reliability in various sectors. The devices work by converting pressure to electrical signals, making them ideal for real-time monitoring and automation. Sectors, such as healthcare, aerospace, automotive, and oil and gas favor piezoresistive technology due to its ability to withstand harsh conditions and generate consistent measurements. Companies increasingly look for fast and accurate pressure measurements for automation. This need is met by piezoresistive sensors. They find great applications in ventilators and deliver reliable performance. Their streamlined structure and ability to interface with digital systems make them popular primarily in modern industrial setups. As industries demand more advanced and efficient monitoring solutions, piezoresistive pressure gauges are adopted since they offer a perfect mix of longevity and smart technology integration.
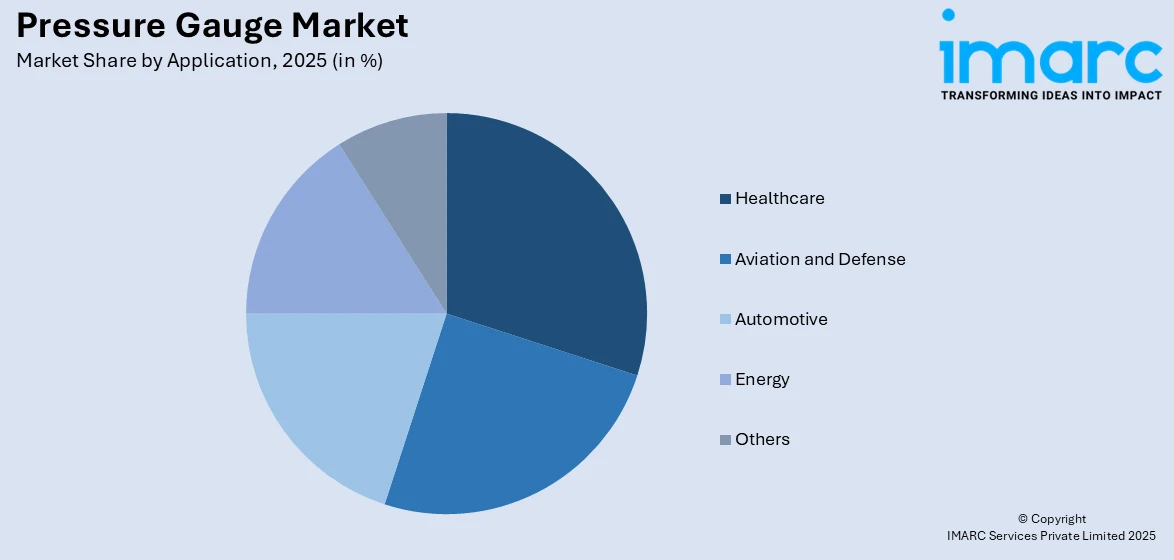
Analysis by Application:
Access the comprehensive market breakdown Request Sample
- Aviation and Defense
- Automotive
- Healthcare
- Energy
- Others
Healthcare holds 30.2% of the market share. Accurate pressure measurement is used in medical devices to offer patient safety and efficient treatment. Medical facilities utilize pressure gauges in ventilators, anesthesia devices, blood pressure monitors, and oxygen therapy apparatuses. The demand for reliable medical devices, with increasing healthcare services requirement and an aging population, continues to rise. Real-time monitoring capabilities and precision are key in piezoresistive and digital pressure gauges to ensure smooth patient operation. Stringent regulations enable hospitals and manufacturers alike to invest in reliable pressure gauges to adhere to the rules of safety. Pressure gauges with high intelligence and remote monitoring aspects keep gaining importance, as medical technology advances. Pressure gauges remain a key accessory in most modern medical devices, as the healthcare industry keeps growing across the globe.
Regional Analysis:
To get more information on the regional analysis of this market Request Sample
- North America
- United States
- Canada
- Asia-Pacific
- China
- Japan
- India
- South Korea
- Australia
- Indonesia
- Others
- Europe
- Germany
- France
- United Kingdom
- Italy
- Spain
- Russia
- Others
- Latin America
- Brazil
- Mexico
- Others
- Middle East and Africa
Asia-Pacific, accounting for 30.5%, enjoys the leading position in the market. The region is recognized for its high investments in construction projects and high demand from key industries like manufacturing and healthcare. Nations, such as China, India, and Japan have well-established industrial bases that depend on pressure gauges for safe and efficient operations. The area’s expanding energy and power activities also create the need for pressure gauges, especially for monitoring pipelines and power plants. With the growing healthcare requirements, hospitals and medical device manufacturers employ high-precision pressure gauges for equipment like ventilators and blood pressure monitors. Besides this, rising government spending on smart cities and infrastructure projects is driving the demand for pressure gauges, especially in HVAC and water treatment systems. As of September 10, 2024, Indian government programs, such as the Pradhan Mantri Awas Yojana-Urban (PMAY-U) achieved notable advancements by approving 1.18 Crore houses, with 86.6 lakh finished and 1.15 Crore initiated for building. By 2030, the construction sector's contribution to India's economic output is projected to hit USD 1 Trillion while jobs in this sector are expected to grow by 100 Million. Additionally, government agencies in the region are implementing stricter safety and environmental regulations, motivating firms to adopt modern pressure supervision solutions.
Key Regional Takeaways:
United States Pressure Gauge Market Analysis
The United States hold 82.40% of the market share in North America. A record high in crude oil production in the United States recorded at above 13.3 Million b/d in December 2023, as reported by the US Energy Information Administration (EIA), was a significant growth driver in the market. With further expansion of oil and gas manufacturing, there is a heightened need to incorporate greater accuracy with reliable pressure monitoring systems to ensure safe and efficient upstream, midstream, and downstream operations. The demand for pressure gauges remains high in drilling rigs, pumping stations, refineries, and pipeline monitoring systems. Safety and effectiveness necessitate real-time pressure monitoring systems. Besides this, there is a growing requirement to enhance capacities in shale plays and offshore fields where better-quality pressure measurement solution is needed for these fields to function properly. This increase in production, along with the continuous technological advancements in pressure gauges, is impelling the market growth across the United States, supporting sectors like chemical processing and manufacturing.
Europe Pressure Gauge Market Analysis
The development of automobile assembly, engine, and battery manufacturing facilities in Europe, rising to 322 in 2023 from 301 in 2021, as per the European Automobile Manufacturers Association (ACEA), is a major catalyst for the regional market. As the automotive sector progresses, especially with the increase in electric vehicle (EV) production, the demand for sophisticated pressure monitoring systems has risen. Pressure gauges are vital tools for guaranteeing the safety and efficiency of manufacturing processes like engine testing, battery production, and assembly lines. Furthermore, automating production lines necessitates precise pressure monitoring to ensure enhanced efficiency in operations and maintain high-quality standards. With more stringent regulations and industry standards regarding quality control, pressure gauges are crucial for satisfying these criteria.
Asia-Pacific Pressure Gauge Market Analysis
The Asia Pacific pressure gauge market is experiencing significant growth due to high industrial investments across the region. According to the International Trade Administration (ITA), China planned to spend USD 8 Billion between 2021 and 2025 to establish new sludge processing facilities, a trend seen across various industries, including paper and pulp, oil and gas, and construction. These sectors demand precise pressure monitoring systems for the smooth and safe running of operations. Further, the capital investment for infrastructure projects rose by 33% in the Indian budget for fiscal year 2023-2024, thus creating the need for pressure gauges in construction and industrial applications. The requirement for precise pressure monitoring in critical systems, such as pipelines, reactors, and compressors, is set to grow in Asia Pacific with the further development and modernization of industries.
Latin America Pressure Gauge Market Analysis
The real GDP growth of Brazil was projected to attain 2.9% in 2023 and was set to grow at a rate of 2.8% over 2024, according to the World Bank. A strong demand for industrial equipment like pressure gauges is indicated by the expansion of industrial activities in sectors like oil and gas, manufacturing, and infrastructure sectors where the processes rely on accurate pressure monitoring systems to ensure high efficiency and safety. Oil usage in Brazil rose by 5.3 Million b/d in 2021, according to BP's statistical review. This marked a recovery in the energy sector. Although consumption remained below 2019 levels, the increasing requirement for oil and gas in the area is anticipated to enhance the pressure gauge needs in the exploration, production, and refining processes.
Middle East and Africa Pressure Gauge Market Analysis
The Middle East plays a pivotal role in worldwide energy markets, with five of the world's top 10 oil producers: Iraq, the United Arab Emirates, Saudi Arabia, Kuwait, and Kuwait and 3 of the significant 20 gas producers, according to the International Energy Agency (IEA). The region accounted for over 40% of global oil exports in 2022, showcasing its importance in the energy sector. This massive contribution to energy production drives the demand for reliable pressure monitoring systems, which are crucial for safety, efficiency, and compliance with industry standards. With the expansion of oil and gas exploration, production, and refining in the region, high-quality pressure gauges become critical to ensure optimal performance in challenging environments.
Competitive Landscape:
Key players work on developing modern and high-precision items to meet the growing pressure gauge market demand. They spend resources on research and innovations, introducing digital and smart gauges with remote monitoring, real-time data tracking, and wireless connectivity. Big companies expand their product lines to serve various industries like oil & gas, manufacturing, healthcare, and HVAC. Strategic partnerships, mergers, and acquisitions help them to strengthen their market presence and reach more users. Many firms focus on compliance with strict safety and environmental regulations, making their items essential for industries that need accurate pressure monitoring. They also offer training, software support, and after-sales services to enhance customer experience and adapt to changing requirements. For instance, in June 2023, CIRCOR International Inc. revealed that it finalized an agreement to be purchased through investment funds overseen by KKR, a prominent international investment company, in a cash deal worth about USD 1.6 Billion, which includes the takeover of debt.
The report provides a comprehensive analysis of the competitive landscape in the pressure gauge market with detailed profiles of all major companies, including:
- AMETEK Inc.
- Badotherm
- CIRCOR International Inc.
- Crane Co.
- Dwyer Instruments Inc.
- Emerson Electric Co.
- Fluke Corporation (Fortive Corporation)
- Honeywell International Inc.
- Newbow Aerospace Ltd.
- OMEGA Engineering Inc. (Spectris plc)
- QED Aerospace
- WIKA Alexander Wiegand SE & Co. KG
- Winters Instruments Limited
Latest News and Developments:
- January 2025: Kingsway Instruments teamed up with Additel to announce the latest enhancements to the Additel product range, showcasing a full array of digital pressure gauges, such as the 601Ex, 680A, and 681A, in addition to their advanced multifunction process calibrators, which included the 226 and 227 models.
Pressure Gauge Market Report Scope:
| Report Features | Details |
|---|---|
| Base Year of the Analysis | 2025 |
| Historical Period | 2020-2025 |
| Forecast Period | 2026-2034 |
| Units | Million USD |
| Scope of the Report | Exploration of Historical Trends and Market Outlook, Industry Catalysts and Challenges, Segment-Wise Historical and Future Market Assessment:
|
| Output Types Covered | Analog, Digital |
| Technologies Covered | Piezoresistive Pressure Gauge, Capacitive Pressure Gauge, Electromagnetic Pressure Gauge, Resonant Solid State Pressure Gauge, Optical Pressure Gauge |
| Applications Covered | Aviation and Defense, Automotive, Healthcare, Energy, Others |
| Regions Covered | Asia Pacific, Europe, North America, Latin America, Middle East and Africa |
| Countries Covered | United States, Canada, Germany, France, United Kingdom, Italy, Spain, Russia, China, Japan, India, South Korea, Australia, Indonesia, Brazil, Mexico |
| Companies Covered | AMETEK Inc., Badotherm, CIRCOR International Inc., Crane Co., Dwyer Instruments Inc., Emerson Electric Co., Fluke Corporation (Fortive Corporation), Honeywell International Inc., Newbow Aerospace Ltd., OMEGA Engineering Inc. (Spectris plc), QED Aerospace, WIKA Alexander Wiegand SE & Co. KG, Winters Instruments Limited, etc. |
| Customization Scope | 10% Free Customization |
| Post-Sale Analyst Support | 10-12 Weeks |
| Delivery Format | PDF and Excel through Email (We can also provide the editable version of the report in PPT/Word format on special request) |
Key Benefits for Stakeholders:
- IMARC’s report offers a comprehensive quantitative analysis of various market segments, historical and current market trends, market forecasts, and dynamics of the pressure gauge market from 2020-2034.
- The research study provides the latest information on the market drivers, challenges, and opportunities in the global pressure gauge market.
- The study maps the leading, as well as the fastest-growing, regional markets. It further enables stakeholders to identify the key country-level markets within each region.
- Porter's Five Forces analysis assists stakeholders in assessing the impact of new entrants, competitive rivalry, supplier power, buyer power, and the threat of substitution. It helps stakeholders to analyze the level of competition within the pressure gauge industry and its attractiveness.
- Competitive landscape allows stakeholders to understand their competitive environment and provides an insight into the current positions of key players in the market.
Frequently Asked Questions About the Pressure Gauge Market Size Report
The pressure gauge market was valued at USD 953.7 Million in 2025.
The pressure gauge market is projected to exhibit a CAGR of 2.51% during 2026-2034, reaching a value of USD 1,200.6 Million by 2034.
Technological advancements, such as digital and smart pressure gauges with remote monitoring capabilities, are making pressure measurement more accurate and efficient. Besides this, the rise of automation in industries is creating the need for precise pressure monitoring. Additionally, stringent government regulations for workplace safety and environmental protection are encouraging industries to invest in reliable pressure gauges.
Asia-Pacific currently dominates the pressure gauge market, accounting for a share of 30.5% in 2025, due to rapid industrial growth, urbanization, and high demand from manufacturing, energy, and healthcare sectors. The rise in the number of infrastructure projects, strict safety regulations, and increasing adoption of smart gauges are further impelling the market growth.
Some of the major players in the pressure gauge market include AMETEK Inc., Badotherm, CIRCOR International Inc., Crane Co., Dwyer Instruments Inc., Emerson Electric Co., Fluke Corporation (Fortive Corporation), Honeywell International Inc., Newbow Aerospace Ltd., OMEGA Engineering Inc. (Spectris plc), QED Aerospace, WIKA Alexander Wiegand SE & Co. KG, Winters Instruments Limited etc.
Need more help?
- Speak to our experienced analysts for insights on the current market scenarios.
- Include additional segments and countries to customize the report as per your requirement.
- Gain an unparalleled competitive advantage in your domain by understanding how to utilize the report and positively impacting your operations and revenue.
- For further assistance, please connect with our analysts.
 Request Customization
 Speak to an Analyst
 Request Brochure
 Inquire Before Buying
Benefits of Customization
- Personalize this research
- Triangulate with your data
- Get data as per your format and definition
- Gain a deeper dive into a specific application, geography, customer, or competitor
- Any level of personalization
Get in Touch With Us
UNITED STATES
Phone: +1-201-971-6302
INDIA
Phone: +91-120-433-0800
UNITED KINGDOM
Phone: +44-753-714-6104
Email: [email protected]
Client Testimonials


.webp)


