
United States Tin Market Size, Share, Trends and Forecast by Product Type, Application, End Use Industry, and Region, 2026-2034
United States Tin Market Size, Share, Trends & Forecast (2026-2034)
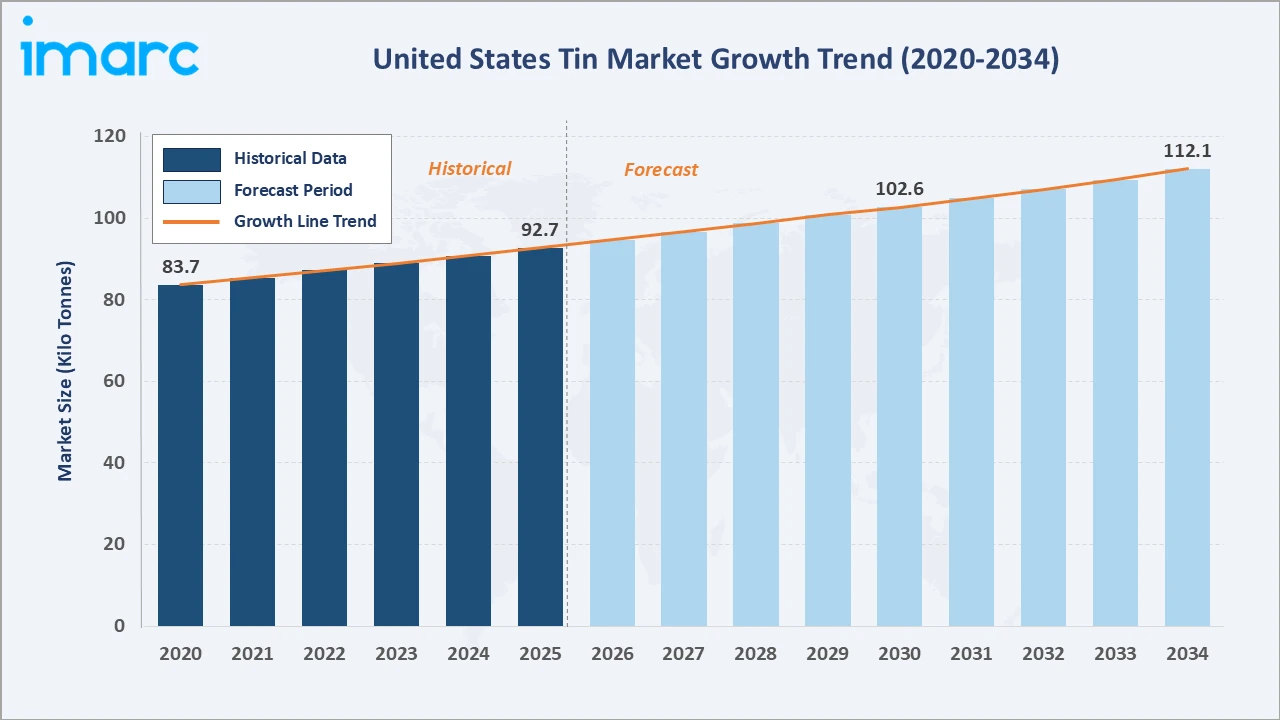
The United States tin market reached 92.7 Kilo Tonnes in 2025 and is projected to reach 112.1 Kilo Tonnes by 2034, growing at a CAGR of 2.06% during 2026-2034. Expanding demand from the electronics and electric vehicle soldering sector, growth in renewable energy infrastructure requiring tin-based solder connections, rising tin-plated steel consumption in the food and beverage packaging industry, and sustained industrial manufacturing activity across Midwest and Southern industrial corridors are the primary growth catalysts.
Market Snapshot
|
Metric |
Value |
|
Market Size (2025) |
92.7 Kilo Tonnes |
|
Forecast Market Size (2034) |
112.1 Kilo Tonnes |
|
CAGR (2026-2034) |
2.06% |
|
Base Year |
2025 |
|
Historical Period |
2020-2025 |
|
Forecast Period |
2026-2034 |
The Midwest leads regionally with a 32.7% market share in 2025, anchored by the region's dense concentration of electronics manufacturing, automotive assembly, and industrial soldering operations across Michigan, Ohio, and Illinois. Metal tin commands the dominant product type share at 58.4%, while soldering represents the leading application at 46.8%, reflecting tin's indispensable role as the base metal in lead-free solder alloys used across printed circuit board assembly and electronic component manufacturing nationwide.
To get more information on this market, Request Sample
The United States tin market is underpinned by the following structural forces: the accelerating transition to lead-free solder mandated by RoHS compliance across all consumer and industrial electronics manufactured or sold in the US; the growth of electric vehicle and renewable energy infrastructure requiring tin-rich solder joints in battery management systems, photovoltaic cell interconnects, and power electronics; and the food and beverage packaging industry's continued reliance on electrolytic tinplate for corrosion-resistant can manufacturing serving the US's large processed food sector.
Executive Summary
The United States tin market demonstrates steady, structurally supported growth across its forecast period. The market was valued at 92.7 Kilo Tonnes in 2025 and is forecast to reach 112.1 Kilo Tonnes by 2034 at a CAGR of 2.06%. The US is entirely dependent on imported tin as domestic tin mining ceased decades ago, making import availability, London Metal Exchange (LME) pricing, and US trade policy the primary supply-side variables shaping market dynamics.
Metal tin dominates the product type segment at 58.4% in 2025, representing refined primary tin and secondary recycled tin consumed as a raw material input for solder paste production, electrolytic tinplating lines, bronze and pewter alloy manufacturing, and specialty organotin chemical synthesis. Soldering leads application at 46.8%, driven by the US's position as the world's largest electronics consumer market and a major PCB assembly and electronics manufacturing hub.
Key Market Insights
|
Insight |
Data |
| Largest Product Type |
Metal – 58.4% share (2025) |
| Fastest Growing Product Type |
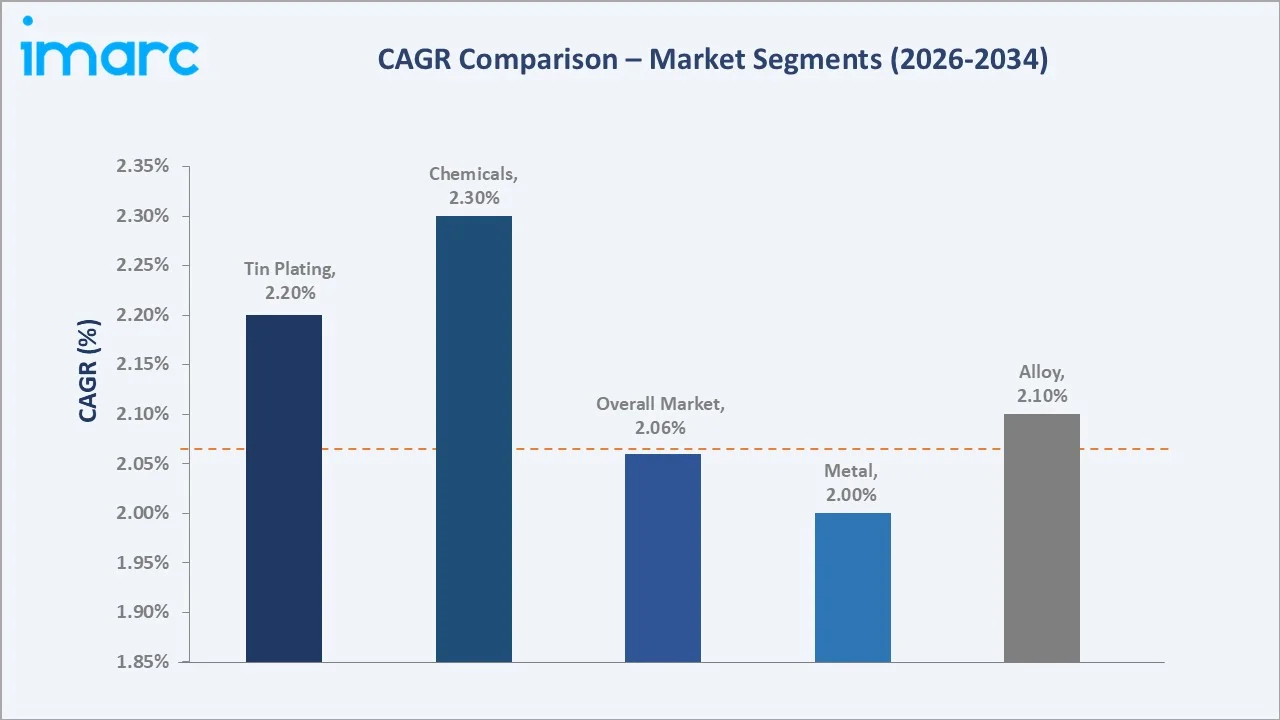
Alloy – ~2.1% CAGR (2026-2034) |
| Largest Application |
Soldering – 46.8% share (2025) |
| Fastest Growing Application |
Chemicals – ~2.3% CAGR (2026-2034) |
|
Leading Region |
Midwest – 32.7% share (2025) |
|
Top Companies |
PT TIMAH Tbk, Malaysia Smelting Corporation Berhad, Indium Corporation, YUNNAN TIN COMPANY GROUP LIMITED |
Key Analytical Observations Supporting The Above Data:
- Metal tin accounts for 58.4% of US tin consumption in 2025, representing refined primary tin purchased by US solder manufacturers, tin plating processors, and bronze alloy producers as a direct input.
- Soldering's 46.8% application dominance (2025) reflects the electronics industry's structural dependence on tin as the base metal of lead-free solder alloys required under RoHS (Restriction of Hazardous Substances) Directive compliance. Lead-free SAC and SnCu alloys contain 95.5–99.3% tin by weight, making each kilogram of lead-free solder virtually equivalent in tin content to a kilogram of pure metal.
- The Midwest's 32.7% regional leadership (2025) reflects the concentration of US electronics contract manufacturing, automotive electronics assembly, and industrial manufacturing in the Great Lakes industrial belt. Michigan's automotive electronics sector and Illinois's industrial equipment and HVAC manufacturing collectively consume the largest single-state-cluster volume of tin-based solder and tin-plated materials in the US.
- The 2.06% CAGR represents a moderate growth profile reflecting tin's mature market position in legacy applications offset by growth in electronics soldering volume driven by increasing electronics content per vehicle, expanding IoT device manufacturing, and growing US solar and wind energy installation requiring tin-soldered photovoltaic cells and power electronics.
United States Tin Market Overview
Tin is a soft, silvery-white post-transition metal extracted from the mineral cassiterite through smelting and refining to produce primary refined tin of 99.85–99.99% purity for industrial use. In the United States, tin is classified as a critical mineral by the US Geological Survey and the Department of Energy, reflecting the country's complete dependence on imported supply for a metal with no domestic primary mining production and significant strategic importance to defense electronics, semiconductor packaging, and clean energy infrastructure.
The US tin market encompasses three product forms serving four primary end-use sectors: electronics and semiconductor manufacturing (the largest and fastest-growing consumer through soldering), food and industrial packaging (electrolytic tinplate), industrial manufacturing (bearings, coatings, and specialty materials), and chemical manufacturing (PVC stabilizers, glass coatings, biocides, and catalysts).
Market Dynamics
To evaluate market opportunities, Request Sample
Market Drivers
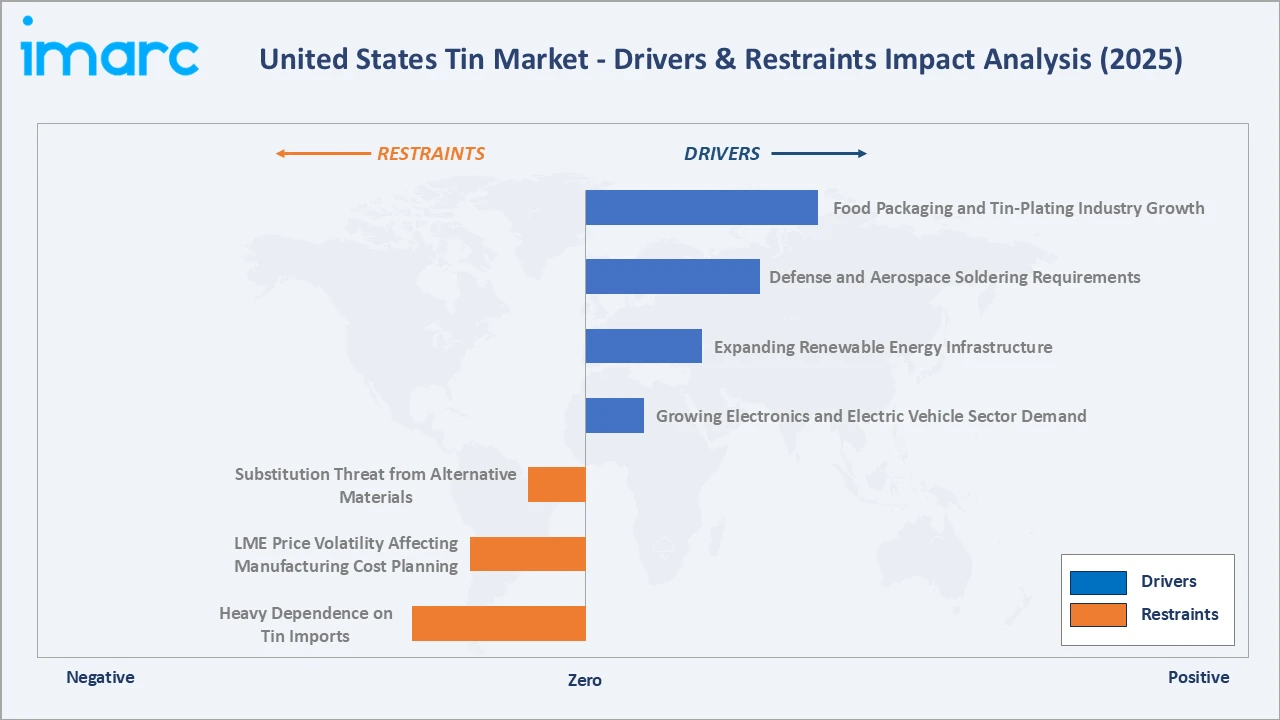
- Growing Electronics and Electric Vehicle Sector Demand: The US electronics manufacturing and EV sector is the primary growth driver for tin consumption, with the transition to lead-free soldering under RoHS compliance and the expanding electronics content of modern vehicles collectively driving above-average tin demand growth.
- Expanding Renewable Energy Infrastructure: US solar photovoltaic installation is growing at 20–25% annually under IRA incentives, with each megawatt of installed solar capacity requiring approximately 0.5 tonnes of tin in tabbing and bussing ribbon solder that connects individual solar cells into modules. The US wind energy sector's nacelle and control electronics also require tin-based solder for electronic assembly.
- Defense and Aerospace Soldering Requirements: The US defense electronics sector continues to consume both lead-free and tin-lead solder, with defense electronics procurement growing under expanding US defense budgets. The DoD's selective exemption from lead-free solder mandates for high-reliability military applications maintains a structural demand base for tin-lead alloys in defense avionics, missile guidance systems, and naval electronics.
- Food Packaging and Tin-Plating Industry Growth: The U.S. can manufacturing industry produces an estimated 131.6 billion food, beverage, aerosol, and general-line cans annually, contributing approximately USD 15.7 billion in direct economic activity. Each requires a thin electrolytic tinplate coating that provides the corrosion resistance essential for multi-year shelf-stable food preservation.
Market Restraints
- Heavy Dependence on Tin Imports: The United States has not operated a commercially viable tin mine since the 1990s, leaving the country entirely dependent on refined tin imports from Indonesia, Peru, Bolivia, Malaysia, and China for 100% of primary tin supply.
- LME Price Volatility Affecting Manufacturing Cost Planning: Tin trades on the London Metal Exchange at prices ranging from USD 16,000 to USD 36,000 per metric tonne over the 2020–2025 period, a 2.25x price range that creates significant manufacturing cost uncertainty for US solder manufacturers, electronics contract manufacturers, and tinplate coaters who purchase tin as a primary input.
- Substitution Threat from Alternative Materials: In food packaging, aluminum can growth, driven by beverage can market expansion and aluminum's higher recycling rate versus tinplate steel, is gradually reducing the food can addressable market for tinplate. In electronics, the development of lead-free solder alloys with reduced tin content may reduce per-board tin consumption in next-generation electronics packaging.
Market Opportunities
- CHIPS Act Semiconductor Manufacturing Expansion: The USD 52 Billion CHIPS and Science Act is funding construction of new semiconductor wafer fabrication facilities (fabs) across Arizona, Ohio, and New York that will require tin in advanced flip-chip and 3D packaging solder interconnects, wafer-level chip scale packaging (WLCSP), and through-silicon via (TSV) interconnect applications.
- Tin Recycling and Secondary Supply Development: The US tin recycling rate is an underdeveloped segment relative to other industrial metals. Only approximately 15–20% of US tin consumption is currently met by secondary (recycled) tin, versus 25–30% in Europe.
- Advanced Tin Alloy Development for High-Reliability Electronics: The electronics industry's transition to automotive-grade (AEC-Q100), industrial-grade, and high-power electronics requires solder alloys with superior reliability under thermal cycling, vibration, and elevated temperature operation versus standard SAC305 alloy.
Market Challenges
- Critical Mineral Supply Chain Security Policy Uncertainty: While the USGS designation of tin as a critical mineral has created policy attention, the lack of a funded domestic tin supply program (no strategic stockpile, no domestic mining incentive comparable to the IRA's battery mineral provisions) leaves US manufacturers exposed to supply chain disruption risk.
- Lead-Free Soldering Reliability in Extreme Environments: Tin whisker growth remains an unresolved reliability challenge in lead-free electronics, particularly for high-reliability military, aerospace, and medical device applications. Managing tin whisker risk requires additional process controls, mitigation coatings, and design countermeasures that add cost and complexity to US electronics manufacturing, and the liability implications of tin whisker failures in safety-critical applications continue to drive military and medical electronics manufacturers toward lead-tin solder exemptions that limit the addressable market for lead-free tin alloys.
Emerging Market Trends
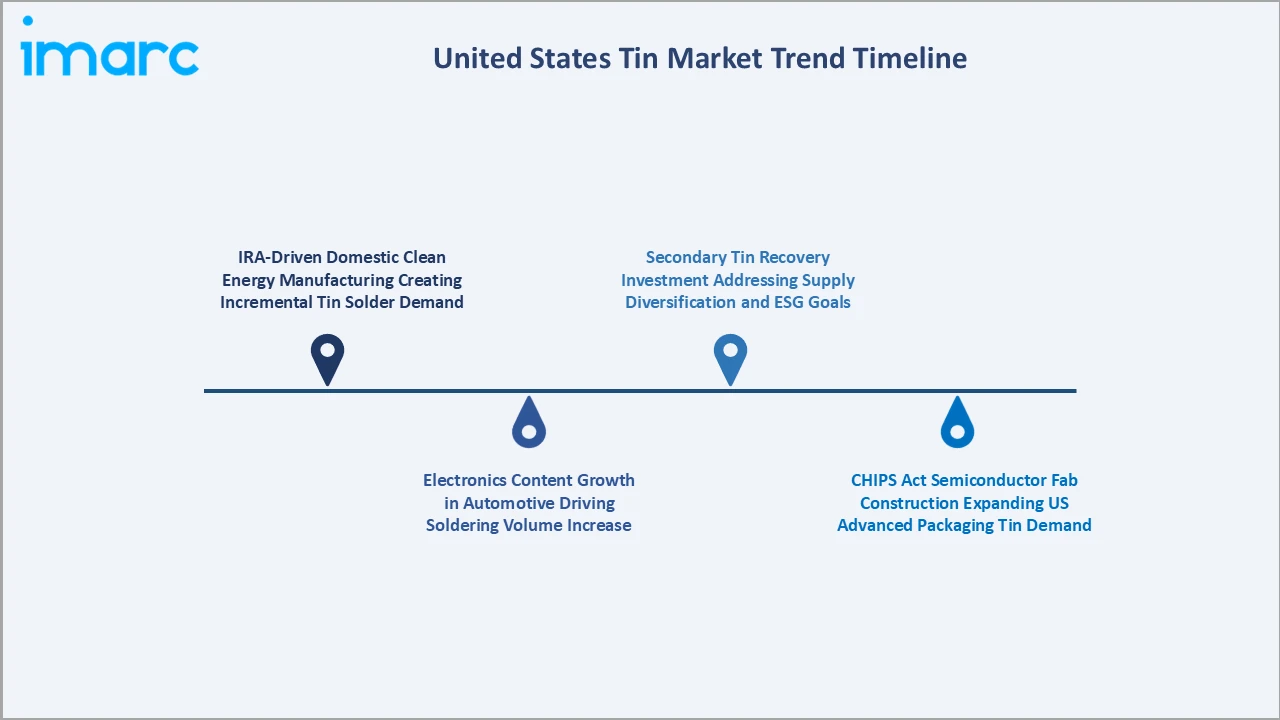
1. IRA-Driven Domestic Clean Energy Manufacturing Creating Incremental Tin Solder Demand
The Inflation Reduction Act's domestic manufacturing incentives for solar panels, EV batteries, and wind turbines are stimulating US-based production of clean energy components that require tin-based solder in module assembly. First Solar's USD 1.2 Billion Ohio fab expansion, Nextracker's US solar mounting system manufacturing, and announced US EV battery gigafactories from Tesla, Panasonic, and Samsung SDI collectively represent a multi-year capital deployment program that will create new domestic tin consumption centers outside the traditional Midwest and South manufacturing corridors.
2. Electronics Content Growth in Automotive Driving Soldering Volume Increase
The electronics content of new automobiles has increased from approximately USD 3,000 per vehicle in 2015 to over USD 8,000 per vehicle in 2025, reflecting the adoption of ADAS (Advanced Driver Assistance Systems), EV powertrain control electronics, infotainment systems, and V2X communication hardware. Each additional circuit board in a vehicle represents hundreds of tin-soldered connections, and the transition to 800V EV architecture requiring high-voltage SiC power module assembly is increasing the tin solder volume per vehicle significantly.
3. CHIPS Act Semiconductor Fab Construction Expanding US Advanced Packaging Tin Demand
TSMC's USD 40 Billion Arizona fab complex and Intel's USD 28 Billion Ohio One Campus are among the largest semiconductor manufacturing investments in US history. Advanced packaging technologies deployed at these fabs, including fan-out wafer-level packaging (FOWLP), chip-on-wafer-on-substrate (CoWoS), and 3D stacking using microbumps and through-silicon vias, use tin-silver solder at pitches below 100 microns.
4. Secondary Tin Recovery Investment Addressing Supply Diversification and ESG Goals
US electronics recyclers and secondary metals processors are investing in hydrometallurgical and pyrometallurgical technologies to recover tin from PCB scrap, spent solder dross, and post-consumer electronics waste streams. The value of tin at USD 25,000–30,000 per tonne makes secondary recovery economically viable at scale, and the ESG supply chain requirements of major electronics OEMs mandating responsible mineral sourcing are creating commercial incentives for US secondary tin supply development.
Industry Value Chain Analysis
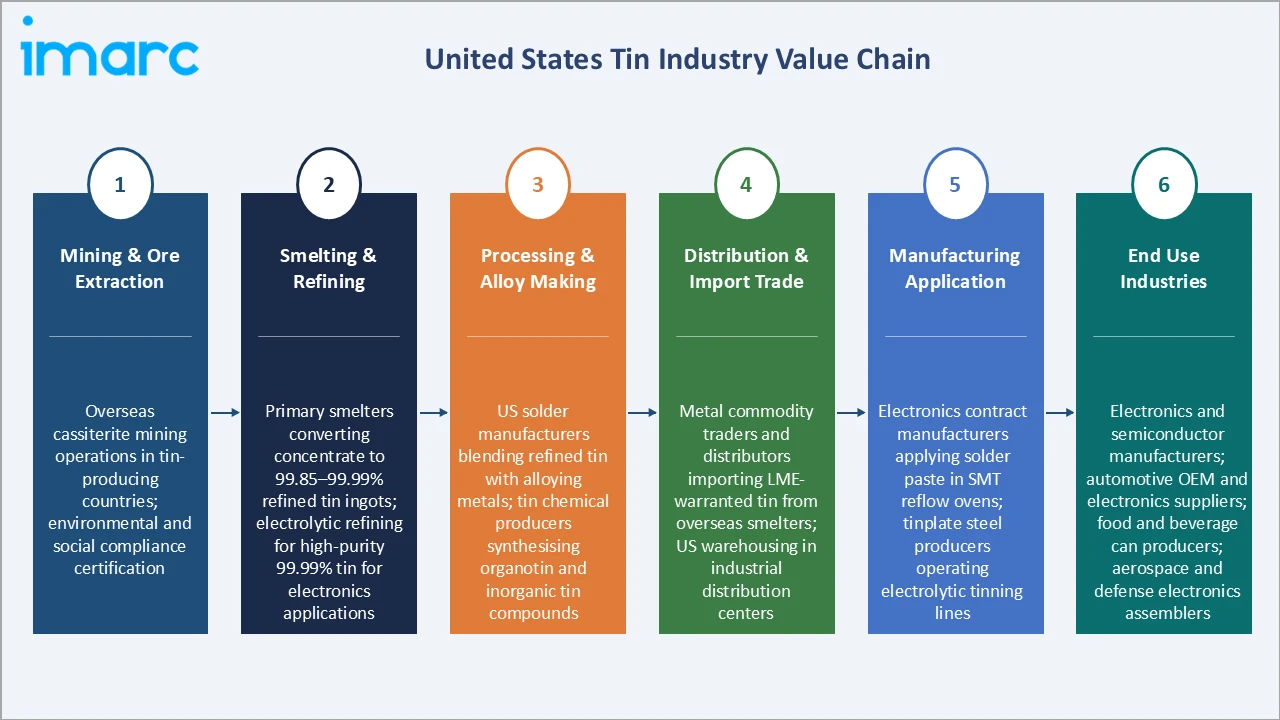
The US tin market value chain spans overseas primary mining through domestic end-use manufacturing, with the critical import dependency step occurring between overseas smelting and US distribution — the market's primary supply chain risk node.
|
Stage |
Key Players / Examples |
| Mining & Ore Extraction |
Overseas cassiterite mining operations in tin-producing countries; environmental and social compliance certification |
| Smelting & Refining |
Primary smelters converting concentrate to 99.85–99.99% refined tin ingots; electrolytic refining for high-purity 99.99% tin for electronics applications |
| Processing & Alloy Making |
US solder manufacturers blending refined tin with alloying metals; tin chemical producers synthesising organotin and inorganic tin compounds |
| Distribution & Import Trade |
Metal commodity traders and distributors importing LME-warranted tin from overseas smelters; US warehousing in industrial distribution centers |
| Manufacturing Application |
Electronics contract manufacturers applying solder paste in SMT (surface mount technology) reflow ovens; tinplate steel producers operating electrolytic tinning lines |
| End Use Industries |
Electronics and semiconductor manufacturers; automotive OEM and electronics suppliers; food and beverage can producers; aerospace and defense electronics assemblers |
Technology Landscape in the United States Tin Industry
Lead-Free Solder Alloy Technology
Lead-free solder alloy technology has been the most transformative development in the US tin market over the past two decades, shifting the dominant application from tin-lead eutectic solder to SAC305 as the industry standard for commercial electronics. SAC305's higher tin content (96.5% versus 63% in tin-lead) per kilogram of solder increases tin consumption per circuit board assembled a structural market-positive effect.
Electrolytic Tinning Technology
Electrolytic tinplating, applying thin tin coatings of 1.1–8.4 grams per square meter onto cold-rolled steel strip using electrodeposition from stannous sulphate or methane sulphonic acid (MSA) electrolyte baths, is the primary technology for producing tinplate for food can manufacturing. US tinplate producers have invested in MSA-based tinning electrolytes that enable faster line speeds, more consistent coating weight distribution, and lower environmental impact versus older sulphate systems.
Advanced Semiconductor Packaging Solder Applications
The semiconductor industry's transition from wire-bonding to flip-chip and advanced 3D packaging interconnects has created a high-value, technically sophisticated tin application segment. Tin-silver solder bumps deposited at pitches below 150 microns connect die to substrate in advanced IC packages. The transition to hybrid bonding for the most advanced chip-to-chip connections replaces solder bumps with direct copper-to-copper bonds at pitches below 10 microns, but for the mainstream flip-chip and WLCSP packages dominating volume production, tin-silver solder remains the dominant interconnect material.
Tin Recycling and Secondary Recovery Technology
Hydrometallurgical tin recovery from e-waste and solder dross is an emerging technology area for US secondary tin supply development. Pyrometallurgical processing has been the traditional secondary tin recovery route, but hydrometallurgical methods offer higher tin recovery rates, lower energy consumption, and the ability to simultaneously recover valuable by-products (silver, copper, indium) from complex e-waste feedstocks.
Market Segmentation Analysis
The report covers the following segments:
|
Segment Category |
Leading Segment |
Market Share |
Year |
|
Product Type |
Metal |
58.4% |
2025 |
|
Application |
Soldering |
46.8% |
2025 |
| End Use Industry | 🔒 |
🔒 |
2025 |
|
Region |
Midwest |
32.7% |
2025 |

By Product Type
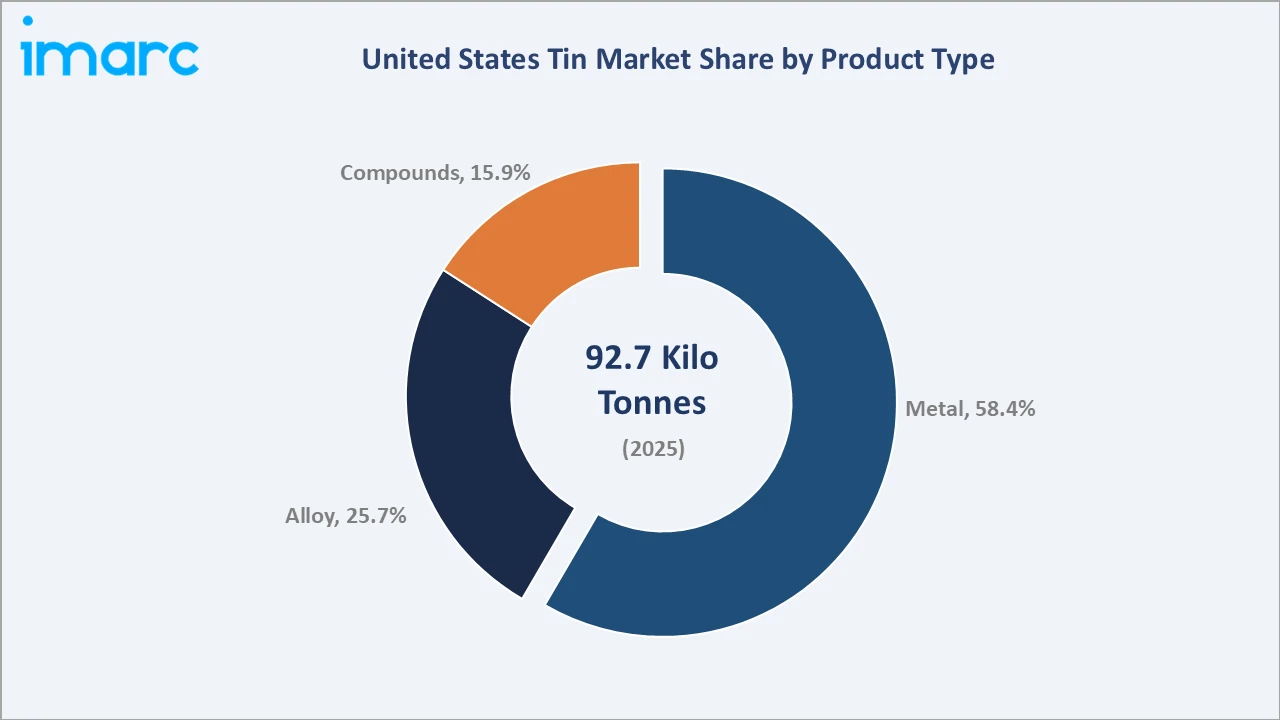
The product type segment is led by metal (58.4%), followed by alloy (25.7%), and compounds (15.9%). Metal tin commands the largest share as the primary raw material input for all downstream processing, while alloys represent the processed form consumed directly in electronics soldering and industrial manufacturing applications.
To access detailed market analysis, Request Sample
Alloys represent the fastest-growing product form as electronics manufacturers increasingly purchase pre-alloyed SAC solder paste and bar from specialist solder suppliers rather than blending in-house, shifting the value-add step from end-user to solder manufacturer and reducing metal tin's direct share. Compounds encompass dibutyltin and dioctyltin stabilisers for PVC, tin oxide coatings for glass, and organotin biocides for marine antifouling paints.
By Application
The application segment is led by soldering (46.8%), followed by tin plating (29.4%), chemicals (13.7%), and others (10.1%). Soldering dominates as the highest-growth application driven by electronics manufacturing expansion and lead-free solder adoption, while Tin Plating provides a stable, high-volume base load from the food packaging industry.
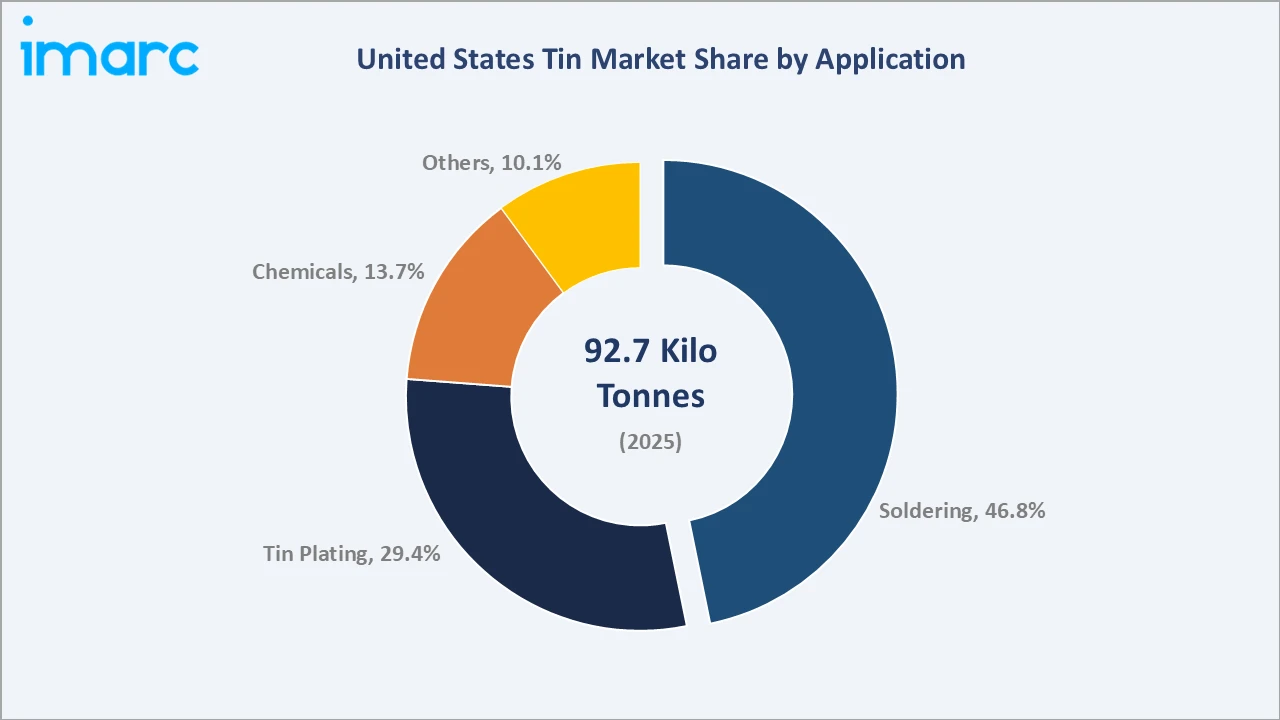
Tin plating serves the food and beverage packaging industry's production of electrolytic tinplate for steel food cans, with steel food cans requiring electrolytic-grade tin for coating application. Chemicals at 13.7% cover PVC stabilizer, glass coating, and specialty chemical applications that are relatively stable volume consumers.
Regional Market Insights
The Midwest's 32.7% US tin market leadership in 2025 is anchored by the automotive electronics ecosystem concentrated in Michigan's Detroit metropolitan area and Ohio's manufacturing corridor. Major automotive OEM plants and their Tier 1 and Tier 2 electronics suppliers collectively operate hundreds of SMT solder assembly lines consuming tin-based lead-free solder in high volumes for vehicle electronic control unit (ECU), infotainment, ADAS, and EV powertrain assembly.
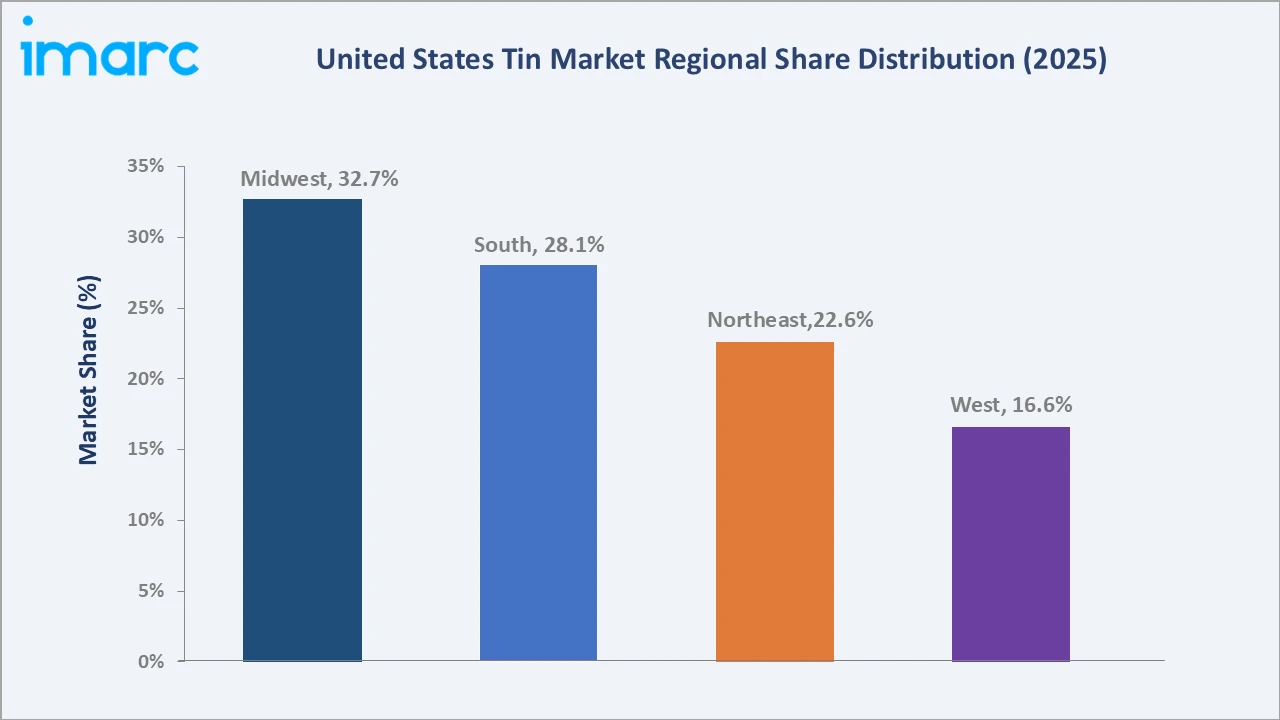
The South is the US tin market's highest-growth region, driven by the concentration of semiconductor and electronics manufacturing investment in Texas, Tennessee, North Carolina, and Georgia. The Gulf Coast petrochemical corridor in Texas and Louisiana is a significant consumer of organotin compounds used as PVC heat stabilizers in polymer processing applications.
|
Region |
Share (2025) |
Key Growth Drivers |
| Midwest |
32.7% |
Dense electronics and automotive electronics manufacturing; automotive OEM and Tier 1 supplier soldering operations; industrial equipment manufacturing |
|
South |
28.1% |
Expanding semiconductor and electronics manufacturing; growing EV battery gigafactory and EV assembly plant soldering demand; Gulf Coast chemical manufacturing consuming tin compounds |
| Northeast |
22.6% |
Defense and aerospace electronics manufacturing; CHIPS Act semiconductor fab investment in New York; specialty solder and tin chemicals manufacturing; high-technology printed circuit board assembly |
| West |
16.6% |
TSMC and Intel semiconductor fab construction in Arizona driving advanced packaging tin demand; California electronics and EV technology company PCB assembly; solar panel manufacturing requiring tin solder ribbon |
Competitive Landscape
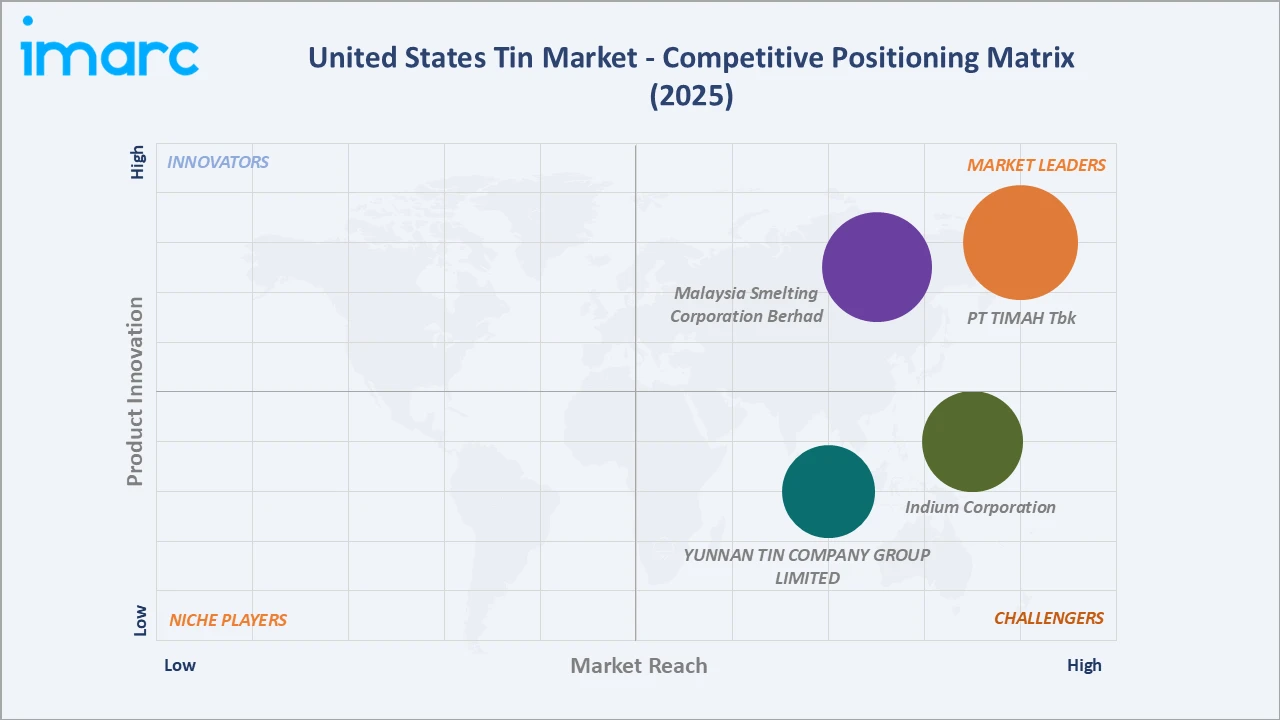
The US tin market's competitive structure is unique among industrial metals: the US has no domestic primary tin producers, making the competitive landscape defined by overseas smelters supplying the US market through direct imports, US-based solder manufacturers and specialty processors that add value to imported refined tin, and secondary recyclers recovering tin from domestic scrap streams.
|
Company Name |
Solutions/Product |
Market Position |
Core Strength |
| PT TIMAH Tbk | Tin Ingot, Tin Solder, Tin Chemical |
Market Leader |
One of the world's largest integrated tin miners and smelters; LME-registered tin brands; comprehensive grade range from standard to 4N purity |
| Malaysia Smelting Corporation Berhad |
Tin Mining, Tin Smelting. Tin Metal Trading |
Market Leader |
LME-registered MSC brand; high-purity and specialty tin for electronics; established US distribution relationships |
| Indium Corporation |
High-Purity Tin in Ingot, Shot, Powder, Sphere, Wire, Tubing, among others |
Strong Challenger |
Specialty solder manufacturer; SAC and low-temperature alloy innovation leadership; semiconductor packaging solder expertise; closed-loop solder recycling |
| YUNNAN TIN COMPANY GROUP LIMITED |
High Purity Tin, Tin Ingot, Solder Ingot |
Challenger |
Broad product range from standard to specialty grades; competitive pricing for US importers; vertically integrated from mine to finished product |
International primary smelters compete for US import market share through LME-registered brand quality, pricing relative to LME cash price, and delivery reliability. US-based value-added processors compete on alloy formulation capability, technical support, and supply chain service levels rather than on primary metal cost.
Key Company Profiles
PT TIMAH Tbk
PT TIMAH Tbk is one of the world's largest integrated tin mining and smelting companies and Indonesia's primary state-owned tin enterprise. The company produces refined tin from both onshore hard rock and offshore dredge mining operations.
- Product Portfolio: Tin ingot, tin solder, and tin chemical enabling delivery against LME contracts; specialty tin for electronics and semiconductor applications.
- Recent Developments: In April 2026, PT TIMAH recorded IDR 5.47 trillion in revenue and IDR 1.5 trillion in net profit during Q1 2026, driven by higher tin prices and sales volumes. Tin ore production rose 96% to 6,312 tonnes, while refined tin sales increased 113% to 6,009 tonnes.
- Strategic Focus: Production efficiency improvement across Bangka Island mining operations; high-purity tin development for premium electronics market; downstream integration into tin chemicals and solder products; ESG certification to meet US and European responsible sourcing requirements.
Malaysia Smelting Corporation Berhad
Malaysia Smelting Corporation Berhad is one of Southeast Asia's leading tin smelting and refining companies that produces LME-registered refined tin for global markets including the US.
- Product Portfolio: Refined tin ingots; high-purity tin; specialty tin alloys; secondary refined tin from e-waste and scrap processing; tin chemicals; toll smelting services for third-party concentrate holders.
- Recent Developments: In May 2026, Malaysia Smelting Corporation Berhad’s first-quarter 2026 net profit surged more than fivefold to MYR 42.9 million, while revenue increased 24% to MYR 457.0 million. The strong performance, driven by higher tin prices and improved mining and smelting operations, pushed the company’s shares to a record high.
- Strategic Focus: Secondary tin and e-waste processing capacity expansion; premium pricing through sustainable sourcing certification; US and European market access through quality-certified LME-registered brands; downstream alloy and specialty product development.
Market Concentration Analysis
The US tin supply market is highly concentrated at the primary refined metal level, with three countries, Indonesia, Peru, and Bolivia, accounting for approximately 60–70% of US refined tin imports by volume. At the downstream processing and value-added level, the US tin market is moderately fragmented.
Indium Corporation holds a strong position in the specialty high-reliability solder market, while multinational solder manufacturers serve the mainstream electronics SMT solder market with commodity SAC alloys. The electrolytic tinplate market is concentrated among steel producers operating tinning lines supplying the food can industry directly under long-term contracts.
Investment & Growth Opportunities
Fastest Growing Segments
Advanced semiconductor packaging tin solder (CHIPS Act-driven fab construction); EV and renewable energy power electronics soldering (~4–5% CAGR within soldering segment); specialty high-reliability solder alloys for automotive-grade AEC-Q100 applications; and tin chemical compounds for emerging applications (SnO2 transparent electrodes, perovskite solar cell hole transport layers) represent the highest-value investment vectors within the overall US tin market through 2034.
Emerging Market Expansion
The West, currently the smallest US regional tin market at 16.6%, is positioned for the fastest relative growth driven by TSMC Arizona's two-fab complex (combined capacity 600,000 wafers per year when fully ramped) and California's EV technology and clean energy manufacturing base.
Venture and Institutional Investment Trends
- The USGS Critical Minerals Program and DOE Loan Programs Office are funding research into domestic tin resource assessment, advanced tin recovery from domestic mine tailings, and secondary tin recycling technology development, creating a policy-backed investment environment for US tin supply diversification that reduces import dependency over the 2025–2034 period.
- Specialty solder alloy developers targeting the automotive, aerospace, and medical device electronics markets command premium valuations relative to commodity solder manufacturers, reflecting the higher margins and longer-term customer qualification relationships in high-reliability applications.
Future Market Outlook (2026-2034)
The United States tin market is positioned for steady growth through 2034. From a base of 92.7 Kilo Tonnes in 2025, the market is projected to reach 112.1 Kilo Tonnes by 2034 at a CAGR of 2.06%, representing total incremental volume growth of 19.4 Kilo Tonnes. This moderate but consistent growth reflects tin's mature market position in traditional applications tempered by above-average growth in electronics and clean energy soldering applications.
By 2034, electronics and EV soldering are expected to increase their share of total US tin consumption from 46.8% to an estimated 52–55% as food can tin plating demand grows more slowly than electronics soldering. The West will gain regional market share as CHIPS Act semiconductor fabs ramp to full production, and Arizona becomes a major advanced electronics manufacturing center.
Research Methodology
Primary Research
Primary research comprised structured interviews with over 65 industry participants in 2024–2025, including US solder manufacturers, electronics contract manufacturers, steel tinplate producers, tin commodity traders and distributors, specialty chemical manufacturers, USGS critical minerals analysts, and electronics recycling operators across the Midwest, South, Northeast, and West regions.
Secondary Research
Secondary research encompassed USGS Mineral Commodity Summaries tin consumption and import data, US Census Bureau import statistics for refined tin (HTS 8001.10 and 8001.20), ITC trade data for tin alloys and tin chemicals, International Tin Association (ITA) global production and consumption statistics, LME tin price and warehouse inventory data, USDC CHIPS Act semiconductor investment tracking, EPA tin recycling and e-waste statistics, and financial disclosures.
Forecasting Models
Market size estimations were derived using top-down and bottom-up forecasting, incorporating USGS historical US tin consumption data by end-use sector, electronics PCB production volume forecasts, automotive electronics content growth projections, US food can production volume trends, CHIPS Act fab construction and ramp timelines, and IRA clean energy installation forecasts.
United States Tin Market Report Coverage:
| Report Features | Details |
|---|---|
| Base Year of the Analysis | 2025 |
| Historical Period | 2020-2025 |
| Forecast Period | 2026-2034 |
| Units | Kilo Tonnes |
| Scope of the Report | Exploration of Historical and Forecast Trends, Industry Catalysts and Challenges, Segment-Wise Historical and Predictive Market Assessment:
|
| Product Types Covered | Metal, Alloy, Compounds |
| Applications Covered | Soldering, Tin Plating, Chemicals, Others |
| End Use Industries Covered | Automotive, Electronics, Packaging (Food and Beverages), Glass, Others |
| Regions Covered | Northeast, Midwest, South, West |
| Companies Covered | PT TIMAH Tbk, Malaysia Smelting Corporation Berhad, Indium Corporation, YUNNAN TIN COMPANY GROUP LIMITED, etc. |
| Customization Scope | 10% Free Customization |
| Post-Sale Analyst Support | 10-12 Weeks |
| Delivery Format | PDF and Excel through Email (We can also provide the editable version of the report in PPT/Word format on special request) |
Key Benefits for Stakeholders:
- IMARC’s report offers a comprehensive quantitative analysis of various market segments, historical and current market trends, market forecasts, and dynamics of the United States tin market from 2020-2034.
- The research study provides the latest information on the market drivers, challenges, and opportunities in the United States tin market.
- Porter's five forces analysis assist stakeholders in assessing the impact of new entrants, competitive rivalry, supplier power, buyer power, and the threat of substitution. It helps stakeholders to analyze the level of competition within the United States tin industry and its attractiveness.
- Competitive landscape allows stakeholders to understand their competitive environment and provides an insight into the current positions of key players in the market.
Frequently Asked Questions About the United States Tin Market Report
The United States tin market reached 92.7 Kilo Tonnes in 2025 and is projected to reach 112.1 Kilo Tonnes by 2034.
The market is expected to grow at a CAGR of 2.06% during 2026-2034, driven by electronics and EV soldering demand growth, renewable energy infrastructure expansion, CHIPS Act semiconductor manufacturing investment, and stable food packaging tin plating demand.
The Midwest leads with a 32.7% market share in 2025, driven by the region's dense concentration of automotive electronics, industrial manufacturing, and steel tinplate production in the Great Lakes industrial corridor across Michigan, Ohio, and Illinois.
Metal tin dominates with a 58.4% share in 2025, representing refined primary and secondary tin consumed as a raw material input by US solder manufacturers, electrolytic tinning line operators, and alloy producers. All US metal tin is sourced from overseas primary smelters and domestic secondary recyclers.
Soldering holds the largest application share at 46.8%, driven by the US electronics manufacturing industry's reliance on lead-free SAC solder alloys (95.5–99.3% tin by weight) for PCB assembly, semiconductor packaging, and electronic component attachment across consumer, automotive, defense, and industrial electronics sectors.
Key players include PT TIMAH Tbk, Malaysia Smelting Corporation Berhad, Indium Corporation, and YUNNAN TIN COMPANY GROUP LIMITED.
Key drivers include growing electronics and EV sector lead-free soldering demand, IRA-driven renewable energy infrastructure expansion requiring tin solder, CHIPS Act semiconductor fab investment creating advanced packaging tin demand, food and beverage packaging tin plating industry stability, and defense and aerospace soldering requirement growth.
Key challenges include complete dependence on tin imports with no domestic mining production, LME price volatility creating manufacturing cost uncertainty, substitution of tin in some food packaging applications by aluminum, and geopolitical supply chain risk from concentration of primary tin production in Indonesia, Peru, and Bolivia.
Need more help?
- Speak to our experienced analysts for insights on the current market scenarios.
- Include additional segments and countries to customize the report as per your requirement.
- Gain an unparalleled competitive advantage in your domain by understanding how to utilize the report and positively impacting your operations and revenue.
- For further assistance, please connect with our analysts.
 Request Customization
 Speak to an Analyst
 Request Brochure
 Inquire Before Buying
Benefits of Customization
- Personalize this research
- Triangulate with your data
- Get data as per your format and definition
- Gain a deeper dive into a specific application, geography, customer, or competitor
- Any level of personalization
Get in Touch With Us
UNITED STATES
Phone: +1-201-971-6302
INDIA
Phone: +91-120-433-0800
UNITED KINGDOM
Phone: +44-753-714-6104
Email: [email protected]
Client Testimonials




.webp)




.webp)













Related Reports

Choose your plan
*Please note that the prices mentioned below are starting prices for each bundle type. Kindly contact our team for further details.*
Single User License
- 1 User License, Access on 2 Devices
- PDF Report + Excel Dataset (Password Protected)
- Lifetime Access
- No Printing Rights
- 10% Free Report Customization
- 10–12 Weeks of Analyst Support
Five User License
- Access for 5 Users, 2 Devices per User
- PDF Report + Excel Dataset (Password Protected)
- Lifetime Access
- Dedicated Account Manager
- 12–14 Weeks of Analyst Support
- No Printing Rights
- 15% Free Report Customization
- 25% Discount on Your Next Purchase
Corporate User License
- Unlimited User Access (Within Your Organization)
- PDF Report + Excel Dataset
- Lifetime Access
- Dedicated Account Manager
- 14–20 Weeks of Analyst Support
- No Printing Rights
- 20% Free Report Customization
- 30% Discount on Your Next Purchase
Essential Insights
What's included:
3 reports
- Lifetime Access
- PDF Reports
- Excel Datasets
- 2 Weeks of Free Analyst Support
- 2 User Licenses
- Access on 2 Devices
- Printing Rights
- Complimentary PowerPoint (PPT) Version
- Complimentary License Upgrade
Professional Access
What's included:
5 reports
- Lifetime Access
- PDF Reports
- Excel Datasets
- 8 Weeks of Free Analyst Support
- 2 User Licenses
- Access on 2 Devices
- Printing Rights
- Complimentary PowerPoint (PPT) Version
- Complimentary License Upgrade
Business Advantage
What's included:
8 reports
- Lifetime Access
- PDF Reports
- Excel Datasets
- 14 Weeks of Free Analyst Support
- 2 User Licenses
- Access on 2 Devices
- Printing Rights
- Complimentary PowerPoint (PPT) Version
- Complimentary License Upgrade
Enterprise Intelligence
What's included:
10 reports
- Lifetime Access
- PDF Reports
- Excel Datasets
- 20 Weeks of Free Analyst Support
- 2 User Licenses
- Access on 2 Devices
- Printing Rights
- Complimentary PowerPoint (PPT) Version
- Complimentary License Upgrade