
India Edible Oil Market Size, Share, Trends and Forecast by Type, Packaging Type, Packaging Material, Pack Size, Domestic Manufacturing/Imports, Application, Distribution Channel, and Region, 2026-2034
India Edible Oil Market Summary:
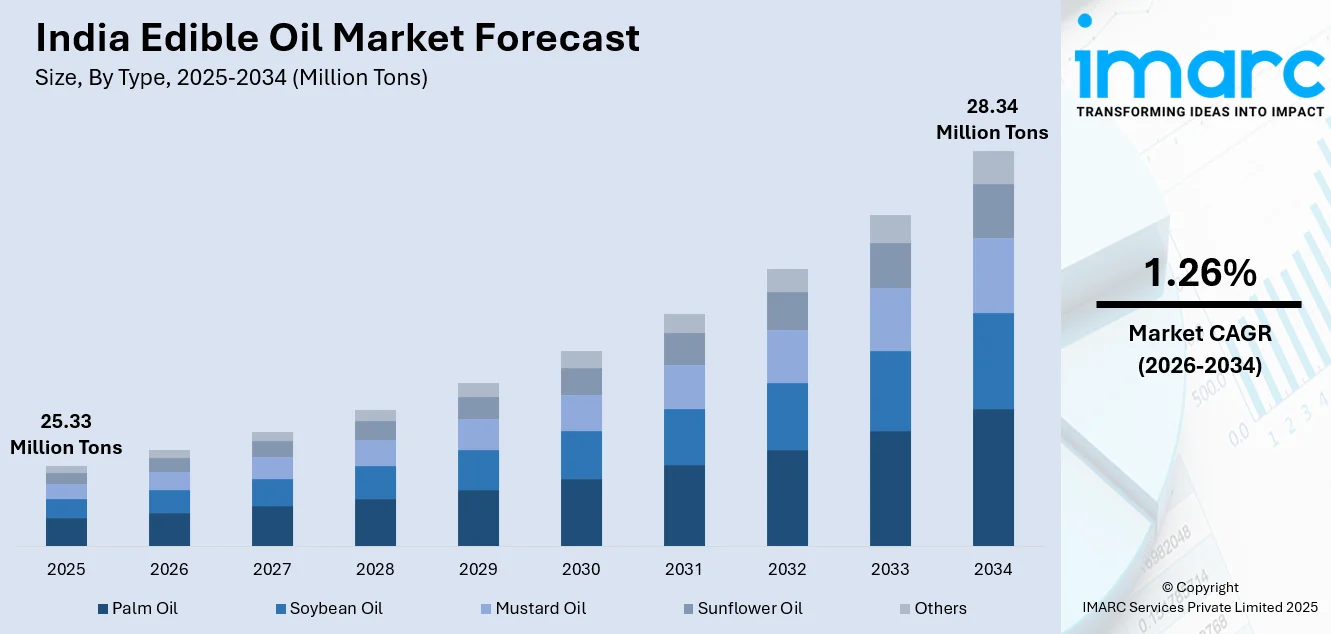
The India edible oil market size reached 25.33 Million Tons in 2025 and is projected to reach 28.34 Million Tons by 2034, growing at a compound annual growth rate of 1.26% from 2026-2034.
The market growth is primarily driven by higher disposable incomes, increasing health awareness among consumers, and rising demand for packaged and branded cooking oils. The robust food processing industry, evolving dietary preferences toward healthier oil alternatives, and robust government support for domestic oilseed cultivation through initiatives such as the National Mission on Edible Oils are contributing significantly to the India edible oil market share. Additionally, the rapid expansion of organized retail channels and e-commerce platforms is transforming distribution dynamics and enhancing product accessibility across urban and rural markets.
Key Takeaways and Insights:
- By Type: Palm oil leads the market with a share of 38% in 2025, due to its cost-effectiveness, extensive use in household cooking, and strong demand from the packaged food and foodservice industries across India.
- By Packaging Type: Pouches represent the largest segment with a market share of 47% in 2025, supported by their affordability, ease of handling, widespread availability in retail stores, and preference among price-sensitive consumers.
- By Packaging Material: Plastic dominates the market with a share of 55% in 2025, because of its lightweight nature, durability during transportation, cost advantages, and suitability for both small- and large-sized edible oil packs.
- By Pack Size: 1 liters-5 liters lead the market with a share of 32% in 2025, reflecting strong household demand for medium-sized packs that balance convenience, storage efficiency, and value-for-money purchasing patterns.
- By Domestic Manufacturing/Imports: Domestic manufacturing represents the largest segment with a market share of 62% in 2025, as India continues expanding refining capacity, improving local processing, and reducing dependence on imported finished edible oils.
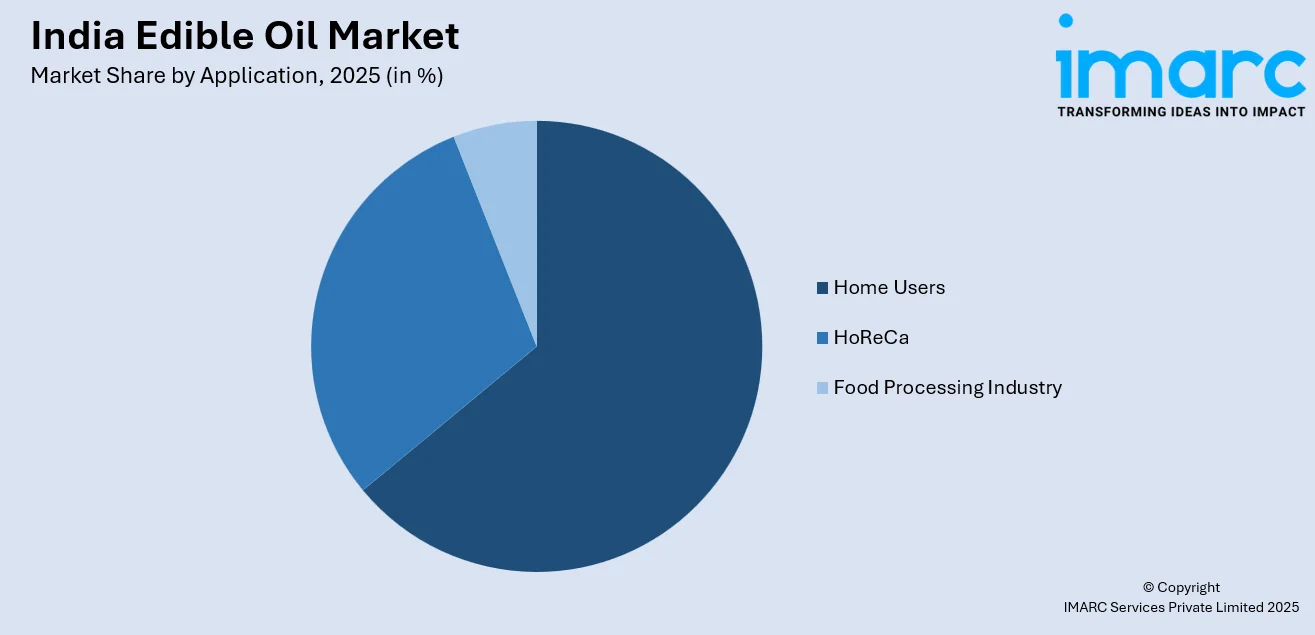
- By Application: Home users dominate the market with a share of 64% in 2025, influenced by the rising urban consumption, daily cooking requirements, increasing health awareness, and higher spending on branded edible oil products.
- By Distribution Channel: Supermarkets and hypermarkets lead the market with a share of 35% in 2025, owing to their ability to offer multiple brands, discounts, bulk purchase options, and a convenient shopping experience for consumers.
- By Region: West and Central India represents the largest segment with a market share of 31% in 2025, driven by high population density, strong retail penetration, greater packaged food consumption, and significant demand from industrial buyers.
- Key Players: The India edible oil market exhibits moderate competitive intensity, with multinational corporations competing alongside regional manufacturers across price segments and distribution channels through extensive brand portfolios. Some of the key players in the market include Adani Group, BCL Industries Ltd., Bunge, Cargill, Incorporated, Emami Agrotech Ltd, Gulab Oil & Foods, Mahesh Edible Oil Industries Limited, Marico Limited, N.K Proteins Pvt Ltd, Patanjali Ayurved Limited, Sanwaria Consumer Limited, and Sundrop Brands Limited.
To get more information on this market Request Sample
The India edible oil market is being driven by the rising household consumption, increasing urbanization, and shifting consumer preferences toward healthier cooking options. Demand is expanding not only through everyday use but also through seasonal spikes during festivals, when cooking volumes increase significantly across households. In addition, consumers are becoming more conscious about balancing indulgence with wellness, encouraging brands to promote fortified and value-added oils. This was reflected in 2025 when VML India launched a festive campaign for Tirupati Edible Oils, highlighting how celebrations often involve heavy indulgence linked with health concerns and guilt. Tirupati positioned its vitamin-fortified oils as a healthier way to enjoy festive foods freely while keeping celebrations happy and wholesome. Such marketing and product positioning are accelerating premiumization and contributing to the market growth.
India Edible Oil Market Trends:
Health Awareness and Premiumization of Edible Oils
There is a shift in the demand from bulk, low-cost products toward oils positioned as healthier and more specialized options, including fortified and premium variants. Consumers are increasingly attentive to nutritional attributes, cholesterol management, and the perceived benefits of improved oil compositions, encouraging brands to differentiate through innovation. This trend was reflected in 2025 when Fishfa Agri World launched PeanutJi Vedic, India’s first high-oleic groundnut oil, combining Vedic purity principles with advanced processing for better health performance and heat stability. Made from specially cultivated high-oleic peanuts and strict quality controls, it offered safer, more stable daily cooking performance. The company positions this as a premium innovation to strengthen its differentiated edible oil portfolio and capture high-growth health-focused segments.
Industry Partnerships Advancing Fortification Standards
Collaborative initiatives to expand fortified edible oils are supporting the market growth by improving nutritional value, regulatory alignment, and consumer confidence. As awareness about micronutrient deficiencies rises, fortification is becoming an important area of product differentiation and public health contribution. Industry-led partnerships help strengthen compliance, quality assurance, and adoption across producers. This was demonstrated in 2025, when the Solvent Extractors' Association of India (SEA) signed an MoU with TechnoServe to enhance edible oil fortification nationwide. The partnership focused on training producers, strengthening quality control, and promoting safe fortification practices consistent with FSSAI standards, supporting voluntary fortification and healthier consumption patterns.
Government Missions Strengthening Domestic Self-Reliance
Policy support aimed at increasing domestic oilseed output is a crucial factor propelling the India edible oil market growth, as it addresses structural import dependence and supply vulnerability. Large-scale government missions encourage higher cultivation, better productivity, and stronger farmer linkages with processing ecosystems. This was reinforced in 2024, when the Union Cabinet approved the National Mission on Edible Oils–Oilseeds (NMEO-Oilseeds) to raise domestic production from 39 MT to 69.7 MT by 2030–31. By promoting high-yield seeds, expanding cultivation, building value chain clusters, and launching the SATHI seed traceability portal, the mission supported self-reliance and sustainable market expansion.
Market Outlook 2026-2034:
The India edible oil market shows notable growth prospects across the forecast period, supported by population growth, rising urbanization, and changing dietary habits. The increasing consumption of packaged and processed foods, along with higher awareness about cooking oil quality is contributing to the market demand. The market size was estimated at 25.33 Million Tons in 2025 and is expected to reach 28.34 Million Tons by 2034, reflecting a compound annual growth rate of 1.26% over the forecast period 2026-2034
India Edible Oil Market Report Segmentation:
| Segment Category | Leading Segment | Market Share |
|---|---|---|
| Type | Palm Oil | 38% |
| Packaging Type | Pouches | 47% |
| Packaging Material | Plastic | 55% |
| Pack Size | 1 Liters - 5 Liters | 32% |
| Domestic Manufacturing/Imports | Domestic Manufacturing | 62% |
| Application | Home Users | 64% |
| Distribution Channel | Supermarkets and Hypermarkets | 35% |
| Region | West and Central India | 31% |
Type Insights:
- Palm Oil
- Soybean Oil
- Mustard Oil
- Sunflower Oil
- Others
Palm oil dominates with a market share of 38% of the total India edible oil market in 2025.
Palm oil leads the market owing to its cost advantage, wide availability, and strong demand across household and industrial applications. It is extensively used in everyday cooking because it remains affordable compared to other edible oils, making it a preferred option for price-sensitive consumers. India’s palm oil consumption has increased to around 38% of the total edible oil consumption, as stated by the Asian Palm Oil Alliance (APOA) in 2024. Additionally, palm oil is a key ingredient in processed foods, snacks, and bakery products, supporting large-scale consumption.
Palm oil also benefits from its versatility and suitability for high-temperature cooking, which aligns well with Indian culinary practices. The oil’s longer shelf life and high yield per hectare make it an efficient choice for producers and refiners. Moreover, the robust foodservice sector, including restaurants and quick-service chains, relies heavily on palm oil for bulk usage due to its consistent quality and cost efficiency. Its stable supply through imports and well-established refining infrastructure further strengthens its leading position in the market.
Packaging Type Insights:
- Pouches
- Jars
- Cans
- Bottles
Pouches lead with a market share of 47% of the total India edible oil market in 2025.
Pouches exhibit a clear dominance in the market attributed to their affordability, convenience, and widespread acceptance among consumers. They are lighter and cheaper to produce than rigid containers, making them an attractive option for manufacturers aiming to keep product prices competitive. Pouches are also easy to transport, store, and handle, especially for urban and semi-urban households that prefer compact packaging. Their availability in small and medium sizes supports frequent purchasing patterns, driving strong demand across retail outlets.
Pouches also appeal to consumers as they offer improved accessibility and require less storage space compared to tins or bottles. Retailers benefit from pouches because they can be displayed efficiently and sold at lower price points, attracting budget-conscious buyers. The growth of organized retail and rising consumption of branded edible oils have further increased pouch adoption, as they provide tamper-proof sealing and product safety. Additionally, the expansion of e-commerce grocery platforms is supporting pouch sales through easy packaging, delivery efficiency, and reduced breakage risks.
Packaging Material Insights:
- Metal
- Plastic
- Paper
- Others
Plastic exhibits a clear dominance with a 55% share of the total India edible oil market in 2025.
Plastic dominates the market due to its cost efficiency, durability, and suitability for mass distribution. Plastic is lightweight, reducing transportation expenses and making it easier to handle across supply chains. It is widely used for both pouches and bottles, providing flexibility for different pack sizes. Manufacturers prefer plastic because it allows secure sealing, protects oil quality, and supports high-volume production. Its affordability also helps brands offer competitive pricing, making plastic packaging the most widely adopted option.
Plastic packaging also benefits from its strong availability and ease of manufacturing compared to alternative materials. It is less prone to breakage, which improves product safety during storage and long-distance transportation, especially in rural and semi-urban markets. Consumers also prefer plastic packs due to convenience, portability, and resealability in certain formats. The dominance of plastic is further supported by expanding retail networks, where lightweight and stackable packaging is essential for efficient shelf management and distribution across supermarkets, local stores, and wholesalers.
Pack Size Insights:
- Less than 1 Liters
- 1 Liters
- 1 Liters-5 Liters
- 5 Liters-10 Liters
- 10 Liters and Above
1 liters-5 liters dominate with a market share of 32% of the total India edible oil market in 2025.
1 liter to 5 liters accounts for the majority of the market share because of their suitability for regular household consumption and balanced purchasing value. These sizes align well with monthly usage patterns of average families, allowing consumers to manage budgets while avoiding frequent repurchases. Medium-sized packs also offer better price-per-liter value compared to smaller packs, making them attractive to cost-conscious buyers. Their compatibility with common kitchen storage spaces further supports preference across urban and semi-urban households, sustaining high demand through retail channels.
The dominance of 1 liter to 5 liters is also supported by their wide availability across brands, oil types, and packaging formats. Retailers favor these sizes due to faster turnover rates and consistent consumer demand. These packs cater to both nuclear and joint families, covering diverse household needs. Foodservice outlets with moderate consumption volumes also prefer these pack sizes for convenience and handling. The growing penetration of organized retail and online grocery platforms is further driving the sales of these pack sizes across the country.
Domestic Manufacturing/Imports Insights:
- Domestic Manufacturing
- Imports
Domestic manufacturing leads with a market share of 62% of the total India edible oil market in 2025.
Domestic manufacturing represents the largest segment, driven by the country’s expanding refining and processing capacity. For instance, in 2024, India’s inaugural oil palm processing facility started functioning in Arunachal Pradesh, part of the National Mission for Edible Oils - Oil Palm (NMEO-OP). This factory contributed to India's initiative to lessen reliance on edible oil imports and enhance domestic production. This approach reduces dependence on imported finished products and supports employment generation across the edible oil supply chain. Domestic manufacturing also allows better control over quality standards, packaging, and distribution efficiency, helping companies respond quickly to shifting consumer demand across different regions.
The dominance of domestic manufacturing is further supported by government initiatives encouraging local processing and strengthening the oilseed and refining ecosystem. Improved infrastructure, growing investments in refining facilities, and rising demand for branded oils contribute to higher domestic output. Local manufacturers benefit from established distribution networks that ensure wide market reach across urban and rural areas. Additionally, producing and packaging edible oils domestically helps stabilize supply availability, manage import cost fluctuations, and support price competitiveness in the growing consumer market.
Application Insights:
Access the comprehensive market breakdown Request Sample
- HoReCa
- Home Users
- Food Processing Industry
Home users exhibit a clear dominance with a 64% share of the total India edible oil market in 2025.
Home users lead the market, as edible oils play a crucial role in daily household cooking across the country. According to the Asian Palm Oil Alliance in 2024, India consumes 24–25 million tons of edible oil annually, of which palm oil accounts for about 9 million tons. Indian diets rely heavily on home-prepared meals, leading to consistent and high-volume consumption at the residential level. Rising population growth, increasing urban households, and higher spending on quality food products further strengthen this segment. Consumers also show higher awareness about health-focused oils, thereby driving the demand for refined and branded options that are widely purchased for regular domestic use.
The dominance of home users is also supported by changing lifestyles and increased demand for packaged edible oils in convenient formats. With more nuclear families and working professionals, households prefer ready-to-use, hygienically packaged oils available through supermarkets and online platforms. Regional cooking preferences and diverse culinary traditions also contribute to steady household consumption of multiple oil types. Moreover, promotional campaigns by major brands targeting domestic buyers reinforce household dominance, ensuring that home users remain the largest application segment in the market.
Distribution Channel Insights:
- Direct/Institutional Sales
- Supermarkets and Hypermarkets
- Convenience Stores
- Online
- Others
Supermarkets and hypermarkets dominate with a market share of 35% of the total India edible oil market in 2025.
Supermarkets and hypermarkets hold the biggest market share owing to their wide product assortment, strong brand availability, and consumer preference for organized retail shopping. These outlets offer multiple edible oil types, pack sizes, and promotional discounts, attracting urban and semi-urban buyers. Their ability to ensure product authenticity and quality also increases consumer trust compared to unorganized retail. Additionally, supermarkets provide convenient one-stop purchasing, which supports higher sales volumes for packaged and branded edible oils across major cities.
The dominance of supermarkets and hypermarkets is further driven by rapid expansion of organized retail chains across India. These stores benefit from efficient supply chains, bulk stocking, and attractive shelf displays that encourage impulse purchases. Consumers increasingly prefer modern retail environments for better shopping experiences and access to premium edible oil brands. Hypermarkets also serve as key distribution points for large family pack sizes, supporting volume sales. Growth in tier-II and tier-III cities are further strengthening the role of supermarkets in edible oil distribution.
Regional Insights:
- North India
- West and Central India
- East India
- South India
West and Central India lead with a market share of 31% of the total India edible oil market in 2025.
West and Central India dominates the market due to high consumption levels, strong urban concentration, and well-developed retail infrastructure. Major states in this region, including Maharashtra and Gujarat, have large population bases with rising demand for packaged and branded edible oils. The presence of key industrial hubs and food processing industries further supports bulk edible oil usage. Additionally, better logistics connectivity and access to organized retail channels strengthen distribution efficiency, contributing to the region’s leading market share.
The dominance of West and Central India is also supported by robust refining infrastructure and proximity to major import hubs. High purchasing power in these regions further accelerates the adoption of premium oil varieties. Illustrating this growth strategy, AWL Agri Business (formerly Adani Wilmar) announced plans in 2025, to expand its footprint in South and Central India through strategic acquisitions. By exploring new categories like organic and cold-pressed edible oils while leveraging its leading Fortune brand, the company aimed to capture rising demand for diversified, high-quality kitchen essentials.
Market Dynamics:
Growth Drivers:
Why is the India Edible Oil Market Growing?
Regional Branding and Cultural Affinity in Consumption
Strong alignment with regional food culture is strengthening the India edible oil market growth by deepening consumer loyalty and repeat usage. Brands that connect products with local culinary identity are better positioned to retain relevance in diverse regional markets. This approach was highlighted in 2025 when Fortune, part of AWL Agri Business, launched its ‘Bhojan Bahini’ campaign in West Bengal to showcase its mustard and soybean oil heritage. Featuring Sourav Ganguly and Abir Chatterjee, the campaign used cultural familiarity, humor, and nostalgia to reinforce Fortune oils as trusted everyday staples in authentic Bengali cooking traditions.
Consumer Awareness and Trust-Building Initiatives
The increasing emphasis on consumer awareness and transparency is bolstering the market growth in India by strengthening trust in branded products. As households become more attentive to labeling, net weight, and regulatory compliance, brands that actively educate consumers gain credibility and loyalty. This approach was evident in 2025, when Freedom Sunflower Oil launched a consumer awareness campaign with Rahul Dravid, encouraging buyers to verify that 1-litre edible oil pouches contain the mandated 910 gm as per government norms. Through its “Pack Review System,” the initiative promoted fair practices, protected household interests, and reinforces confidence in organized edible oil brands.
Rise of Cold-Pressed Oils
The growing preference for minimally processed and preventive wellness products is influencing the India edible oil market, particularly within the premium segment. Consumers are increasingly prioritizing oils associated with nutrient retention, balanced fatty acids, and everyday heart health, encouraging companies to expand into cold-pressed formats. This shift is reflected in Marico Limited’s 2025 entry into the cold-pressed edible oils space with the launch of the Saffola Cold Pressed Oils range, including dual-seed and single-seed variants for health-focused cooking. The products used low-temperature extraction to retain natural nutrients, flavor, and fatty acid balance. This launch strengthened Saffola’s wellness portfolio and addressed the growing demand for preventive, heart-healthy everyday oils.

Market Restraints:
What Challenges the India Edible Oil Market is Facing?
High Import Dependency Exposing Market to Global Price Volatility
India’s heavy dependence on imported edible oils to satisfy domestic demand makes the country highly exposed to global market volatility. International price swings, supply disruptions, and geopolitical tensions can quickly affect availability and costs. Shifts in commodity trends, exchange rate movements, and trade policy decisions by major exporting countries also play a direct role in influencing domestic price stability and consumer affordability nationwide.
Infrastructure Constraints in Oilseed Processing and Storage
Insufficient processing infrastructure and a lack of adequate storage facilities in key oilseed-producing regions limit domestic value addition and weaken supply chain efficiency. Processing capacity remains concentrated in a few geographic hubs, creating logistical bottlenecks for farmers located farther from these clusters. This uneven distribution increases transportation expenses, delays market access, and reduces overall profitability for producers in remote cultivation zones.
Vulnerability to Climatic Variations Affecting Oilseed Yields
India’s oilseed cultivation is largely rainfed, making production highly dependent on monsoon performance and vulnerable to droughts and climate-related disruptions. Variability in rainfall often leads to inconsistent yields, which weakens domestic supply stability. During deficit years, the country is forced to increase edible oil imports to bridge demand gaps, influencing market pricing trends and creating greater exposure to global volatility.
Competitive Landscape:
The India edible oil market exhibits moderate competitive intensity characterized by the presence of multinational corporations operating alongside regional manufacturers across diverse price segments and distribution channels. Market dynamics reflect strategic positioning, ranging from premium innovation-driven offerings emphasizing health benefits and quality to value-oriented products targeting cost-conscious consumers. The competitive landscape is increasingly shaped by brand marketing effectiveness, distribution network expansion, e-commerce capabilities, and product differentiation through fortification and functional attributes. Companies are investing in capacity expansion, cold-pressed and organic product lines, and sustainable sourcing practices to capture evolving consumer preferences.
Some of the key players in the market include:
- Adani Group
- BCL Industries Ltd.
- Bunge
- Cargill, Incorporated
- Emami Agrotech Ltd
- Gulab Oil & Foods
- Mahesh Edible Oil Industries Limited
- Marico Limited
- N.K Proteins Pvt Ltd
- Patanjali Ayurved Limited
- Sanwaria Consumer Limited
- Sundrop Brands Limited
Recent Developments:
- August 2025: The Government of India introduced the Vegetable Oil Products, Production and Availability (VOPPA) Regulation Order, 2025, tightening oversight of the edible oil sector to improve transparency and prevent supply disruptions. Producers must now register with authorities and submit monthly reports on production, sales, and stock levels to curb hoarding and misreporting. The order also strengthened enforcement through mandatory factory inspections and stock seizures for violations.
- July 2025: KRBL, known for India Gate Basmati Rice, entered the edible oil market with its new health-focused brand India Gate Uplife, launching blended oils aimed at digestive wellness. The company introduced premium variants like Weight Watchers and Gut Pro, along with modern portion-controlled packaging for urban consumers.
India Edible Oil Market Report Coverage:
| Report Features | Details |
|---|---|
| Base Year of the Analysis | 2025 |
| Historical Period | 2020-2025 |
| Forecast Period | 2026-2034 |
| Units | Million Tons |
| Scope of the Report | Exploration of Historical Trends and Market Outlook, Industry Catalysts and Challenges, Segment-Wise Historical and Future Market Assessment:
|
| Types Covered | Palm Oil, Soybean Oil, Mustard Oil, Sunflower Oil, Others |
| Packaging Types Covered | Pouches, Jars, Cans, Bottles |
| Packaging Materials Covered | Metal, Plastic, Paper, Others |
| Pack Sizes Covered | Less than 1 Liters, 1 Liters, 1 Liters-5 Liters, 5 Liters-10 Liters, 10 Liters and Above |
| Domestic Manufacturing/Imports Covered | Domestic Manufacturing, Imports |
| Applications Covered | HoReCa, Home Users, Food Processing Industry |
| Distribution Channels Covered | Direct/Institutional Sales, Supermarkets and Hypermarkets, Convenience Stores, Online, Others |
| Regions Covered | North India, West and Central India, East India, South India |
| Companies Covered | Adani Group, BCL Industries Ltd., Bunge, Cargill, Incorporated, Emami Agrotech Ltd, Gulab Oil & Foods, Mahesh Edible Oil Industries Limited, Marico Limited, N.K Proteins Pvt Ltd, Patanjali Ayurved Limited, Sanwaria Consumer Limited, Sundrop Brands Limited, etc. |
| Customization Scope | 10% Free Customization |
| Post-Sale Analyst Support | 10-12 Weeks |
| Delivery Format | PDF and Excel through Email (We can also provide the editable version of the report in PPT/Word format on special request) |
Frequently Asked Questions About the India Edible Oil Market Report
The India edible oil market reached a volume of 25.33 Million Tons in 2025.
The India edible oil market is expected to grow at a compound annual growth rate of 1.26% from 2026-2034 to reach 28.34 Million Tons by 2034.
Palm oil leads the market with a share of 38% in 2025, owing to its cost-effectiveness, versatility across cooking and food processing applications, and widespread availability through established import channels.
Key factors driving the India edible oil market include the growing demand for fortified and premium health-focused oils over low-cost bulk products. Consumers increasingly value nutrition, cholesterol benefits, and improved oil stability, as seen in 2025 with Fishfa Agri World’s launch of PeanutJi Vedic high-oleic groundnut oil.
Major challenges include high import dependency to meet domestic consumption, global price volatility affecting market stability, limited processing and storage infrastructure in production regions, vulnerability to monsoon variability affecting rainfed oilseed cultivation, and logistical constraints in rural distribution networks.
Need more help?
- Speak to our experienced analysts for insights on the current market scenarios.
- Include additional segments and countries to customize the report as per your requirement.
- Gain an unparalleled competitive advantage in your domain by understanding how to utilize the report and positively impacting your operations and revenue.
- For further assistance, please connect with our analysts.
 Request Customization
 Speak to an Analyst
 Request Brochure
 Inquire Before Buying
Benefits of Customization
- Personalize this research
- Triangulate with your data
- Get data as per your format and definition
- Gain a deeper dive into a specific application, geography, customer, or competitor
- Any level of personalization
Get in Touch With Us
UNITED STATES
Phone: +1-201-971-6302
INDIA
Phone: +91-120-433-0800
UNITED KINGDOM
Phone: +44-753-714-6104
Email: [email protected]
Client Testimonials


.webp)


