
India Power Transformer Market Size, Share, Trends and Forecast by Core, Insulation, Phase, Rating, Application, and Region, 2026-2034
India Power Transformer Market Size, Share, Trends & Forecast (2026-2034)
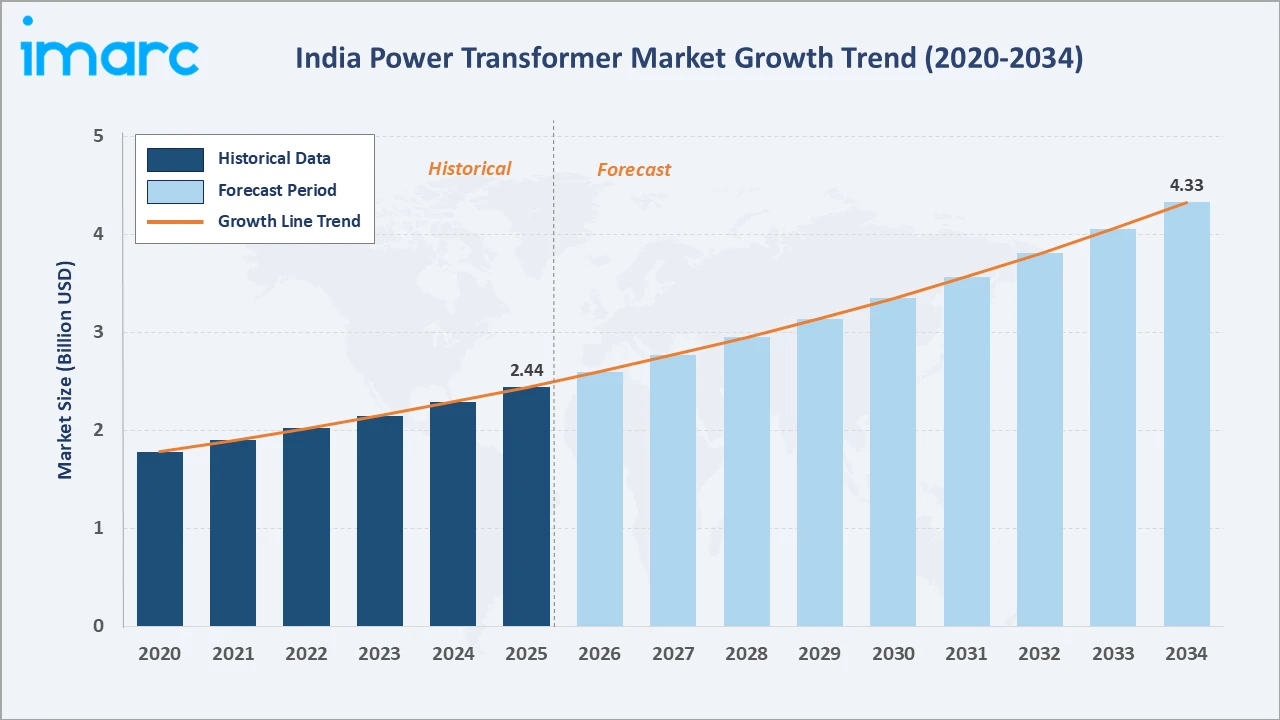
The India power transformer market grew from USD 2.44 Billion in 2025 to USD 2.60 Billion in 2026 and is projected to reach USD 4.33 Billion by 2034, growing at a CAGR of 6.57% during 2026-2034. Rising electricity demand, transmission expansion, and renewable integration are driving growth.
Industrial growth, data centers, grid modernization, and replacement of aging units continue to support demand. Closed core transformers dominate at 55.0%. Utilities lead applications at 50.0%. West and Central India commands 35.0% of national market share.
Market Snapshot
| Metric | Value |
|---|---|
| Base Year Market Size (2025) | USD 2.44 Billion |
| Market Size (2026) | USD 2.60 Billion |
| Forecast Market Size (2034) | USD 4.33 Billion |
| CAGR (2026-2034) | 6.57% |
| Base Year | 2025 |
| Historical Period | 2020-2025 |
| Forecast Period | 2026-2034 |
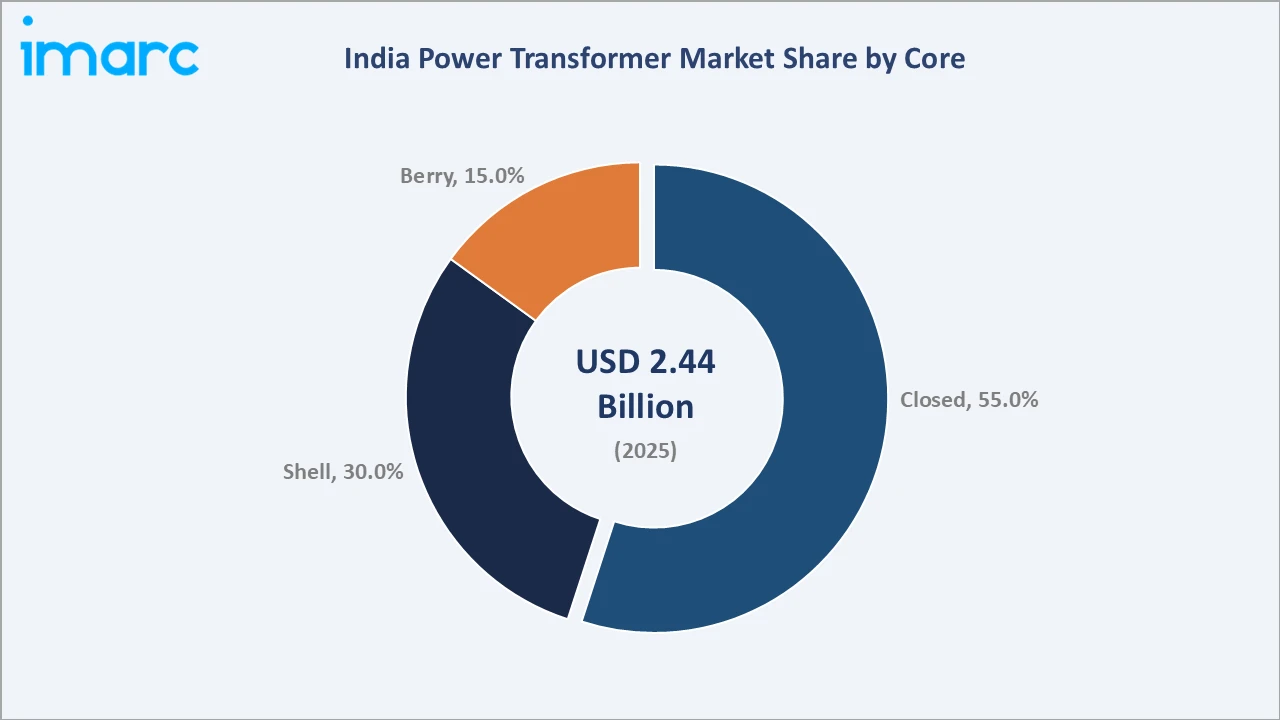
| Dominant Core | Closed (55.0%, 2025) |
| Dominant Application | Utilities (50.0%, 2025) |
| Leading Region | West and Central India (35.0%, 2025) |
The India power transformer market size increased from USD 1.78 Billion in 2020 to USD 2.44 Billion in 2025 and is estimated to reach USD 2.60 Billion in 2026. The market is further expected to grow to USD 3.35 Billion by 2030 and USD 4.33 Billion by 2034.
To get more information on this market, Request Sample
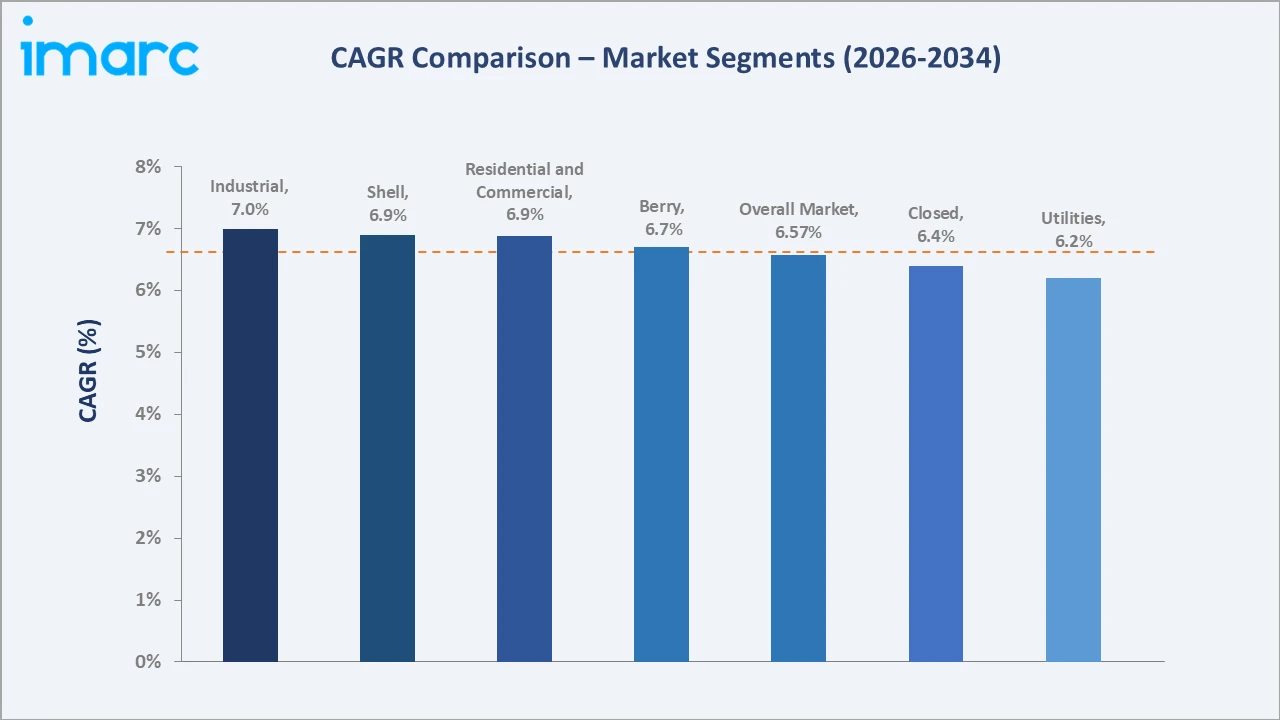
Industrial applications are expected to grow fastest at ~7.0% CAGR, supported by manufacturing expansion, data centers, and captive renewable projects. Shell core transformers follow at ~6.9% CAGR, driven by demand for compact, high-capacity units in transmission substations.
Executive Summary
The India power transformer market expanded from USD 2.44 Billion in 2025 to an estimated USD 2.60 Billion in 2026. Transmission utilities, state distribution companies, and industries are investing in transformers to support rising power demand, renewable energy integration, and grid reliability.
Manufacturers are expanding capacity to meet strong order books. The market is projected to reach USD 4.33 Billion by 2034. Closed core transformers at 55.0% lead core types. Utilities at 50.0% lead applications. West and Central India leads at 35.0%.
Key Market Insights
| Insight | Data |
|---|---|
| Dominant Core | Closed - 55.0% share (2025) |
| Dominant Application | Utilities - 50.0% market share (2025) |
| Leading Region | West and Central India - 35.0% share (2025) |
| Market Opportunity | 765 kV and HVDC transformers; renewable energy corridors; data center power; eco-friendly and digital transformers |
Key Analytical Observations Supporting the Above Data:
- Closed at 55.0%: Closed core transformers dominate because their simple, robust design offers efficient performance and lower costs for a wide range of transmission and distribution applications.
- Utilities at 50.0%: Utilities lead because central and state transmission companies and distribution utilities are the largest buyers of power transformers for substations and grid expansion.
- West and Central India at 35.0%: West and Central India leads due to strong industrial bases in Gujarat and Maharashtra, large renewable projects, and major transformer manufacturing clusters.
India Power Transformer Market Overview
Power transformers step voltage up or down to transmit electricity efficiently between generation, transmission, and distribution networks. They are critical equipment in substations, power plants, industrial facilities, and large commercial complexes. Their reliability is essential for uninterrupted power supply. Transformer failures can cause major outages and economic losses.
The industry ecosystem links raw material suppliers, transformer manufacturers, EPC contractors, testing and service providers, regulators, and end users. Macroeconomic factors include power demand, transmission investment, renewable capacity additions, industrial growth, and commodity prices, all of which shape demand. Public sector utilities account for a large share of procurement.
Market Dynamics
To evaluate market opportunities, Request Sample
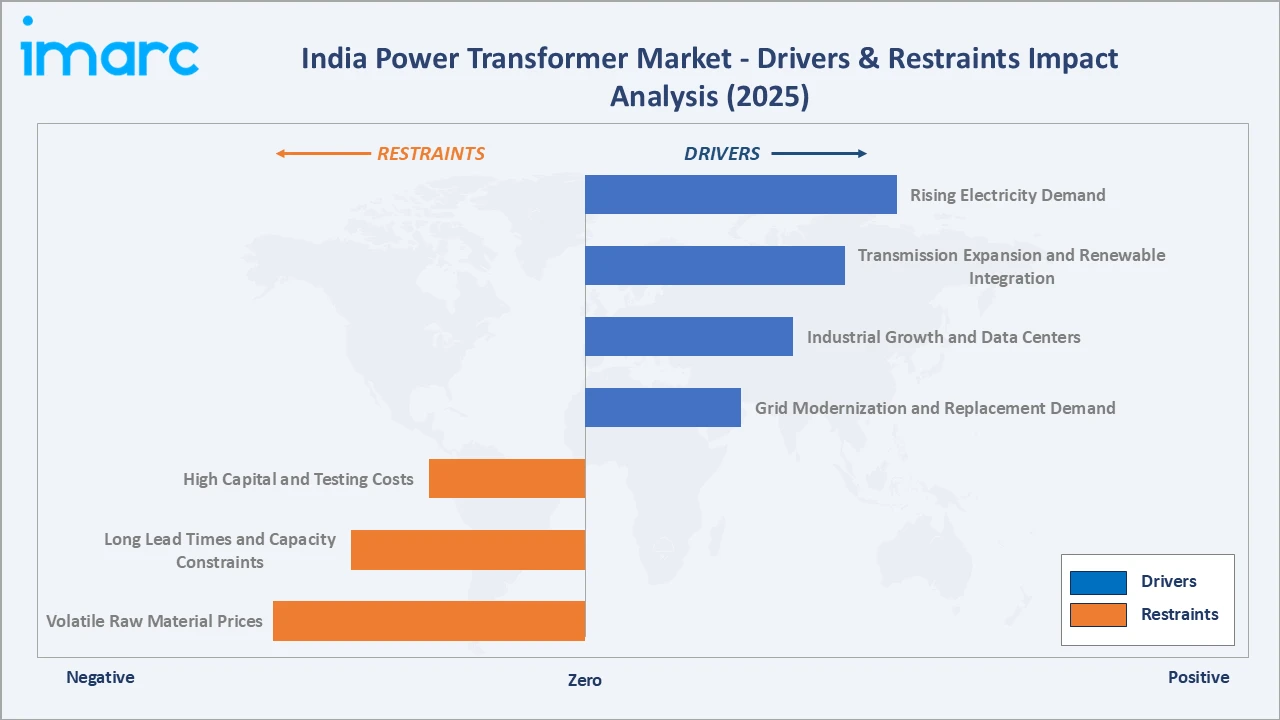
Market Drivers
- Rising Electricity Demand: Economic growth, urbanization, electrification, and rising use of appliances and cooling are increasing peak and total power demand, requiring more transformation capacity. India’s peak power demand has been setting new records, and state utilities are investing in substations to serve growing cities, industrial corridors, and rural electrification.
- Transmission Expansion and Renewable Integration: Large solar and wind projects require new transmission lines and substations, increasing demand for high-voltage power transformers. Green energy corridor programs and inter-state transmission projects are connecting renewable-rich states to demand centers.
- Industrial Growth and Data Centers: Manufacturing expansion, data centers, and electric mobility infrastructure need reliable, high-capacity power connections. Production-linked incentive schemes are attracting new factories in electronics, solar modules, batteries, and steel, each needing dedicated substations and power transformers.
- Grid Modernization and Replacement Demand: Aging transformers are being replaced with efficient, digitally monitored units to reduce losses and improve reliability. Distribution reform programs encourage utilities to upgrade equipment and reduce technical losses. Many transformers installed decades ago are reaching the end of their design life.
Market Restraints
- Volatile Raw Material Prices: Fluctuating prices of CRGO steel, copper, and transformer oil affect manufacturing costs and project margins. Fixed-price contracts expose manufacturers to cost increases between bidding and delivery. Price variation clauses help manage some of this risk. Manufacturers also hedge commodity exposure where possible.
- Long Lead Times and Capacity Constraints: Strong demand has stretched manufacturing and testing capacity, extending delivery times. Some utilities face delays in commissioning substations due to transformer shortages. Manufacturers are prioritizing capacity additions to reduce backlogs. Utilities are adjusting procurement timelines to account for longer deliveries.
- High Capital and Testing Costs: Large transformers require major investment in factories, testing facilities, and transportation. Moving very large units requires specialized trailers and route planning. Road infrastructure limitations can affect delivery of the largest units. Some large transformers are assembled at site to overcome transport limits.
Market Opportunities
- 765 kV and HVDC Equipment: Long-distance transmission projects create demand for extra-high-voltage and HVDC transformers. These projects require advanced design and testing capabilities. HVDC links are planned to carry renewable power over long distances.
- Export Opportunities: Indian manufacturers can supply growing global demand for power transformers. Global shortages have created export opportunities for Indian factories. Exports also help manufacturers improve utilization and scale. Export markets include the Middle East, Africa, Europe, and North America. Meeting international standards strengthens domestic quality as well.
Market Challenges
- Quality and Testing Compliance: Meeting utility specifications and BIS standards requires rigorous testing. Short-circuit testing capacity in India is being expanded. Independent testing laboratories support quality verification. Third-party inspection is common in utility contracts. Factory acceptance tests are witnessed by customers. Type tests confirm performance under extreme conditions.
- Skilled Workforce Shortages: Designing and building large transformers requires specialized engineering skills. Companies are investing in training and engineering centers. Retaining experienced designers is a priority for manufacturers. Partnerships with engineering colleges support talent development. Automation in factories also helps address skill shortages. Digital design tools improve engineering productivity.
Emerging Market Trends
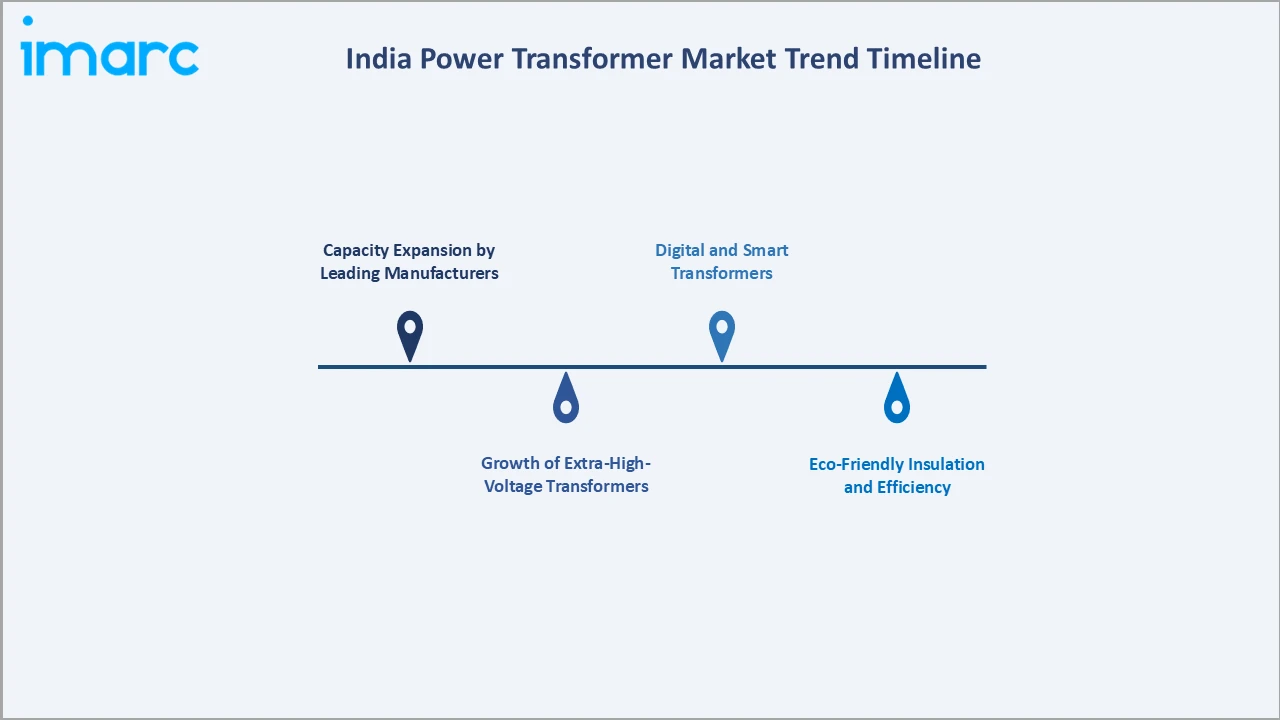
1. Capacity Expansion by Leading Manufacturers
Global and Indian manufacturers are building new factories and expanding existing plants to meet strong order books from transmission utilities, renewable developers, and industry. These investments aim to add large power transformer capacity, shorten delivery times, reduce import dependence, and support both domestic supply and export opportunities.
2. Growth of Extra-High-Voltage Transformers
Demand for 765 kV and 400 kV transformers is rising as India builds long-distance transmission corridors to carry renewable power to major demand centers. Higher voltages reduce losses and move more power through fewer lines, while green energy corridors and planned HVDC links are further increasing orders for extra-high-voltage equipment.
3. Digital and Smart Transformers
Sensors and online monitoring systems enable real-time condition tracking and predictive maintenance. Digital transformers help utilities avoid unexpected failures. Remote monitoring supports efficient maintenance planning.
4. Eco-Friendly Insulation and Efficiency
Natural ester oils and low-loss designs are improving safety and environmental performance. Energy efficiency standards encourage adoption of low-loss designs. Compact and lightweight designs are also gaining interest. Green procurement policies may further support eco-friendly designs. Life-cycle cost evaluation is increasingly used in tenders.
Industry Value Chain Analysis
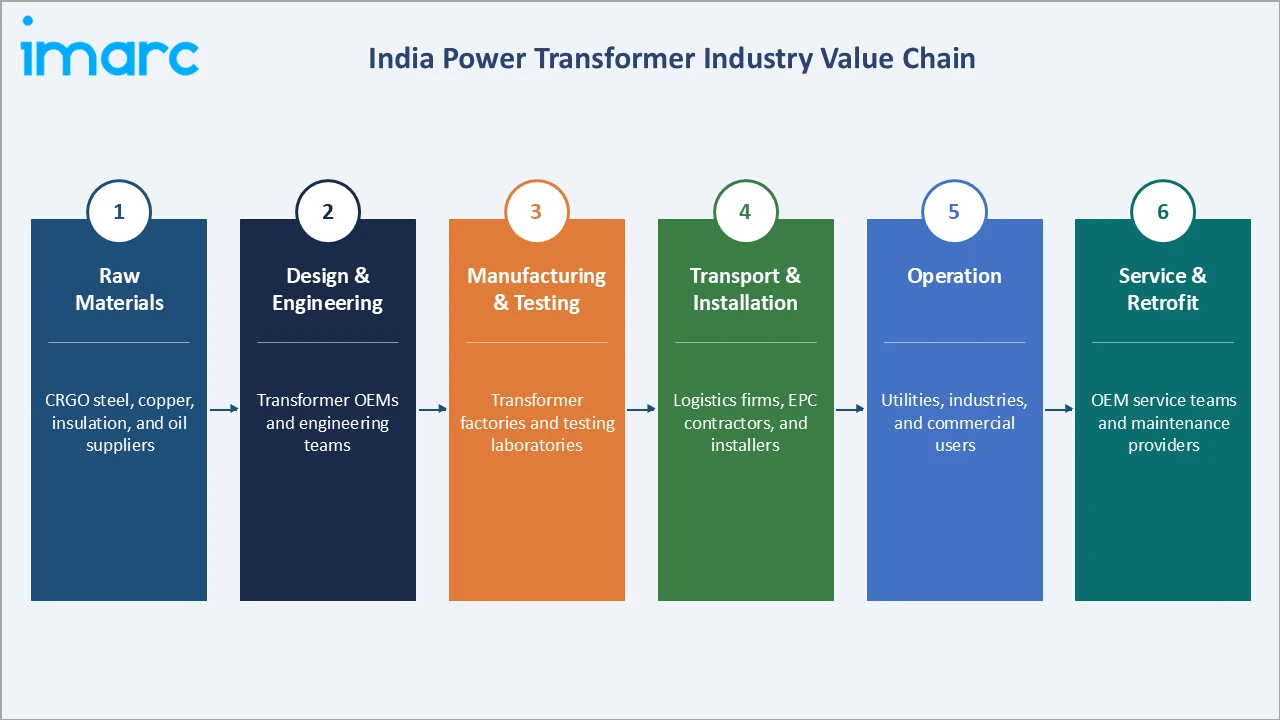
The India power transformer value chain spans raw materials, design and engineering, manufacturing and testing, transport and installation, operation, and service and retrofit. Value is concentrated in engineering, manufacturing, and testing capabilities.
| Stage | Key Participants |
|---|---|
| Raw Materials | CRGO steel, copper, insulation, and oil suppliers |
| Design & Engineering | Transformer OEMs and engineering teams |
| Manufacturing & Testing | Transformer factories and testing laboratories |
| Transport & Installation | Logistics firms, EPC contractors, and installers |
| Operation | Utilities, industries, and commercial users |
| Service & Retrofit | OEM service teams and maintenance providers |
Manufacturing and testing is the most consequential stage of the chain. Factory capacity, quality systems, and testing facilities determine delivery times and product reliability. Raw material availability and price also strongly affect costs. Long-term supply agreements help stabilize material availability. Domestic production of CRGO steel could reduce import dependence. Copper prices remain a key cost driver.
Technology Landscape in the India Power Transformer Industry
Core and Winding Design
Advanced core steels and winding designs reduce losses and improve efficiency. Amorphous and high-grade steels are used in efficient designs. Optimized designs reduce noise and material use. Simulation tools help engineers optimize designs before production. Advanced testing validates designs under fault conditions.
Insulation and Cooling Systems
Ester oils, improved paper insulation, and efficient cooling systems enhance safety and extend life. Ester oils have higher fire points, improving safety in urban substations. Biodegradable oils also reduce environmental risks from leaks. Improved cooling designs allow higher loading capacity. Thermal monitoring helps prevent overheating.
Digital Monitoring and Diagnostics
Online dissolved gas analysis, temperature sensors, and digital twins support condition-based maintenance. Data analytics support fleet-level asset management. Cybersecurity is becoming important for connected grid equipment. Standardized communication protocols support integration with control systems. Digital records also support warranty and service management.
Utilities are building asset databases for their transformer fleets. Asset data supports better investment decisions. Predictive maintenance reduces unplanned outages. It also lowers lifetime maintenance costs. Utilities increasingly adopt these practices for their most critical transmission grid assets across India.
Market Segmentation Analysis
The report covers the following segments:
| Segment Category | Leading Segment | Market Share | Year |
|---|---|---|---|
| Core | Closed | 55.0% | 2025 |
| Insulation | 🔒 | 🔒 | 2025 |
| Phase | 🔒 | 🔒 | 2025 |
| Rating | 🔒 | 🔒 | 2025 |
| Application | Utilities | 50.0% | 2025 |
| Region | West and Central India | 35.0% | 2025 |

By Core
Closed core transformers lead at 55.0% (2025). Their simple design and reliable performance suit most transmission and distribution needs. They are widely used in substations across India. Their manufacturing processes are well established among domestic suppliers. Closed core designs are preferred for many medium and high voltage ratings.
To access detailed market analysis, Request Sample
They benefit from mature supply chains and standardized designs. Most domestic manufacturers have strong expertise in these designs. Standardization lowers costs and simplifies maintenance. Utilities favor proven, standardized designs.
Shell core transformers at 30.0% grow fastest at ~6.9% CAGR, offering compact high-capacity designs. Berry core transformers at 15.0% grow at ~6.7%. Berry core designs are used for specific applications requiring distributed windings. Each core type serves specific technical and cost requirements.
Product selection depends on voltage, capacity, and installation conditions. Manufacturers increasingly offer customized solutions. Special designs are required for industrial furnaces and rectifier applications. Industrial customers value tailored designs. Steel, cement, and chemical plants are major industrial buyers.
By Application
Utilities lead at 50.0% (2025). Transmission and distribution companies are the largest buyers for substations and grid expansion.
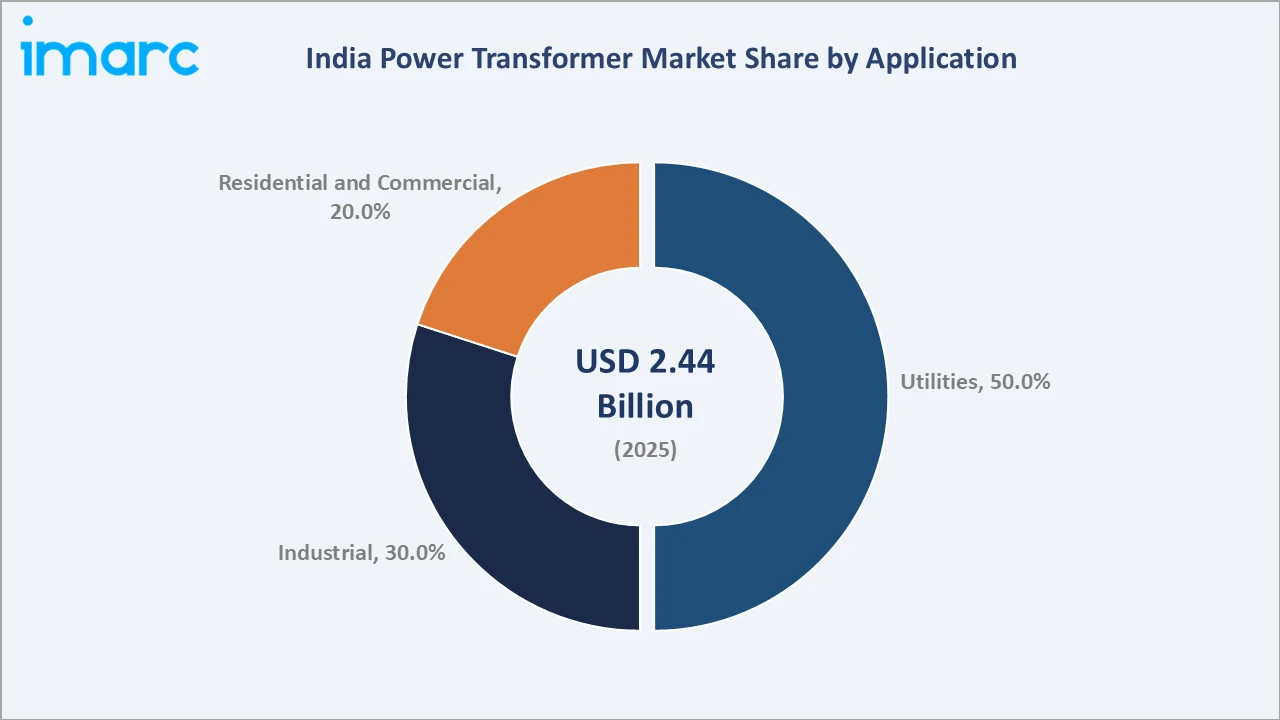
Industrial applications at 30.0% grow fastest at ~7.0% CAGR. Residential and commercial applications at 20.0% grow at ~6.9%, supported by urban infrastructure. Metro rail, airports, and commercial complexes require dedicated substations. Commercial buildings increasingly require reliable high-capacity connections. Large housing projects also add distribution substations.
Hospitals, IT parks, and commercial complexes require reliable power and backup arrangements, increasing demand for dedicated substations and power transformers. Urban real estate development, expansion of commercial parks, and rising electricity use in buildings for cooling and lighting continue to support steady demand from the residential and commercial segment.
Regional Market Insights
| Region | Share (2025) | Key India Power Transformer Market Drivers & Characteristics |
|---|---|---|
| West and Central India | 35.0% | Industrial bases, renewable projects, and manufacturing clusters. |
| North India | 25.0% | Transmission expansion and rising urban power demand. |
| South India | 25.0% | Renewable energy, industry, and data centers. |
| East and Northeast India | 15.0% | Grid strengthening and power evacuation projects. |
West and Central India's 35.0% market leadership reflects strong industrial bases in Gujarat and Maharashtra, large renewable projects in Rajasthan and Madhya Pradesh, and major manufacturing clusters. North India's 25.0% reflects transmission expansion and rising urban demand. Uttar Pradesh and Punjab are major centers of transmission investment.
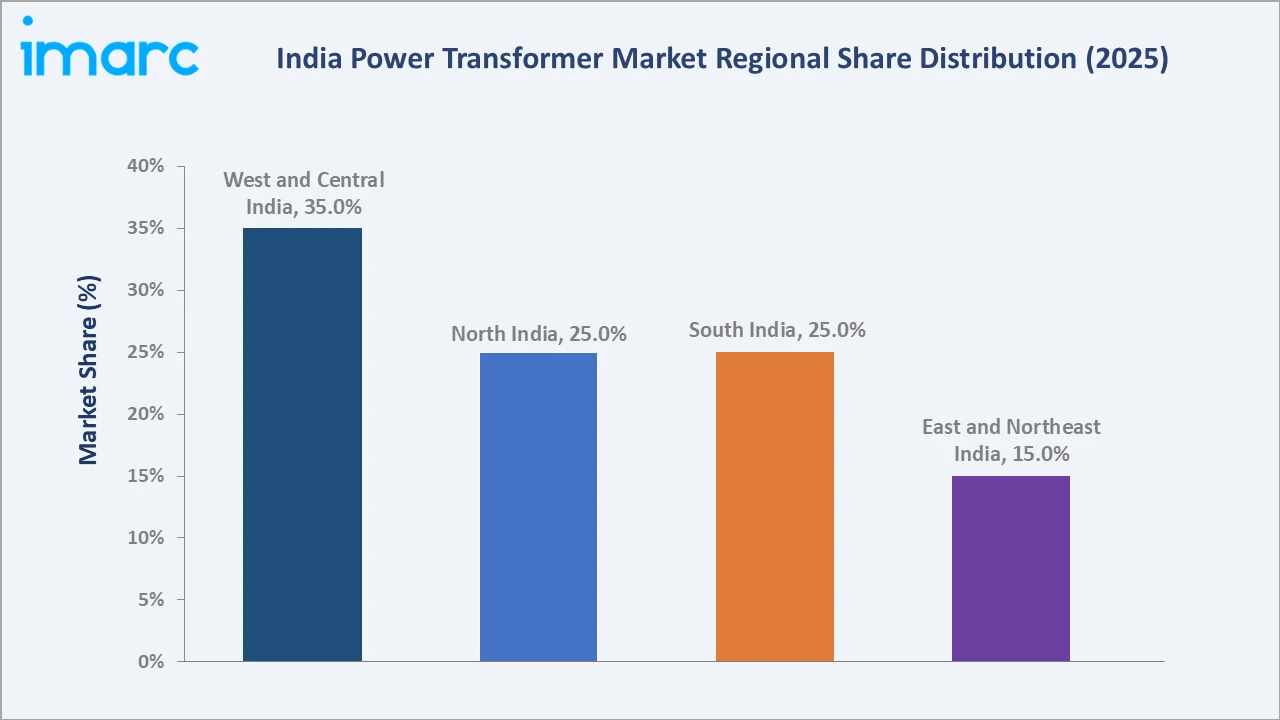
South India's 25.0% reflects renewable energy, industrial growth, and data centers in Tamil Nadu, Karnataka, and Andhra Pradesh. Data center growth in Chennai and Hyderabad supports demand. Tamil Nadu and Karnataka also host strong wind and solar capacity.
East and Northeast India’s 15.0% is the smallest share, but grid strengthening and power evacuation projects support growth. Expanding industrial activity, new hydropower and renewable projects, and investments in intra-state transmission networks are increasing the need for new substations, while upgrades to aging equipment create steady replacement demand.
Competitive Landscape
The India power transformer market includes global manufacturers with Indian operations, public sector companies, and private Indian makers. Competition centers on voltage range, delivery time, quality, testing capability, price, and service. Order books are strong across most leading suppliers. Delivery reliability has become a key competitive factor.
Price competitiveness remains important in public tenders. After-sales support is valued by industrial customers. Fast response for repairs is a key differentiator. Local service centers improve response times. Spare parts availability is also critical.
| Company | Key Brands | Market Position | Core Strength |
|---|---|---|---|
| Hitachi Energy Ltd | TXpert | Market Leader | Broad portfolio and Indian manufacturing. |
| Siemens Energy | Power Transformer Solutions | Market Leader | High-voltage technology and capacity expansion. |
| GE Vernova | 765 kV Transformers and Reactors | Strong Challenger | Extra-high-voltage expertise in Vadodara. |
| Bharat Heavy Electricals Limited | BHEL Transformers | Strong Challenger | Large public sector manufacturer. |
| Toshiba Corporation | Toshiba Transformers | Innovator | Advanced technology through Indian subsidiary. |
| CG Power and Industrial Solutions Limited | Power Transformers | Niche Player | Wide range of power transformers. |
| Voltamp Transformer | Voltamp | Niche Player | Industrial and distribution transformers. |
The most important competitive dynamic is manufacturing capacity. Companies that expand factories and testing facilities can deliver faster and capture a larger share of growing orders. Local manufacturing is also supported by Make in India policies. Restrictions on imports from some countries favor domestic production.
Global manufacturers are expanding local production to meet this demand. New entrants are investing in high-voltage capabilities. Domestic competition helps keep prices competitive for utilities. Competition also encourages innovation in design and efficiency.
Key Company Profiles
Hitachi Energy Ltd
Hitachi Energy operates power, dry distribution, and traction transformer factories in Gujarat and insulation and components factories in Mysore.
- Key Brands: TXpert, power transformers.
- Recent Developments: In June 2026, Hitachi Energy announced a new large power transformer factory in Karjan, Vadodara.
- Strategic Focus: Supplying transformers for high-voltage transmission, HVDC, AI data centers, and large industrial applications.
Siemens Energy
Siemens Energy operates in India through Siemens Energy India Limited, offering power transformers, switchgear, and grid solutions.
- Key Brands: Large power transformers, reactors.
- Recent Developments: In February 2026, Siemens Energy India approved a new power transformer factory adding about 30,000 MVA of capacity.
- Strategic Focus: Doubling capacity at its Kalwa transformer factory from 15,000 MVA to 30,000 MVA.
GE Vernova
GE Vernova operates multiple manufacturing facilities and technology centres across India, providing solutions for renewable energy, power transmission, grid modernization, and electricity infrastructure.
- Key Brands: 765 kV transformers, shunt reactors.
- Recent Developments: GE Vernova T&D India approved an expansion to increase transformer and reactor capacity by over 50 percent.
- Strategic Focus: Completing the Vadodara, Hosur, and Padappai capacity expansion by 2028.
Market Concentration Analysis
The India power transformer market is moderately concentrated in extra-high-voltage segments, where a few large manufacturers lead, while medium-voltage power transformers are supplied by many domestic companies.
Market concentration is evolving as leading players expand capacity and new domestic manufacturers enter the market. Domestic players are moving into higher voltage classes. Partnerships with global firms support technology transfer. Mergers and acquisitions are also reshaping the industry. Joint ventures help combine technology and local market knowledge.
Capacity expansion announcements signal confidence in long-term demand. Order backlogs provide strong revenue visibility for manufacturers.
Investment & Growth Opportunities
Highest Growth Segments
Industrial applications (~7.0% CAGR through manufacturing and data centers), shell core transformers (~6.9% CAGR through compact designs), residential and commercial (~6.9% CAGR through urban infrastructure), and East and Northeast India (~6.9% CAGR through grid strengthening) represent the highest-growth investment areas through 2034.
Emerging Investment Opportunities
Extra-high-voltage manufacturing and testing facilities are among the most promising opportunities, addressing capacity shortages. Component manufacturing such as bushings and tap changers also offers opportunities. Service and refurbishment businesses provide stable returns. Testing and certification services offer additional value. Component localization is an important investment theme.
Training and skills programs support industry growth. Investment in testing facilities also supports quality improvements.
Investment Themes
Two investment themes stand out through 2034. Capacity expansion in transformer manufacturing and testing will help suppliers meet strong order books and shorten delivery times, while digital monitoring solutions improve transformer reliability, enable predictive maintenance, and create recurring service revenue for manufacturers and service providers.
Future Market Outlook (2026-2034)
The India power transformer market is projected to grow from USD 2.44 Billion in 2025 to USD 2.60 Billion in 2026, reaching USD 4.33 Billion by 2034, registering a CAGR of 6.57% during 2026-2034.
The anchor value of USD 3.35 Billion in 2030 marks a point at which new factory capacity should ease supply constraints. Digital transformers should be more common in utility fleets. Export volumes should also increase as global demand remains strong. Supply chain investments should improve component availability.
Grid reliability standards will continue to rise. Utilities will demand higher efficiency and digital capabilities. Sustainability considerations will influence product design.
Three structural forces define India power transformer market growth through 2034 electricity demand growth; transmission expansion; and grid modernization. Together, these forces support steady growth across core types, applications, and regions. Supply chain localization will remain an important priority. Skilled workforce development will support capacity growth.
Export competitiveness will further strengthen domestic manufacturers. Policy support will remain a key enabler. Long-term transmission planning provides demand visibility.
Research Methodology
Primary Research
Primary research comprised structured interviews with industry stakeholders, including transformer manufacturers, utilities, EPC contractors, component suppliers, and industry experts across India.
Secondary Research
Secondary research covered company press releases, government publications, CEA reports, and industry databases. Over 50 credible secondary sources were reviewed, compared, and cross-checked for accuracy and consistency across datasets.
Forecasting Models
Market revenue forecasts were developed using a demand-based model: transformer capacity additions by core, application, and region multiplied by average prices, with segment results aggregated to total market value. Assumptions were validated through detailed discussions with experienced industry experts, utility engineers, and transformer manufacturers across India.
India Power Transformer Market Report Coverage:
| Report Features | Details |
|---|---|
| Base Year of the Analysis | 2025 |
| Historical Period | 2020-2025 |
| Forecast Period | 2026-2034 |
| Units | Billion USD |
| Scope of the Report |
Exploration of Historical Trends and Market Outlook, Industry Catalysts and Challenges, Segment-Wise Historical and Future Market Assessment:
|
| Cores Covered | Closed, Shell, Berry |
| Insulations Covered | Gas, Oil, Solid, Air, Others |
| Phases Covered | Single, Three |
| Ratings Covered | 100 MVA To 500 MVA, 501 MVA To 800 MVA, 801 MVA To 1200 MVA |
| Applications Covered | Residential and Commercial, Utilities, Industrial |
| Regions Covered | North India, West and Central India, South India, East and Northeast India |
| Companies Covered | Hitachi Energy Ltd, Siemens Energy, GE Vernova, Bharat Heavy Electricals Limited, Toshiba Corporation, CG Power and Industrial Solutions Limited, Voltamp Transformer, etc. |
| Customization Scope | 10% Free Customization |
| Post-Sale Analyst Support | 10-12 Weeks |
| Delivery Format | PDF and Excel through Email (We can also provide the editable version of the report in PPT/Word format on special request) |
Key Benefits for Stakeholders:
- IMARC’s industry report offers a comprehensive quantitative analysis of various market segments, historical and current market trends, market forecasts, and dynamics of the India power transformer market from 2020-2034.
- The research report provides the latest information on the market drivers, challenges, and opportunities in the India power transformer market.
- Porter's five forces analysis assist stakeholders in assessing the impact of new entrants, competitive rivalry, supplier power, buyer power, and the threat of substitution. It helps stakeholders to analyze the level of competition within the India power transformer industry and its attractiveness.
- Competitive landscape allows stakeholders to understand their competitive environment and provides an insight into the current positions of key players in the market.
Frequently Asked Questions About the India Power Transformer Market Report
The India power transformer market size is estimated at USD 2.60 Billion in 2026, up from USD 2.44 Billion in 2025. Growth is supported by rising electricity demand, transmission expansion, and renewable energy integration.
The market is expected to grow at a CAGR of 6.57% during 2026-2034, reaching USD 4.33 Billion by 2034. Growth reflects investment in transmission corridors, industrial power connections, and replacement of aging transformers.
Closed core transformers lead with a 55.0% share in 2025, owing to their simple, robust design and efficient performance. Shell core transformers hold 30.0% and are the fastest-growing core type.
Utilities lead with a 50.0% share in 2025, as transmission and distribution companies are the largest buyers. Industrial applications hold 30.0% and are growing fastest, supported by manufacturing and data centers.
West and Central India leads with a 35.0% share in 2025, driven by industrial bases, renewable projects, and manufacturing clusters. North India and South India each hold 25.0%.
Leading companies include Hitachi Energy Ltd, Siemens Energy, GE Vernova, Bharat Heavy Electricals Limited, TOSHIBA CORPORATION, CG Power and Industrial Solutions Limited, and Voltamp Transformer, among others. They compete on capacity, voltage range, quality, and delivery.
The market is projected to reach approximately USD 3.35 Billion by 2030. By then, new factory capacity should ease supply constraints and extra-high-voltage transformers should account for a larger share of demand.
Key trends include manufacturing capacity expansion, growth of extra-high-voltage transformers, digital and smart transformers, and eco-friendly insulation. Online monitoring is also improving reliability and maintenance planning.
Need more help?
- Speak to our experienced analysts for insights on the current market scenarios.
- Include additional segments and countries to customize the report as per your requirement.
- Gain an unparalleled competitive advantage in your domain by understanding how to utilize the report and positively impacting your operations and revenue.
- For further assistance, please connect with our analysts.
 Request Customization
 Speak to an Analyst
 Request Brochure
 Inquire Before Buying
Benefits of Customization
- Personalize this research
- Triangulate with your data
- Get data as per your format and definition
- Gain a deeper dive into a specific application, geography, customer, or competitor
- Any level of personalization
Get in Touch With Us
UNITED STATES
Phone: +1-201-971-6302
INDIA
Phone: +91-120-433-0800
UNITED KINGDOM
Phone: +44-753-714-6104
Email: [email protected]
Client Testimonials























Related Reports

Choose your plan
*Please note that the prices mentioned below are starting prices for each bundle type. Kindly contact our team for further details.*
Single User License
- 1 User License, Access on 2 Devices
- PDF Report + Excel Dataset (Password Protected)
- Lifetime Access
- No Printing Rights
- 10% Free Report Customization
- 10–12 Weeks of Analyst Support
Five User License
- Access for 5 Users, 2 Devices per User
- PDF Report + Excel Dataset (Password Protected)
- Lifetime Access
- Dedicated Account Manager
- 12–14 Weeks of Analyst Support
- No Printing Rights
- 15% Free Report Customization
- 25% Discount on Your Next Purchase
Corporate User License
- Unlimited User Access (Within Your Organization)
- PDF Report + Excel Dataset
- Lifetime Access
- Dedicated Account Manager
- 14–20 Weeks of Analyst Support
- No Printing Rights
- 20% Free Report Customization
- 30% Discount on Your Next Purchase
Essential Insights
What's included:
3 reports
- Lifetime Access
- PDF Reports
- Excel Datasets
- 2 Weeks of Free Analyst Support
- 2 User Licenses
- Access on 2 Devices
- Printing Rights
- Complimentary PowerPoint (PPT) Version
- Complimentary License Upgrade
Professional Access
What's included:
5 reports
- Lifetime Access
- PDF Reports
- Excel Datasets
- 8 Weeks of Free Analyst Support
- 2 User Licenses
- Access on 2 Devices
- Printing Rights
- Complimentary PowerPoint (PPT) Version
- Complimentary License Upgrade
Business Advantage
What's included:
8 reports
- Lifetime Access
- PDF Reports
- Excel Datasets
- 14 Weeks of Free Analyst Support
- 2 User Licenses
- Access on 2 Devices
- Printing Rights
- Complimentary PowerPoint (PPT) Version
- Complimentary License Upgrade
Enterprise Intelligence
What's included:
10 reports
- Lifetime Access
- PDF Reports
- Excel Datasets
- 20 Weeks of Free Analyst Support
- 2 User Licenses
- Access on 2 Devices
- Printing Rights
- Complimentary PowerPoint (PPT) Version
- Complimentary License Upgrade