
Singapore Food Services Market Size, Share, Trends and Forecast by Type, Outlet, Location, and Region, 2026-2034
Singapore Food Services Market Size, Share, Trends & Forecast (2026-2034)
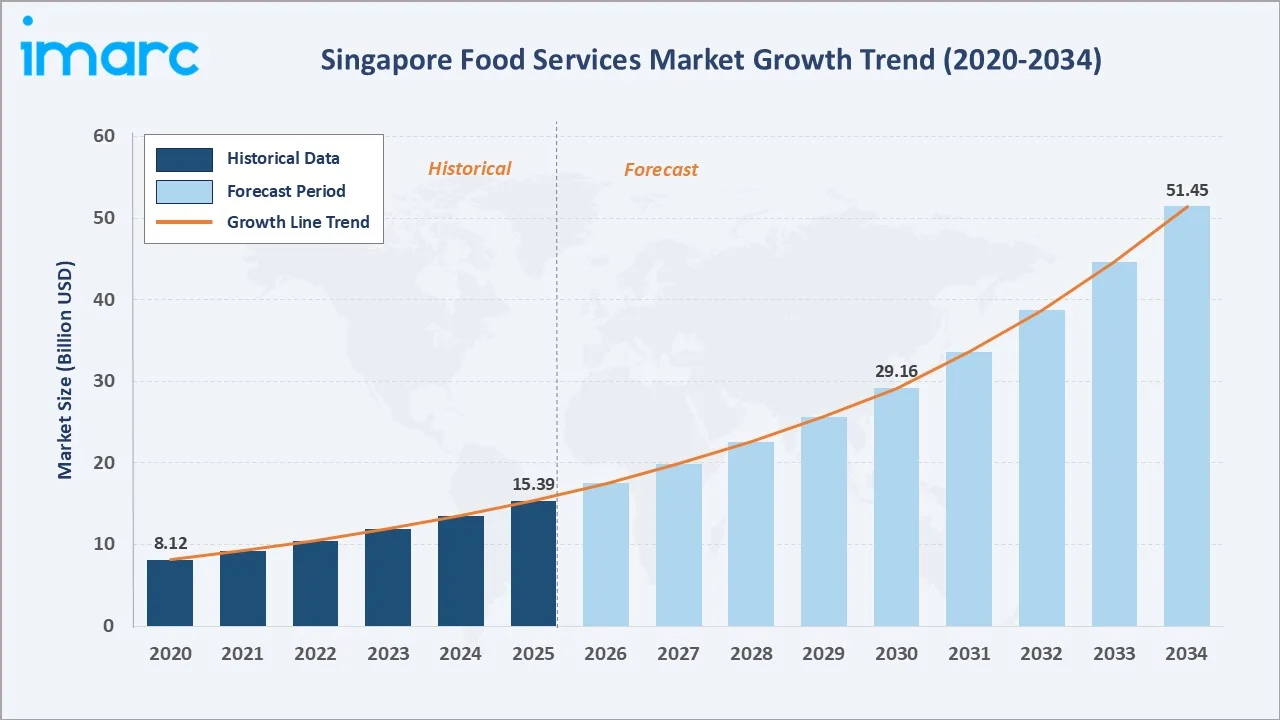
The Singapore food services market reached USD 15.39 Billion in 2025 and is projected to reach USD 51.45 Billion by 2034, growing at a CAGR of 13.63% during 2026-2034. The market is driven by rising disposable incomes, diverse culinary preferences, increasing demand for convenience and delivery services, tourism growth, and a thriving dining-out culture supported by innovative and tech-savvy dining experiences. Cloud kitchens focused exclusively on delivery and takeaway continue to proliferate across the island, reshaping outlet economics for both chained and independent operators. Independent Outlets dominate the outlet breakup at 67.4%, Standalone venues lead the location breakup at 31.8%, and the Central region commands 36.5% of the overall market.
Market Snapshot
|
Metric |
Value |
|
Market Size (2025) |
USD 15.39 Billion |
|
Forecast Market Size (2034) |
USD 51.45 Billion |
|
CAGR (2026-2034) |
13.63% |
|
Base Year |
2025 |
|
Historical Period |
2020-2025 |
|
Forecast Period |
2026-2034 |
|
Dominant Outlet |
Independent Outlets (67.4%, 2025) |
|
Dominant Location |
Standalone (31.8%, 2025) |
|
Leading Region |
Central (36.5%, 2025) |
The market expanded from USD 8.12 Billion in 2020 to USD 15.39 Billion in 2025 - nearly doubling in five years - anchored at USD 29.16 Billion in 2030 and forecast to reach USD 51.45 Billion by 2034. Pandemic-era dine-in restrictions constrained 2020 revenue, but the structural recovery in tourism, urban dining culture, and delivery adoption sustained double-digit growth through the historical period.
To get more information on this market, Request Sample
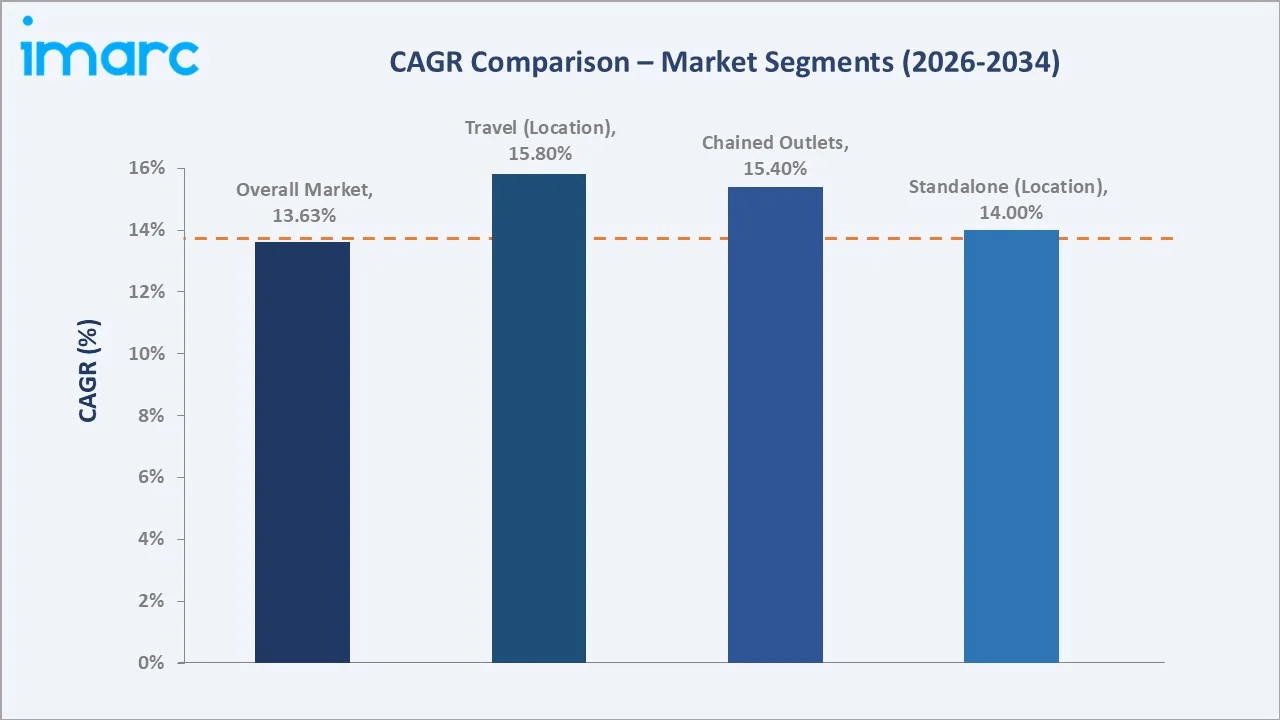
Travel locations grow fastest at approximately 15.8% CAGR as tourism recovery and rising airport and transit passenger volumes accelerate dining spend at transit hubs. Chained Outlets expand at approximately 15.4% CAGR as organized F&B groups scale digital ordering, loyalty, and delivery capabilities faster than independent operators.
Executive Summary
The Singapore food services market reached USD 15.39 Billion in 2025, representing one of Southeast Asia's most dynamic urban dining economies, driven by the city-state's dense multicultural population, high tourist footfall, and rapidly digitalizing delivery ecosystem. The market is projected to reach USD 51.45 Billion by 2034, delivering a 13.63% CAGR over the forecast period.
Independent Outlets at 67.4% dominate through the sheer volume of hawker stalls, cafes, and small independent restaurants across Singapore's neighbourhoods, sustained by strong local patronage and cultural attachment to hawker centre dining. Standalone locations at 31.8% lead the location breakup through dedicated street-front and neighbourhood dining establishments that remain the preferred format for both full-service and quick-service operators. Central region at 36.5% leads regionally through its dense concentration of central business district offices, shopping malls, and tourist landmarks that sustain elevated daily footfall and premium dining spend.
Key Market Insights
|
Insight |
Data |
|
Dominant Outlet |
Independent Outlets - 67.4% share (2025) |
|
Dominant Location |
Standalone - 31.8% market share (2025) |
|
Leading Region |
Central - 36.5% market share (2025) |
|
Market Opportunity |
Cloud kitchen scale-up; digital ordering integration; sustainable and plant-based dining; premium experiential formats |
Key Analytical Observations Supporting the Above Data:
- Independent Outlets at 67.4%: Independent Outlets dominate as Singapore's dense hawker centre and neighbourhood cafe culture sustains a large base of small, owner-operated establishments that continue to draw loyal local patronage.
- Standalone at 31.8%: Standalone venues dominate location share as street-front restaurants and cafes remain the preferred format for full-service and quick-service dining across residential and commercial districts.
- Central at 36.5%: Central region leads through its dense concentration of central business district offices, shopping malls, and tourist landmarks, which sustain high daily footfall and premium dining spend.
Singapore Food Services Market Overview
The Singapore food services market encompasses the design, delivery, and operation of all dining formats across the island, including cafes and bars, cloud kitchens, full-service restaurants, and quick service restaurants, spanning chained and independent outlets operating across leisure, lodging, retail, standalone, and travel locations.
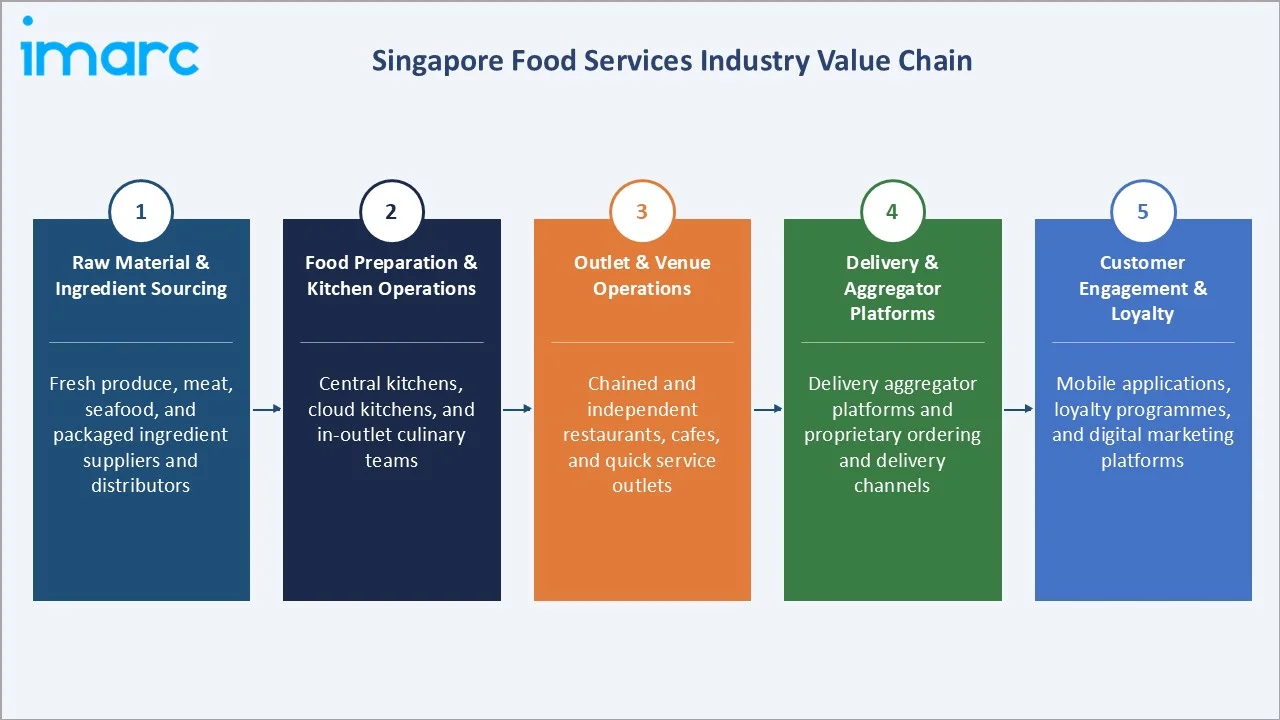
The ecosystem integrates ingredient and raw material suppliers, food preparation and central kitchen operators, chained and independent outlet operators, delivery aggregator platforms, and consumer-facing loyalty and engagement channels. Macroeconomic factors include rising disposable incomes, government initiatives promoting innovation and hygiene standards, growing urbanization, and continued investment in tourism and hospitality infrastructure across Singapore.
Singapore's compact geography and dense urban planning place outlets within proximity of residential, commercial, and transit catchments, supporting high outlet density relative to population and sustaining consistent footfall across chained and independent formats alike. This unique urban structure differentiates Singapore from larger regional food services markets where geographic dispersion limits outlet accessibility.
Market Dynamics
To evaluate market opportunities, Request Sample
Market Drivers
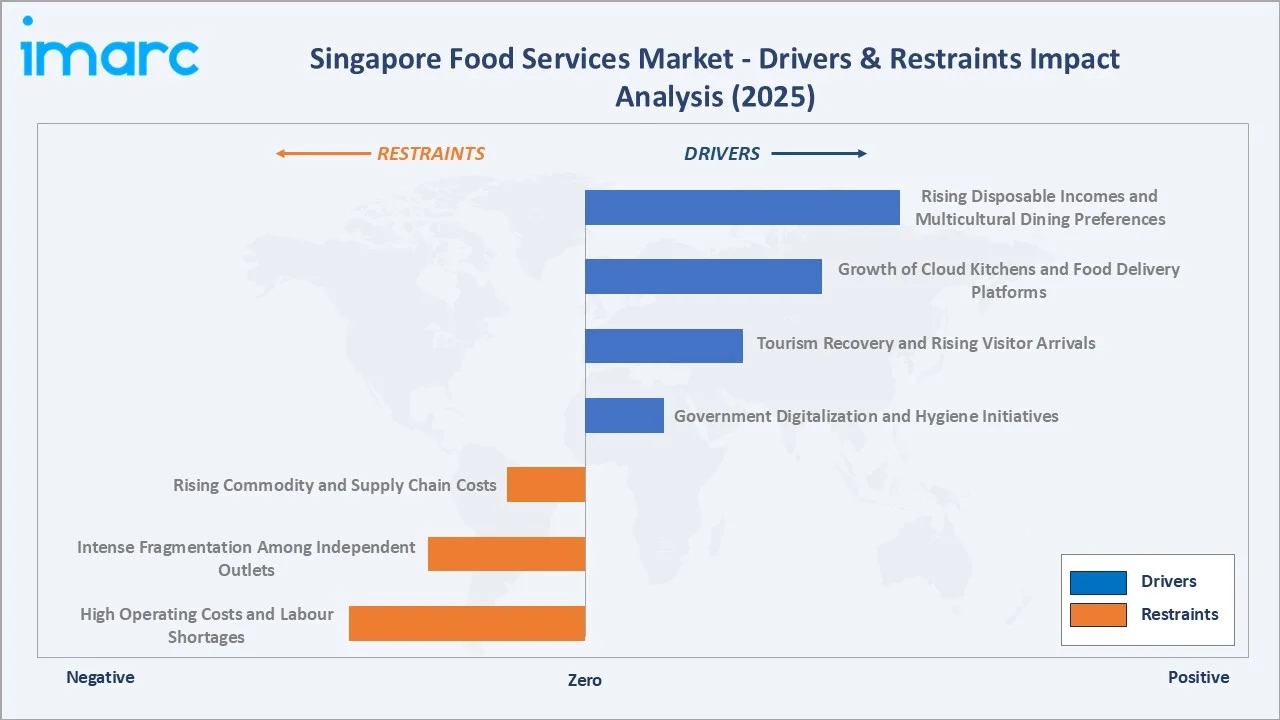
- Rising Disposable Incomes and Multicultural Dining Preferences: Rising disposable incomes and a dynamic multicultural population are broadening demand for diverse cuisines and elevating average dining spend across chained and independent outlets alike. Higher household spending power is encouraging more frequent dining out, particularly among younger urban professionals who prioritize convenience and variety over home cooking. This trend is further reinforced by Singapore's status as a regional business hub, which continues to draw expatriate residents whose culinary preferences broaden overall menu diversity.
- Growth of Cloud Kitchens and Food Delivery Platforms: Cloud kitchens and delivery aggregators are lowering entry barriers for new concepts while expanding convenience-led demand beyond traditional dine-in formats. Operators are increasingly launching delivery-only virtual brands that share existing kitchen infrastructure, reducing capital intensity while testing new menu concepts with minimal risk. Rising smartphone penetration and app-based ordering continue to normalize online food purchasing across all age groups, sustaining structural growth in delivery volumes.
- Tourism Recovery and Rising Visitor Arrivals: Recovering international visitor arrivals and airport passenger volumes are lifting demand across travel and leisure locations, benefiting hawker centres, cafes, and full-service restaurants. Singapore's positioning as a regional aviation and cruise hub continues to channel high-spending international tourists directly into travel and leisure-linked dining catchments. Government-backed tourism marketing campaigns showcasing hawker culture and fine dining are reinforcing Singapore's reputation as a culinary destination for international visitors.
- Government Digitalization and Hygiene Initiatives: Government programmes such as the Food Services Industry Transformation Map are funding digitalization, automation, and hygiene upgrades, strengthening consumer confidence and operator productivity. Grants supporting point-of-sale digitalization and kitchen automation are helping smaller independent operators offset rising labour costs while improving service consistency. Continued enforcement of stringent food safety standards by the Singapore Food Agency sustains high consumer trust in both hawker and formal dining establishments.
Market Restraints
- High Operating Costs and Labour Shortages: Elevated rental and manpower costs, compounded by persistent labour shortages, are compressing operating margins for both chained and independent food service operators. Reliance on foreign manpower quotas for kitchen and service staff continues to constrain flexible scaling, particularly for smaller independent establishments with thinner margins. Rising minimum wage requirements under Singapore's Progressive Wage Model are adding further cost pressure across the labour-intensive food services sector.
- Intense Fragmentation Among Independent Outlets: The high proportion of independent outlets sustains intense price-based competition, limiting pricing power and slowing consolidation across the market. Low barriers to entry for small hawker stalls and cafes continue to attract new independent operators, further diluting market share among existing incumbents. This fragmentation limits economies of scale in procurement and marketing that larger chained operators are able to capture.
- Rising Commodity and Supply Chain Costs: Volatile commodity and import costs for key ingredients are pressuring menu pricing and squeezing already thin operator margins. Singapore's heavy reliance on imported food ingredients exposes operators to global commodity price swings and currency fluctuations beyond their direct control. Extreme weather events and geopolitical disruptions to global food supply chains continue to introduce additional cost volatility for ingredient-dependent menu categories.
Market Opportunities
- Sustainable and Plant-Based Dining Formats: Rising consumer preference for organic, plant-based, and ethically sourced menus is opening avenues for differentiated dining concepts. Operators that transparently disclose ingredient sourcing and nutritional content are increasingly able to command premium pricing among health-conscious urban consumers. Partnerships with local urban farms and sustainable seafood suppliers present opportunities to strengthen brand differentiation while reducing carbon footprint.
- Technology-Enabled Personalization: Data analytics and mobile loyalty platforms allow operators to personalize offers, improving retention and per-visit spend. Artificial intelligence-driven recommendation engines embedded within ordering apps are enabling operators to upsell effectively while improving customer satisfaction. Loyalty programme data is increasingly being used to optimize menu engineering and promotional timing across both chained and independent outlets.
Market Challenges
- Labour Shortages in Food Service Operations: Persistent shortages of frontline kitchen and service staff are pushing operators toward automation and self-service formats. High staff turnover in entry-level food service roles continues to raise recruitment and training costs across both chained and independent establishments. Competition for manpower from other service sectors further tightens the available labour pool for food service operators.
- Rising Rental Costs in Prime Locations: Elevated rents in prime retail and standalone locations continue to challenge new outlet economics and expansion pace. Limited availability of ground-floor retail space in high-footfall districts is intensifying competition for prime dining locations among both local and international operators. Rising rental costs are prompting some operators to shift toward smaller-format outlets or delivery-only cloud kitchen models to manage overheads.
Emerging Market Trends
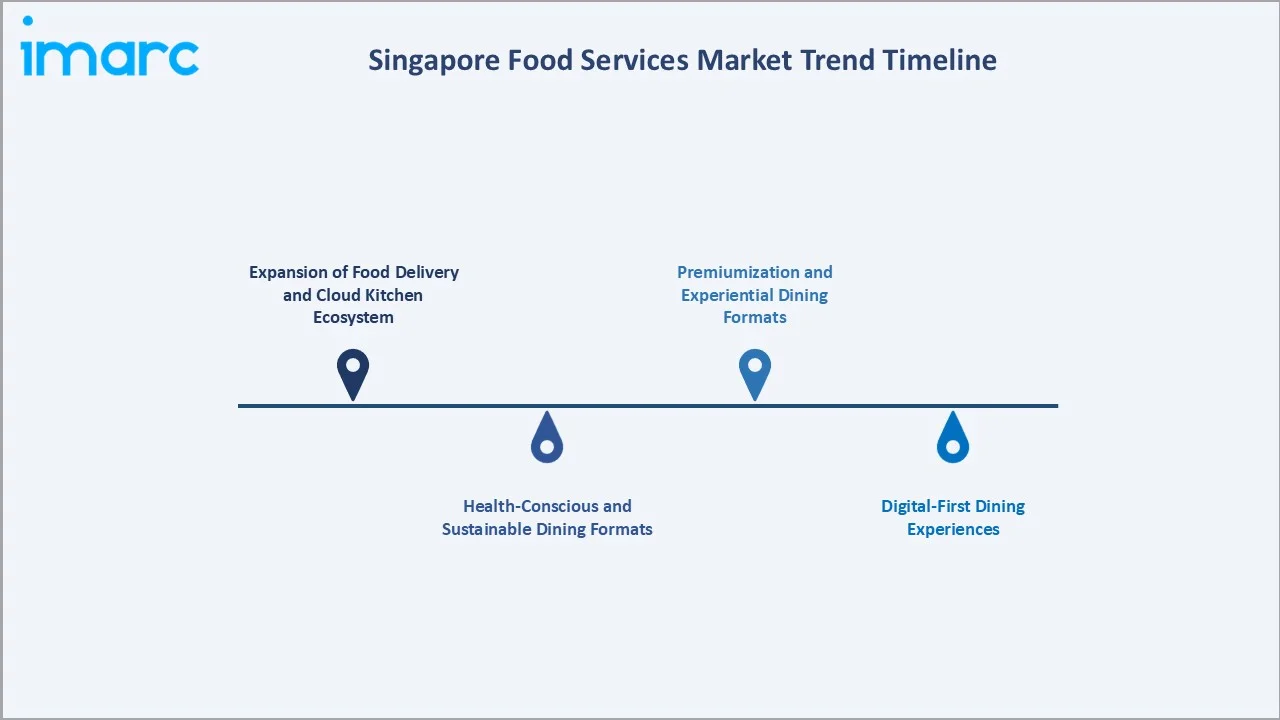
Singapore food delivery market trends continue to reshape the food services industry Singapore-wide, as cloud kitchens, app-based ordering, and data-driven personalization redefine how operators reach and retain diners across chained and independent formats.
1. Expansion of Food Delivery and Cloud Kitchen Ecosystem
Cloud kitchens focused exclusively on delivery are proliferating as operators seek asset-light expansion. Rising online ordering penetration, accelerated since the pandemic, continues to reshape outlet economics across chained and independent formats. A survey conducted by Deliveroo found that most respondents use food delivery daily, with most expecting increased usage in the year ahead, reflecting consumers' growing appreciation for the security and convenience of home and workplace delivery.
2. Health-Conscious and Sustainable Dining Formats
Consumers are increasingly seeking nutritious, organic, and sustainably sourced menus. Restaurants are responding with locally sourced ingredients, transparent nutritional labelling, and plant-based menu expansion, reflecting growing awareness of both personal health and environmental sustainability among Singaporean diners.
3. Digital-First Dining Experiences
Contactless payments, digital menus, and AI-driven personalization are becoming standard, with operators using data analytics to tailor offers, streamline kitchen workflows, and reduce waste. Mobile apps and loyalty programmes are becoming increasingly sophisticated, offering tailored promotions and rewards to frequent diners.
4. Premiumization and Experiential Dining Formats
Fusion cuisine and unique, Instagram-worthy dining experiences are gaining popularity as brands use creativity and technology to stand out in an increasingly competitive market. Premiumization is a growing trend, with customers willing to pay more for artisanal, gourmet, and ethically sourced dishes, while operators invest in immersive interiors and curated menu storytelling to differentiate standalone and retail outlets.
Industry Value Chain Analysis
The Singapore food services value chain integrates raw material and ingredient sourcing, food preparation and kitchen operations, outlet and venue operations across chained and independent formats, delivery and aggregator platforms, and customer engagement and loyalty channels.
|
Stage |
Key Participants |
|
Raw Material & Ingredient Sourcing |
Fresh produce, meat, seafood, and packaged ingredient suppliers and distributors |
|
Food Preparation & Kitchen Operations |
Central kitchens, cloud kitchens, and in-outlet culinary teams |
|
Outlet & Venue Operations |
Chained and independent restaurants, cafes, and quick service outlets |
|
Delivery & Aggregator Platforms |
Delivery aggregator platforms and proprietary ordering and delivery channels |
|
Customer Engagement & Loyalty |
Mobile applications, loyalty programmes, and digital marketing platforms |
Technology Landscape in the Singapore Food Services Industry
Cloud Kitchen and Delivery Aggregator Technology
Cloud kitchen platforms and delivery aggregator integrations are enabling operators to launch delivery-only concepts with minimal capital, expanding reach beyond physical outlet footprints while sharing kitchen infrastructure across multiple virtual brands.
AI-Powered Personalization and Loyalty Platforms
Operators are deploying data analytics and AI-driven recommendation engines within mobile loyalty apps to customize promotions and improve customer retention, using purchase history to tailor menu suggestions and targeted offers.
Contactless Payment and Self-Order Kiosk Technology
Self-order kiosks, QR-based digital menus, and contactless payment systems are streamlining service, reducing wait times, and addressing labour shortages across both quick service and full-service outlets. Modern kitchen technology is also optimizing workflows, raising productivity, and cutting waste, with automated systems for inventory management and food preparation helping operators maintain consistency and quality while minimizing costs.
Market Segmentation Analysis
The report covers the following segments:
|
Segment Category |
Leading Segment |
Market Share |
Year |
|
Type |
🔒 |
🔒 |
2025 |
|
Outlet |
Independent Outlets |
67.4% |
2025 |
|
Location |
Standalone |
31.8% |
2025 |
|
Region |
Central |
36.5% |
2025 |

By Outlet
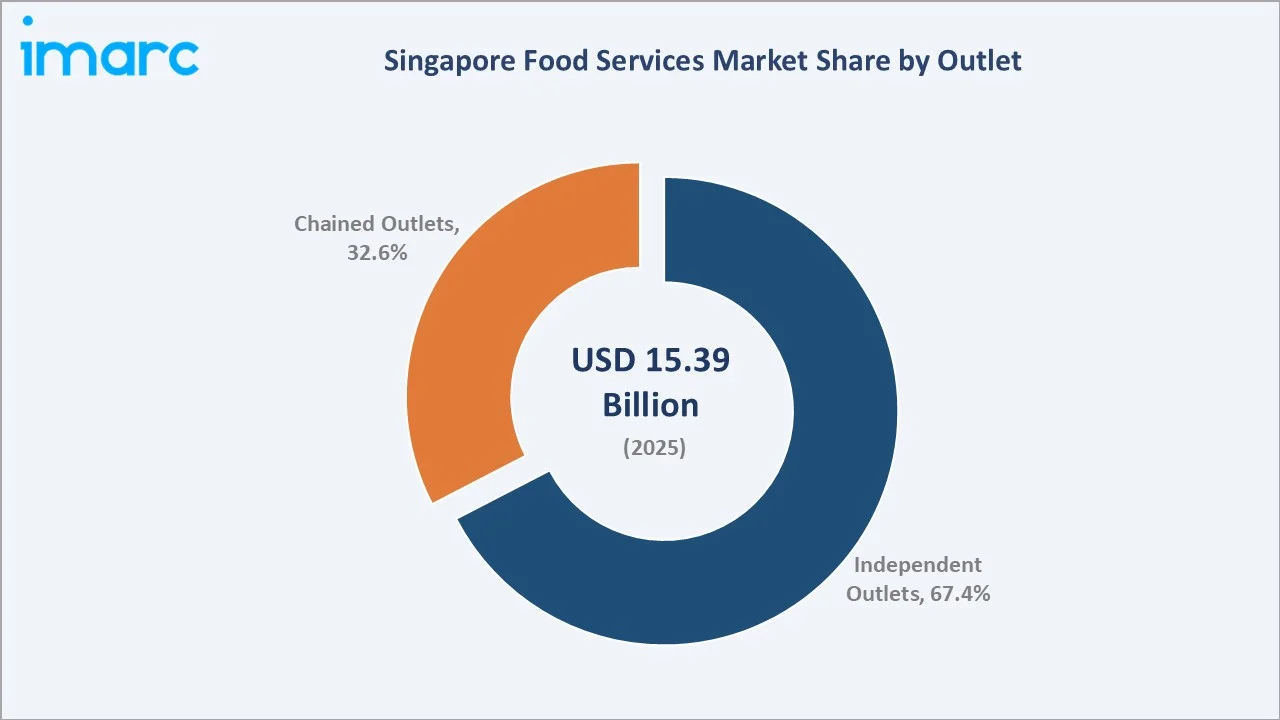
Independent Outlets lead at 67.4% in 2025, reflecting Singapore's dense hawker centre and neighbourhood cafe culture that sustains a large base of owner-operated establishments with strong local patronage.
To access detailed market analysis, Request Sample
Chained Outlets at 32.6% are expanding through franchise and multi-brand strategies, growing faster than independents at approximately 15.4% CAGR as organized F&B groups scale delivery and digital capabilities.
By Location
Standalone venues lead at 31.8%, followed by Retail at 24.7%, reflecting the popularity of street-front dining and mall-based food courts across Singapore's dense urban landscape.
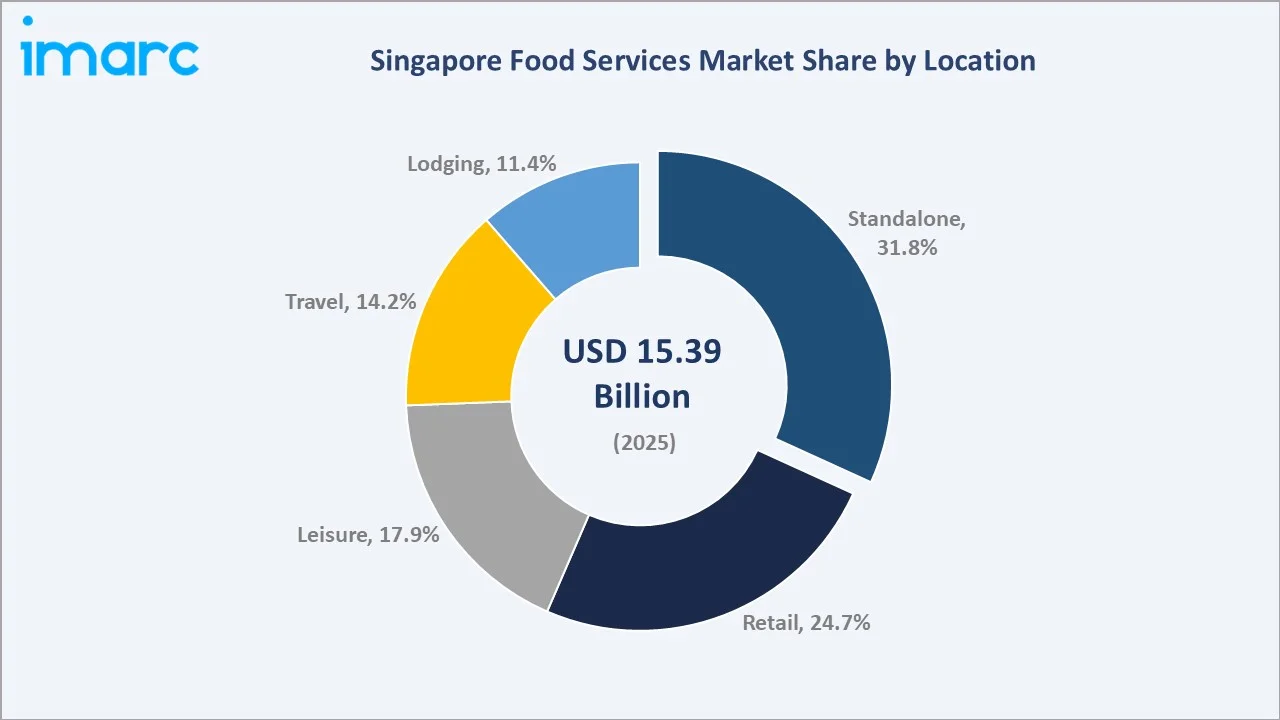
Leisure at 17.9% and Travel at 14.2% capture tourism-linked dining, while Lodging at 11.4% reflects hotel-based food service demand from both residents and international visitors.
Regional Market Insights
|
Region |
Share (2025) |
Key Market Drivers & Characteristics |
|
Central |
36.5% |
Dense CBD offices, shopping malls, and tourist landmarks driving high footfall and premium dining spend |
|
North-East |
19.8% |
Growing residential density and expanding mall-based food court networks |
|
West |
17.2% |
Industrial and residential growth supporting neighbourhood dining and quick service demand |
|
East |
14.6% |
Airport proximity and coastal leisure attractions supporting travel and leisure dining |
|
North |
11.9% |
Emerging residential townships driving steady standalone and retail dining growth |
Central, at 36.5%, leads through Singapore's core business district and premier retail and tourism catchments, sustaining the highest concentration of full-service and premium dining establishments. North-East, at 19.8%, reflects steadily rising residential dining demand supported by expanding heartland malls and transit-linked food courts.
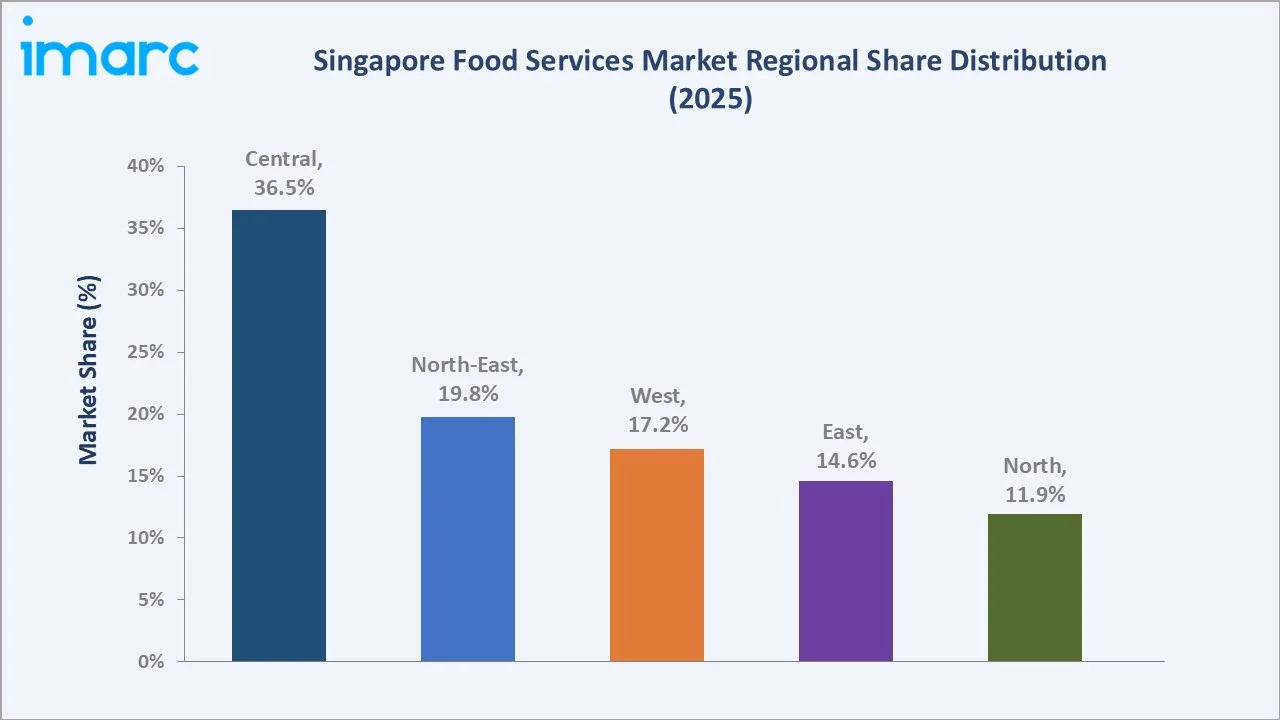
West, at 17.2%, and East, at 14.6%, represent balanced industrial-residential and travel-linked dining catchments respectively, while North, at 11.9%, reflects an early-stage but growing dining market supported by emerging residential townships.
Competitive Landscape
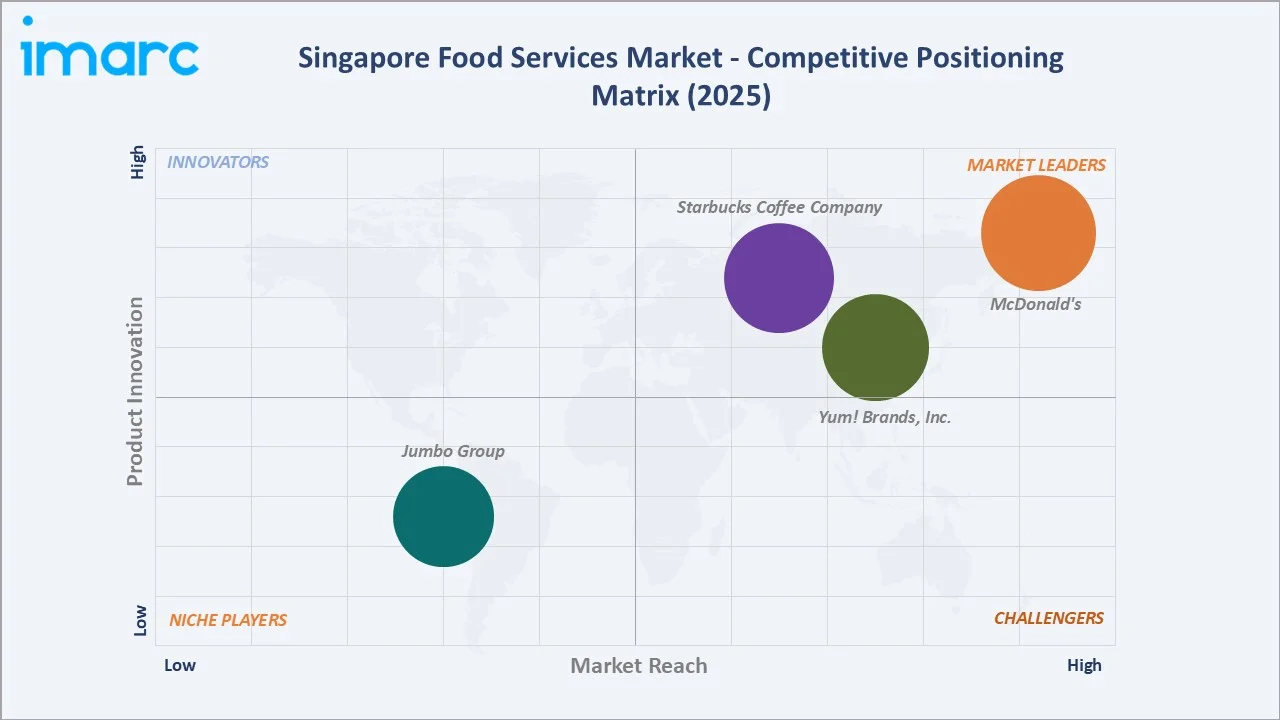
The Singapore food services competitive landscape is highly fragmented, with global quick service and coffee chains competing alongside homegrown F&B conglomerates and independent restaurant groups across chained and independent outlet formats.
|
Company Name |
Key Products |
Market Position |
Core Strength |
|
McDonald's |
Burgers, McCafe beverages, breakfast menu, Desserts, Salads & Wraps |
Market Leader |
Extensive outlet network and strong digital ordering and delivery integration. |
|
Yum! Brands, Inc. |
KFC fried chicken, Pizza Hut pizza |
Market Leader |
Multi-brand QSR portfolio with deep franchise penetration across Singapore. |
|
Starbucks Coffee Company |
Specialty coffee, tea, and food pairings |
Market Leader |
Premium coffeehouse format with strong brand loyalty and store experience. |
|
Jumbo Group |
Chilli crab and seafood dining |
Niche Player |
Iconic homegrown seafood restaurant brand with strong tourist appeal. |
Key players include McDonald's, Yum! Brands, Inc., Starbucks Coffee Company, Jumbo Group, and others.
Key Company Profiles
McDonald's
McDonald's is a global quick service restaurant chain with an extensive outlet network across Singapore, spanning standalone, retail, and travel locations.
- Key Products: Burgers, McCafe beverages, breakfast menu, Desserts, Salads & Wraps
- Strategic Focus: Expanding digital ordering, delivery partnerships, and drive-thru formats to capture rising convenience-oriented dining demand. The company continues to localize its menu with region-specific offerings while maintaining consistent service standards across its franchise network. Investment in kitchen automation and digital loyalty programmes remains central to its strategy for improving throughput and customer retention.
Jumbo Group
Jumbo Group is a homegrown Singapore restaurant group renowned for its chilli crab and seafood dining concepts, with strong appeal among domestic and tourist diners.
- Key Products: Chilli crab, black pepper crab, and other signature seafood dishes
- Strategic Focus: Growing brand presence in leisure and tourism catchments while diversifying into packaged retail seafood products. The group is pursuing regional expansion opportunities across Southeast Asia and China to build on the strength of its homegrown brand equity. Continued investment in packaged and ready-to-cook retail products aims to extend the Jumbo brand beyond its core restaurant footprint.
Market Concentration Analysis
The Singapore food services market is highly fragmented at the outlet level, with Independent Outlets accounting for 67.4% of revenue. Global QSR and coffee chains collectively hold a meaningful share of Chained Outlet revenue, while homegrown groups compete across bakery, food court, and specialty dining formats. Market concentration is expected to rise gradually as chained operators scale digital and delivery capabilities faster than independents, though the sheer volume of hawker stalls and small independent restaurants will likely preserve a fragmented structure through the forecast period.
The competitive landscape is being actively reshaped by delivery aggregator partnerships and cloud kitchen adoption. Each new delivery-only virtual brand launched by an existing chained operator adds incremental competitive pressure on independent outlets, while the scale of overall market growth continues to create expansion room for both chained and independent operators through the forecast period.
Investment & Growth Opportunities
Highest Growth Segments
Travel locations (approximately 15.8% CAGR), Chained Outlets (approximately 15.4% CAGR), and Standalone locations (approximately 14.0% CAGR) represent the highest-growth investment vectors through 2034, as tourism recovery and organized F&B expansion continue to outpace overall market growth.
Emerging Investment Opportunities
Cloud kitchen infrastructure represents a high-value emerging opportunity, allowing operators to scale delivery-only concepts with lower capital intensity than traditional standalone outlets, particularly across retail and residential catchments where rental costs continue to rise.
Investment Themes
- Digital Ordering and Delivery Technology: Investment in delivery aggregator integration and proprietary ordering apps creates a durable convenience advantage as online ordering penetration continues rising across Singapore.
- Sustainable Sourcing Partnerships: Operators investing in sustainably sourced and locally grown ingredients can capture rising consumer willingness to pay for ethically sourced dining experiences.
Future Market Outlook (2026-2034)
The Singapore food services market is projected to grow from USD 15.39 Billion in 2025 to USD 51.45 Billion by 2034, delivering a 13.63% CAGR over the forecast period. The market's anchor value of USD 29.16 Billion in 2030 represents the food services industry at its most transformative digital inflection, as cloud kitchens, digital-first dining, and sustainable menu formats become mainstream. Chained outlets and travel-linked dining are expected to continue outpacing overall market growth through the forecast period, while independent outlets retain their majority revenue share through sustained hawker centre and neighbourhood dining culture.
Research Methodology
Primary Research
Primary research comprised structured interviews with industry stakeholders, including restaurant operators, F&B group executives, delivery aggregator representatives, and hospitality consultants across Singapore.
Secondary Research
Secondary research encompassed company annual reports, Singapore Tourism Board data, Ministry of Trade and Industry statistics, Singapore Food Agency publications, industry association reports, and official Singapore food statistics 2025 releases covering outlet, location, and regional performance.
Forecasting Models
Market revenue forecasts were developed using a bottom-up model incorporating outlet count by type, average revenue per outlet, and location-based demand multipliers adjusted for tourism recovery and digitalization trends.
Singapore Food Services Market Report Coverage:
| Report Features | Details |
|---|---|
| Base Year of the Analysis | 2025 |
| Historical Period | 2020-2025 |
| Forecast Period | 2026-2034 |
| Units | Billion USD |
| Scope of the Report | Exploration of Historical Trends and Market Outlook, Industry Catalysts and Challenges, Segment-Wise Historical and Future Market Assessment:
|
| Types Covered |
|
| Outlets Covered | Chained Outlets, Independent Outlets |
| Locations Covered | Leisure, Lodging, Retail, Standalone, Travel |
| Regions Covered | North-East, Central, West, East, North |
| Companies Covered | McDonald's, Yum! Brands, Inc, Starbucks Coffee Company, Jumbo Group, etc. |
| Customization Scope | 10% Free Customization |
| Post-Sale Analyst Support | 10-12 Weeks |
| Delivery Format | PDF and Excel through Email (We can also provide the editable version of the report in PPT/Word format on special request) |
Key Benefits for Stakeholders:
- IMARC’s industry report offers a comprehensive quantitative analysis of various market segments, historical and current market trends, market forecasts, and dynamics of the Singapore food services market from 2020-2034.
- The research report provides the latest information on the market drivers, challenges, and opportunities in the Singapore food services market.
- Porter's five forces analysis assist stakeholders in assessing the impact of new entrants, competitive rivalry, supplier power, buyer power, and the threat of substitution. It helps stakeholders to analyze the level of competition within the Singapore food services industry and its attractiveness.
- Competitive landscape allows stakeholders to understand their competitive environment and provides an insight into the current positions of key players in the market.
Frequently Asked Questions About the Singapore Food Services Market Report
The Singapore food services market reached USD 15.39 Billion in 2025, driven by Independent Outlets dominant at 67.4%, Standalone locations leading at 31.8%, Central region commanding 36.5% market share, and continued expansion of cloud kitchens and delivery platforms across the island.
The Singapore food services market grows at 13.63% CAGR during 2026-2034, reaching USD 51.45 Billion by 2034. This growth reflects rising disposable incomes, tourism recovery, expanding delivery ecosystem penetration, and continued government-backed digitalization support for the sector.
Independent Outlets lead at 67.4%, capturing Singapore's dense hawker centre and neighbourhood cafe culture. This segment grows through sustained local patronage even as Chained Outlets at 32.6% expand faster at approximately 15.4% CAGR through franchise scale-up.
Standalone locations lead at 31.8% through the highest per-outlet dining volume and broad neighbourhood coverage, creating sustained procurement expansion. Standalone grows through steady street-front dining demand, while Travel locations grow fastest at approximately 15.8% CAGR through tourism recovery.
Central leads at 36.5% through Singapore's core business district offices, premier shopping malls, and tourist landmarks that sustain the highest daily footfall and premium dining spend across the island.
Leading companies include McDonald's, Yum! Brands, Inc., Starbucks Coffee Company, Jumbo Group, and others.
The Singapore food services market is projected to reach approximately USD 29.16 Billion by 2030, with cloud kitchen infrastructure becoming a standard specification for new delivery-focused concepts, digital ordering adoption reaching mainstream penetration, and sustainable dining formats gaining broader traction.
Three priority investment opportunities: cloud kitchen infrastructure for delivery-only concepts, digital ordering and delivery aggregator technology integration, and sustainable sourcing partnerships with local and regional suppliers.
Need more help?
- Speak to our experienced analysts for insights on the current market scenarios.
- Include additional segments and countries to customize the report as per your requirement.
- Gain an unparalleled competitive advantage in your domain by understanding how to utilize the report and positively impacting your operations and revenue.
- For further assistance, please connect with our analysts.
 Request Customization
 Speak to an Analyst
 Request Brochure
 Inquire Before Buying
Benefits of Customization
- Personalize this research
- Triangulate with your data
- Get data as per your format and definition
- Gain a deeper dive into a specific application, geography, customer, or competitor
- Any level of personalization
Get in Touch With Us
UNITED STATES
Phone: +1-201-971-6302
INDIA
Phone: +91-120-433-0800
UNITED KINGDOM
Phone: +44-753-714-6104
Email: [email protected]
Client Testimonials




.webp)




.webp)













Related Reports

Choose your plan
*Please note that the prices mentioned below are starting prices for each bundle type. Kindly contact our team for further details.*
Single User License
- 1 User License, Access on 2 Devices
- PDF Report + Excel Dataset (Password Protected)
- Lifetime Access
- No Printing Rights
- 10% Free Report Customization
- 10–12 Weeks of Analyst Support
Five User License
- Access for 5 Users, 2 Devices per User
- PDF Report + Excel Dataset (Password Protected)
- Lifetime Access
- Dedicated Account Manager
- 12–14 Weeks of Analyst Support
- No Printing Rights
- 15% Free Report Customization
- 25% Discount on Your Next Purchase
Corporate User License
- Unlimited User Access (Within Your Organization)
- PDF Report + Excel Dataset
- Lifetime Access
- Dedicated Account Manager
- 14–20 Weeks of Analyst Support
- No Printing Rights
- 20% Free Report Customization
- 30% Discount on Your Next Purchase
Essential Insights
What's included:
3 reports
- Lifetime Access
- PDF Reports
- Excel Datasets
- 2 Weeks of Free Analyst Support
- 2 User Licenses
- Access on 2 Devices
- Printing Rights
- Complimentary PowerPoint (PPT) Version
- Complimentary License Upgrade
Professional Access
What's included:
5 reports
- Lifetime Access
- PDF Reports
- Excel Datasets
- 8 Weeks of Free Analyst Support
- 2 User Licenses
- Access on 2 Devices
- Printing Rights
- Complimentary PowerPoint (PPT) Version
- Complimentary License Upgrade
Business Advantage
What's included:
8 reports
- Lifetime Access
- PDF Reports
- Excel Datasets
- 14 Weeks of Free Analyst Support
- 2 User Licenses
- Access on 2 Devices
- Printing Rights
- Complimentary PowerPoint (PPT) Version
- Complimentary License Upgrade
Enterprise Intelligence
What's included:
10 reports
- Lifetime Access
- PDF Reports
- Excel Datasets
- 20 Weeks of Free Analyst Support
- 2 User Licenses
- Access on 2 Devices
- Printing Rights
- Complimentary PowerPoint (PPT) Version
- Complimentary License Upgrade