
United States Copper Sulphate Market Size, Share, Trends and Forecast by End Use, and Region, 2026-2034
United States Copper Sulphate Market Size and Share:
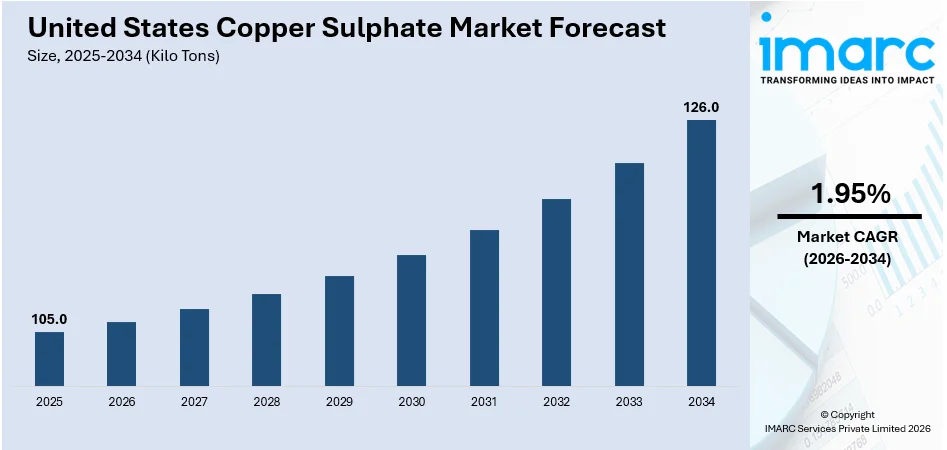
The United States copper sulphate market size was valued at 105.0 Kilo Tons in 2025. Looking forward, IMARC Group estimates the market to reach 126.0 Kilo Tons by 2034, exhibiting a CAGR of 1.95% from 2026-2034. The United States copper sulphate market size is growing significantly due to its extensive use in agriculture as a fungicide and pesticide, effectively controlling fungal diseases and pests, the mining industry's demand for copper sulfate in ore flotation processes and the chemical industry's utilization in producing various chemicals, dyes, and pigments.
|
Report Attribute
|
Key Statistics
|
|---|---|
|
Base Year
|
2025
|
|
Forecast Years
|
2026-2034
|
|
Historical Years
|
2020-2025
|
|
Market Size in 2025
|
105.0 Kilo Tons |
|
Market Forecast in 2034
|
126.0 Kilo Tons |
| Market Growth Rate (2026-2034) | 1.95% |
The market in the United States is primarily driven by the widespread production application in agriculture, particularly as a fungicide and soil amendment in crop production. Moreover, an increasing demand for high-yield agricultural practices has bolstered the use of copper sulfate to address nutrient deficiencies and improve soil fertility. Additionally, the country’s enhanced emphasis on sustainable water management and maintaining ecological balance in reservoirs and aquatic ecosystems is driving the demand for copper sulfate as an effective algaecide in water treatment applications, thereby fostering the growth of the copper sulphate market in the United States. For instance, on December 19, 2024, the Bureau of Reclamation announced it is allocating nearly USD 12.1 Million to support 43 collaborative planning and design projects that focus on improving water sustainability and efficiency across 11 states. Funding for these projects comes from the Bipartisan Infrastructure Law, Inflation Reduction Act, and annual appropriations through Reclamation's WaterSMART program, which will help partners develop projects to improve water management and drought resiliency. The selected projects cover states including New Mexico, Oregon, California, Colorado, Hawaii, Idaho, Nevada, Texas, Utah, Washington, and Wyoming.
To get more information on this market Request Sample
The industrial sector is another significant driver for the U.S. copper sulfate industry, which is used in electroplating, mining, and chemical production. Furthermore, an increasing demand for efficient metal refining and growing adoption of copper sulfate in the electronics industry are key significant factors that are fostering the market forward. Moreover, its application in pigment production, catalysts, and as a reagent in laboratories ensures steady demand. This, in turn, supports the United States copper sulphate market trend, as the U.S. focuses heavily on research and development of advanced material applications.
United States Copper Sulphate Market Trends:
Expansion in Organic Farming Practices
The increasing usage of organic farming practices has a significant impact on the U.S. Copper Sulphate market growth. For instance, on May 15, 2024, the U.S. Department of Agriculture (USDA) announced new programs and partnerships to facilitate producers' transition to organic farming. These initiatives, part of the USD 300 Million Organic Transition Initiative, aim to provide comprehensive support, including technical assistance, mentorship, and financial resources, to farmers shifting to organic production. The USDA's efforts are expected to improve the adoption of organic farming practices, potentially increasing the demand for inputs like copper sulfate, commonly used in organic agriculture for disease control and soil amendment. As copper sulfate is considered one of the primary agents in organic agriculture, it serves as a fungicide and bactericide to eliminate various diseases among crops. With consumers demanding more and more organic produce, farmers are utilizing copper sulfate to ensure sustainable, chemical-free farming. The trend is further supported by government subsidies and awareness programs on organic farming. As a result, the demand for copper sulfate in eco-friendly farming methods is expected to grow steadily, thereby driving the market's development.
Increasing Applications in Aquaculture
Growing demands in aquaculture for fish farming to fight algae and parasitic infestation are shaping U.S. copper sulphate market outlook. Copper sulphate is needed to maintain desirable water quality during aquaculture, especially amid rising seafood requirements. Improving aquaculture practices and sustainability awareness in proper fish farming help catalyze consumption. Additionally, strict environmental regulations necessitate effective water treatment solutions, further driving its usage. For instance, On April 10, 2024, the U.S. Environmental Protection Agency (EPA) announced its first-ever national, legally enforceable regulations for per- and polyfluoroalkyl substances (PFAS) in drinking water, setting Maximum Contaminant Levels (MCLs) for PFOA and PFOS at 4 parts per trillion (ppt), a significant reduction from the previous advisory level of 70 ppt. These stringent standards are designed to address PFAS contamination, protect public health, and improve environmental integrity across the United States. The EPA also announced nearly USD 1 Billion in new funding to help communities address PFAS contamination, as part of a larger USD 9 Billion investment for impacted areas. These factors highlight the crucial role of copper sulfate in ensuring sustainable aquaculture practices, contributing to its long-term market potential.
Technological Advancements in Industrial Applications
Technological advancement in industrial process is positively contributing to the U.S. copper sulphate market forecast. For instance, on January 5, 2025, the Biden-Harris Administration announced its USD 285 Million award to the Semiconductor Research Corporation Manufacturing Consortium Corporation, SRC, to create a CHIPS Manufacturing USA institute in Durham, North Carolina. The work at this new institute will focus on advancing the use of digital twin technology for improvement of semiconductor manufacturing processes. Additionally, electroplating, textile, and chemical industries are increasingly adopting copper sulfate as it is an efficient and effective agent. With the recent nanotechnology and material science advancements, it has become a significant application in the catalyst preparation of advanced materials and specialty materials. Moreover, with the growth of green technologies in industrial processes, the demand for green chemicals, such as copper sulfate, is increasing. These advancements are expected to significantly improve the market's performance, fostering greater adoption in diverse industrial segments.
United States Copper Sulphate Industry Segmentation:
IMARC Group provides an analysis of the key trends in each segment of the United States copper sulphate market, along with forecasts at the country and regional levels from 2026-2034. The market has been categorized based on end use.
Analysis by End Use:
Access the comprehensive market breakdown Request Sample
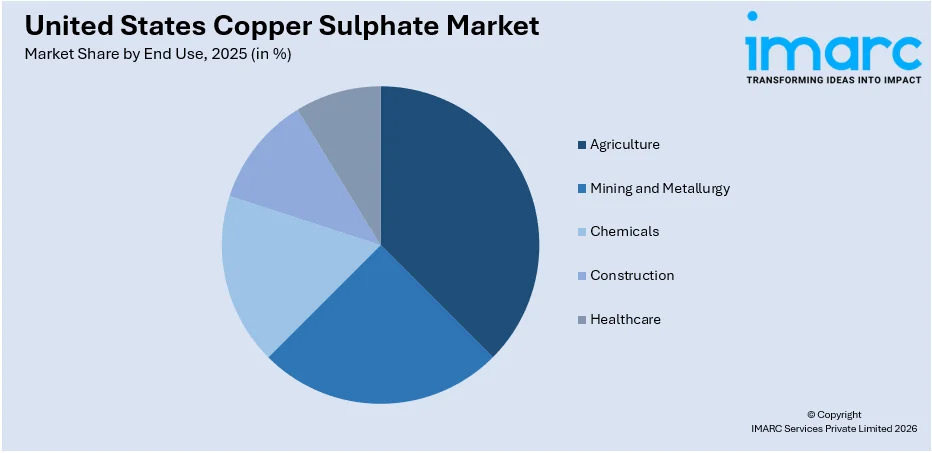
- Agriculture
- Mining and Metallurgy
- Chemicals
- Construction
- Healthcare
Agriculture dominates the United States copper sulfate market in 2025 due to its vital role in crop protection. As a highly effective fungicide and pesticide, copper sulphate is widely used to control fungal diseases, molds, and pests that affect a variety of crops, including fruits, vegetables, and grains. Its proven ability to improve crop yield quality and improve plant health contributes to its strong demand in the agricultural sector. Furthermore, copper sulfate’s cost-effectiveness and versatility in addressing multiple plant health issues make it a preferred choice for farmers. The growing emphasis on sustainable farming practices and the need for reliable crop protection further solidifies agriculture’s dominance in the market.
Regional Analysis:
- Northeast
- Midwest
- South
- West

The southern region leads the United States copper sulfate market in 2025 due to its substantial agricultural and mining industries. Agricultural demand, especially in states such as Texas, Florida, and Georgia, drives the use of copper sulfate as a fungicide and pesticide, particularly for crops such as citrus, cotton, and corn. The region's favorable climate and large-scale farming practices contribute to the high consumption of copper sulfate for crop protection. Additionally, the mining industry in the South, especially in copper mining and ore flotation processes, requires copper sulfate for extracting valuable metals. This combination of agricultural and industrial applications solidifies the South’s dominant market position.
Competitive Landscape:
The competitive landscape of the U.S. Copper Sulphate market is characterized by diversified players using advanced production technologies and applications. Significant activity in agriculture, aquaculture, and the industrial sectors marks this market, where innovation is the focal point to fulfill specific regional requirements. Key strategies include developing environmentally friendly products, improving supply chain networks, and catering to growing demand for organic farming solutions. Competition for regional suppliers and global producers remains high, pushed by the increasing demand for sustainable and high-quality solutions for copper sulfate, which accelerates innovation and market differentiation.
The report provides a comprehensive analysis of the competitive landscape in the United States copper sulphate market with detailed profiles of all major companies.
United States Copper Sulphate Market Report Scope:
| Report Features | Details |
|---|---|
| Base Year of the Analysis | 2025 |
| Historical Period | 2020-2025 |
| Forecast Period | 2026-2034 |
| Units | Kilo Tons, USD Million |
| Scope of the Report |
Exploration of Historical Trends and Market Outlook, Industry Catalysts and Challenges, Segment-Wise Historical and Future Market Assessment:
|
| End Uses Covered | Agriculture, Mining and Metallurgy, Chemicals, Construction, Healthcare |
| Regions Covered | Northeast, Midwest, South, West |
| Customization Scope | 10% Free Customization |
| Post-Sale Analyst Support | 10-12 Weeks |
| Delivery Format | PDF and Excel through Email (We can also provide the editable version of the report in PPT/Word format on special request) |
Key Benefits for Stakeholders:
- IMARC’s report offers a comprehensive quantitative analysis of various market segments, historical and current market trends, market forecasts, and dynamics of the United States copper sulphate market from 2020-2034.
- The research study provides the latest information on the market drivers, challenges, and opportunities in the United States copper sulphate market.
- Porter's Five Forces analysis assists stakeholders in assessing the impact of new entrants, competitive rivalry, supplier power, buyer power, and the threat of substitution. It helps stakeholders to analyze the level of competition within the United States copper sulphate industry and its attractiveness.
- Competitive landscape allows stakeholders to understand their competitive environment and provides an insight into the current positions of key players in the market.
Frequently Asked Questions About the United States Copper Sulphate Market Report Report
The United States copper sulphate market was valued at 105.0 Kilo Tons in 2025.
The market is primarily driven by increasing demand from agricultural applications, particularly as a fungicide and soil additive. Moreover, rising industrial applications in sectors such as mining, water treatment, and electronics, alongside environmental sustainability efforts, are further contributing to the market's expansion.
IMARC estimates the United States copper sulphate market to exhibit a CAGR of 1.95% during 2026-2034.
On a regional level, the market has been classified into Northeast, Midwest, South, and West wherein South currently dominates the market.
As per the report, agriculture accounted for the largest market share in the end use segment, driven by its extensive use as a fungicide and pesticide. Copper sulphate plays a crucial role in controlling fungal diseases and pests in crops, significantly improving yield and quality, which leads to high demand in the agricultural sector.
The COVID-19 pandemic disrupted the United States copper sulphate market by causing supply chain interruptions and labor shortages, leading to production delays. Additionally, decreased industrial activity and agricultural output temporarily reduced demand. However, the market is recovering as industries adapt and agricultural demand stabilizes, driving market’s growth.
Need more help?
- Speak to our experienced analysts for insights on the current market scenarios.
- Include additional segments and countries to customize the report as per your requirement.
- Gain an unparalleled competitive advantage in your domain by understanding how to utilize the report and positively impacting your operations and revenue.
- For further assistance, please connect with our analysts.
 Request Customization
 Speak to an Analyst
 Request Brochure
 Inquire Before Buying
Benefits of Customization
- Personalize this research
- Triangulate with your data
- Get data as per your format and definition
- Gain a deeper dive into a specific application, geography, customer, or competitor
- Any level of personalization
Get in Touch With Us
UNITED STATES
Phone: +1-201-971-6302
INDIA
Phone: +91-120-433-0800
UNITED KINGDOM
Phone: +44-753-714-6104
Email: [email protected]
Client Testimonials


.webp)


