
United States Recycled Plastics Market Size, Share, Trends and Forecast by Plastic Type, Application, Raw Material, and Region, 2026-2034
United States Recycled Plastics Market Size, Share, Trends & Forecast (2026-2034)
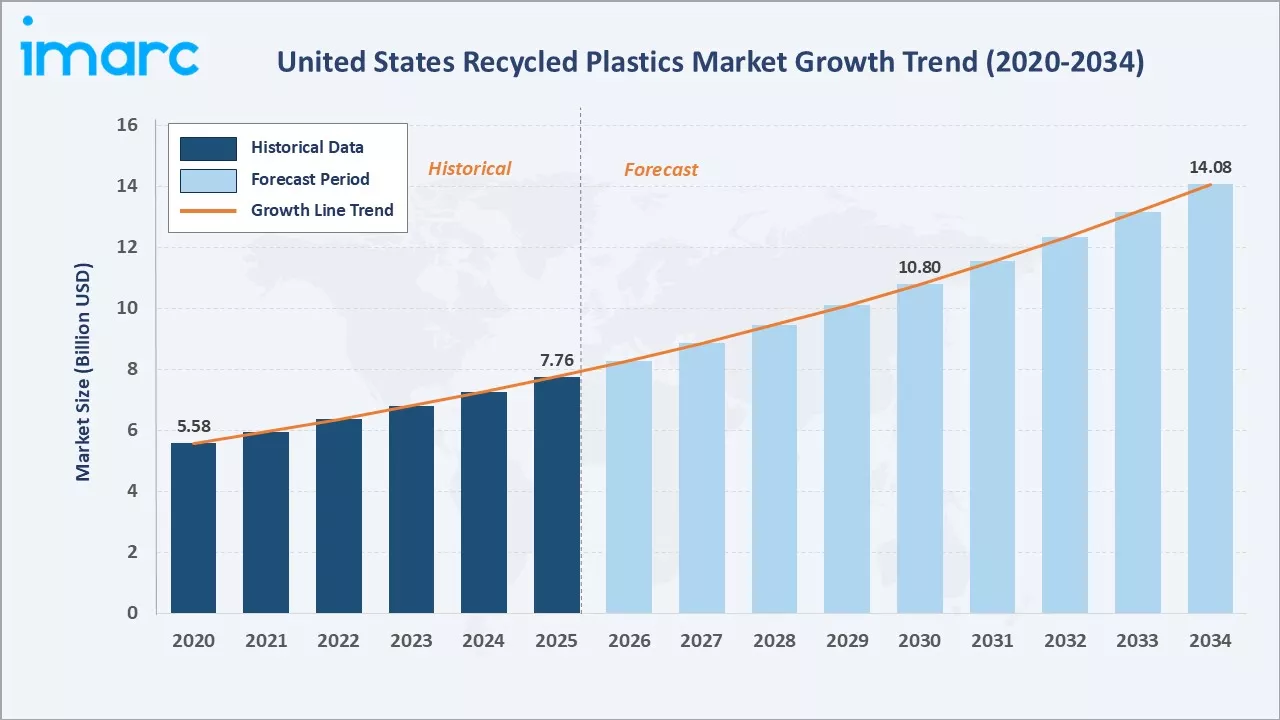
The United States recycled plastics market grew from USD 7.76 Billion in 2025 to USD 8.29 Billion in 2026 and is projected to reach USD 14.08 Billion by 2034, growing at a CAGR of 6.8% during 2026-2034. The market is driven by escalating corporate sustainability commitments, growing adoption of extended producer responsibility (EPR) programs across major states, and rising demand for recycled content in packaging and construction.
By 2040, the US could generate an additional 1 billion tons of plastic waste, causing over 30 million tons of pollution and increasing waste management costs by 30%. Without action, annual taxpayer costs could reach nearly $37 billion, underlining the vast feedstock opportunity. Polyethylene terephthalate (PET) leads by plastic type at 32.0%, while non-food contact packaging dominates by application at 30.0%. The South region commands the largest regional share at 35.0% in 2025.
Market Snapshot
|
Metric |
Value |
|
Base Year Market Size (2025) |
USD 7.76 Billion |
|
Market Size (2026) |
USD 8.29 Billion |
|
Forecast Market Size (2034) |
USD 14.08 Billion |
|
CAGR (2026-2034) |
6.8% |
|
Base Year |
2025 |
|
Historical Period |
2020-2025 |
|
Forecast Period |
2026-2034 |
|
Dominant Plastic Type |
Polyethylene Terephthalate (PET) (32.0%, 2025) |
|
Dominant Application |
Non-Food Contact Packaging (30.0%, 2025) |
|
Leading Region |
South (35.0%, 2025) |
The United States recycled plastics market grew from USD 5.58 Billion in 2020 to USD 7.76 Billion in 2025, and further to USD 8.29 Billion in 2026, reflecting accelerating demand for sustainable materials across packaging, construction, and automotive sectors. The market is projected to reach USD 10.80 Billion by 2030 before reaching USD 14.08 Billion by 2034.
To get more information on this market, Request Sample
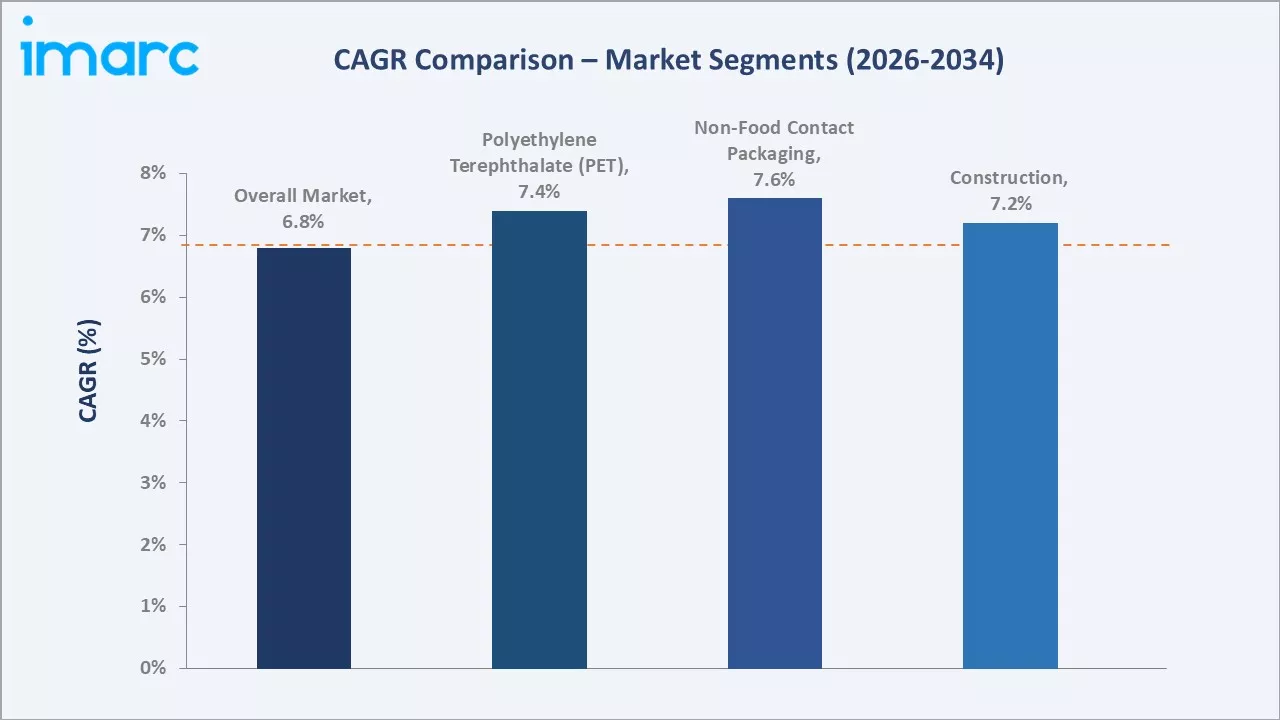
Polyethylene terephthalate (PET) drives growth at approximately 7.4% CAGR, underpinned by bottle-to-bottle recycling programs and food-grade rPET demand. Non-food contact packaging grows at the fastest rate among applications at 7.6% CAGR as brand owners accelerate recycled content commitments. Construction at 7.2% CAGR benefits from growing use of recycled plastic lumber and composite materials.
Executive Summary
The U.S. recycled plastics market is on a sustained growth trajectory driven by regulatory momentum, corporate sustainability initiatives, and expanding end-use demand. Federal and state-level EPR legislation, alongside voluntary recycled content mandates from major consumer goods companies, is creating structural demand visibility across the supply chain. The market has benefited from increased private investment in mechanical and chemical recycling infrastructure, improved collection systems, and growing consumer preference for sustainable products.
Polyethylene terephthalate (PET) leads at 32.0% by plastic type, reflecting the well-established post-consumer bottle recycling infrastructure and strong demand for food-grade rPET from beverage and food packaging manufacturers. Non-food contact packaging commands 30.0% by application, driven by e-commerce growth and brands accelerating recycled content adoption. The South region leads regionally at 35.0%, anchored by dense industrial manufacturing activity and large population centers generating significant feedstock volumes.
Key Market Insights
|
Insight |
Data |
| Dominant Plastic Type |
PET - 32.0% share (2025) |
|
Dominant Application |
Non-Food Contact Packaging - 30.0% share (2025) |
|
Leading Region |
South - 35.0% (2025) |
| Key Market Opportunity | Scaling EPR programs and corporate recycled content pledges are creating policy-backed demand visibility, while advancing chemical recycling technologies are unlocking high-value opportunities in complex and contaminated plastic streams. |
Key Analytical Observations Supporting the Above Data:
- Polyethylene Terephthalate (PET) at 32.0%: PET dominates due to the mature post-consumer bottle collection infrastructure across all 50 states, high-value end markets in food-grade packaging, and well-established decontamination technologies enabling bottle-to-bottle recycling at commercial scale.
- Non-Food Contact Packaging at 30.0%: Non-food contact packaging leads application demand driven by e-commerce growth, retailer sustainability programs, and brand owner commitments to incorporate minimum recycled content in primary and secondary packaging materials by targets.
- South at 35.0%: The South commands the largest regional share due to its high population density, large industrial manufacturing base, and significant CPG production activity that generates both feedstock supply and end-market demand for recycled plastic resins.
United States Recycled Plastics Market Overview
The US recycled plastics market encompasses the collection, sorting, processing, and conversion of post-consumer and post-industrial plastic waste into recycled resin pellets, flakes, and other secondary raw materials for use across packaging, construction, automotive, textile, and consumer goods industries.
The market ecosystem spans waste generators, material recovery facilities (MRFs), mechanical and chemical reclaimers, compounders, and brand owners or original equipment manufacturers (OEMs). Macroeconomic influences include commodity price dynamics for virgin plastics, state-level EPR legislation, federal infrastructure funding for recycling systems, and corporate sustainability pledges.
Market Dynamics
To evaluate market opportunities, Request Sample
Market Drivers
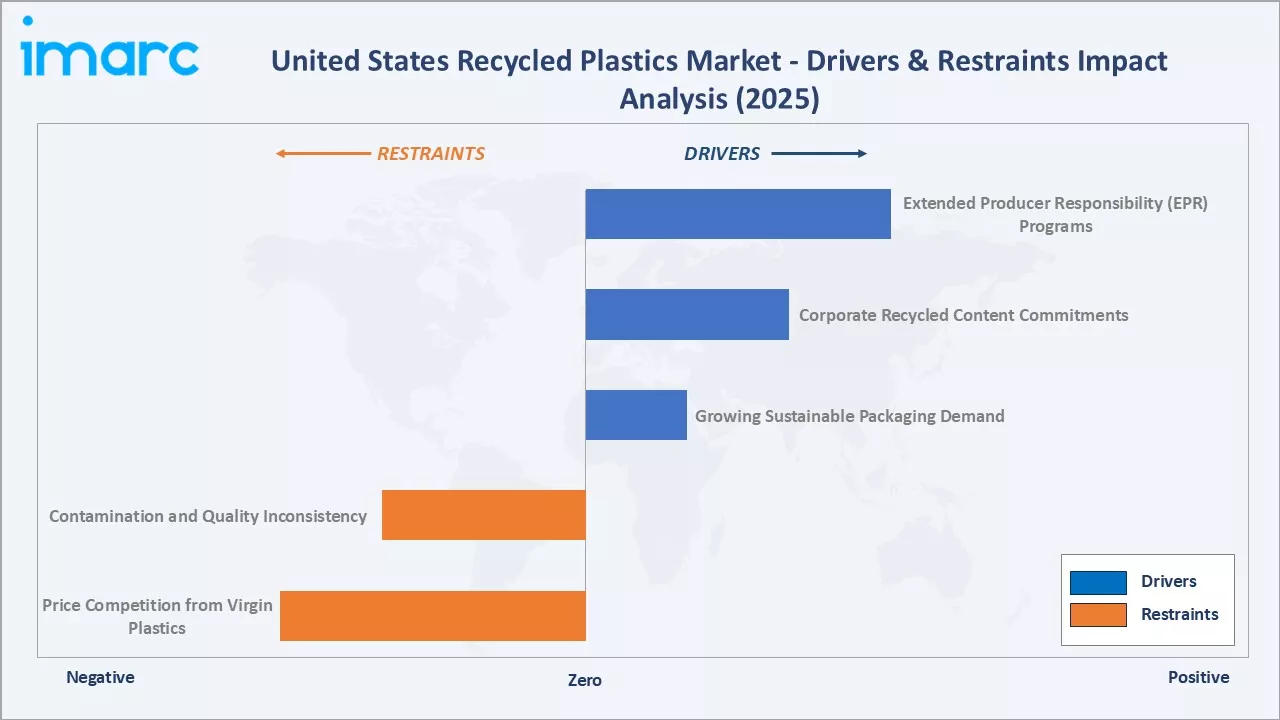
- Extended Producer Responsibility (EPR) Programs: As of mid-2026, seven US states, including Maine, Oregon, Colorado, California, Minnesota, Maryland, and Washington, have enacted EPR laws for packaging, establishing producer-funded collection and recycling systems. California's SB 54 mandates 65% recycled content in single-use plastic packaging by 2032, directly driving demand for domestic recycled resin across all plastic types and creating a policy-backed floor for rPET, rHDPE, and rPP volumes.
- Corporate Recycled Content Commitments: Leading consumer goods companies, including major CPG brands, have publicly committed to incorporating recycled content in their packaging portfolios. These voluntary commitments, backed by investor ESG pressure and retail sustainability standards, create predictable long-term offtake agreements that reduce investment risk for recycling capacity expansion projects.
- Growing Sustainable Packaging Demand: E-commerce growth has amplified demand for secondary and tertiary packaging materials. The US sustainable packaging market is growing, with recycled-content plastics representing an essential input for brands seeking to meet packaging sustainability targets and respond to retailer sustainability scorecards.
Market Restraints
- Contamination and Quality Inconsistency: High contamination levels in curbside-collected plastic streams reduce the usable yield from post-consumer bales, increasing processing costs and limiting the grade and value of recycled material output. Quality inconsistency complicates integration into food-contact and high-performance applications without additional decontamination steps.
- Price Competition from Virgin Plastics: Periods of low crude oil prices compress margins for recycled plastic producers as virgin resin prices decline, eroding the competitiveness of recycled alternatives. This cyclical price pressure can slow investment in new recycling capacity and discourage procurement of recycled content by cost-sensitive buyers.
Market Opportunities
- Chemical Recycling Scale-Up: Pyrolysis, gasification, and depolymerization technologies are advancing toward commercial scale, offering the ability to recycle previously unrecyclable mixed and contaminated plastic streams. Chemical recycling growth is unlocking high-value recycled feedstocks for automotive, electronics, and food-contact applications.
- Construction Sector Expansion: The US construction industry is a key economic contributor, with over 919,000 establishments, 8.0 million employees, and nearly $2.1 trillion in annual construction output as of Q1 2023. Growing adoption of recycled plastic lumber, composite panels, drainage pipes, and geosynthetic materials in infrastructure projects represents a high-volume, price-stable demand channel. Infrastructure investments for roads, bridges, and utilities are creating durable demand for recycled plastic composites in civil construction.
Market Challenges
- Infrastructure Investment Gap: The US recycling infrastructure faces a significant capital investment gap, with MRF capacity, collection logistics, and processing equipment requiring multi-billion-dollar upgrades to handle growing plastic waste volumes and more complex material streams from flexible and multi-layer packaging formats.
- Regulatory Fragmentation Across States: The absence of a unified national recycling standard creates compliance complexity for producers and collectors operating across state lines. Inconsistent labeling standards, varying EPR requirements, and differing material acceptance policies at MRFs add operational friction and cost to the national recycled plastics supply chain.
Emerging Market Trends
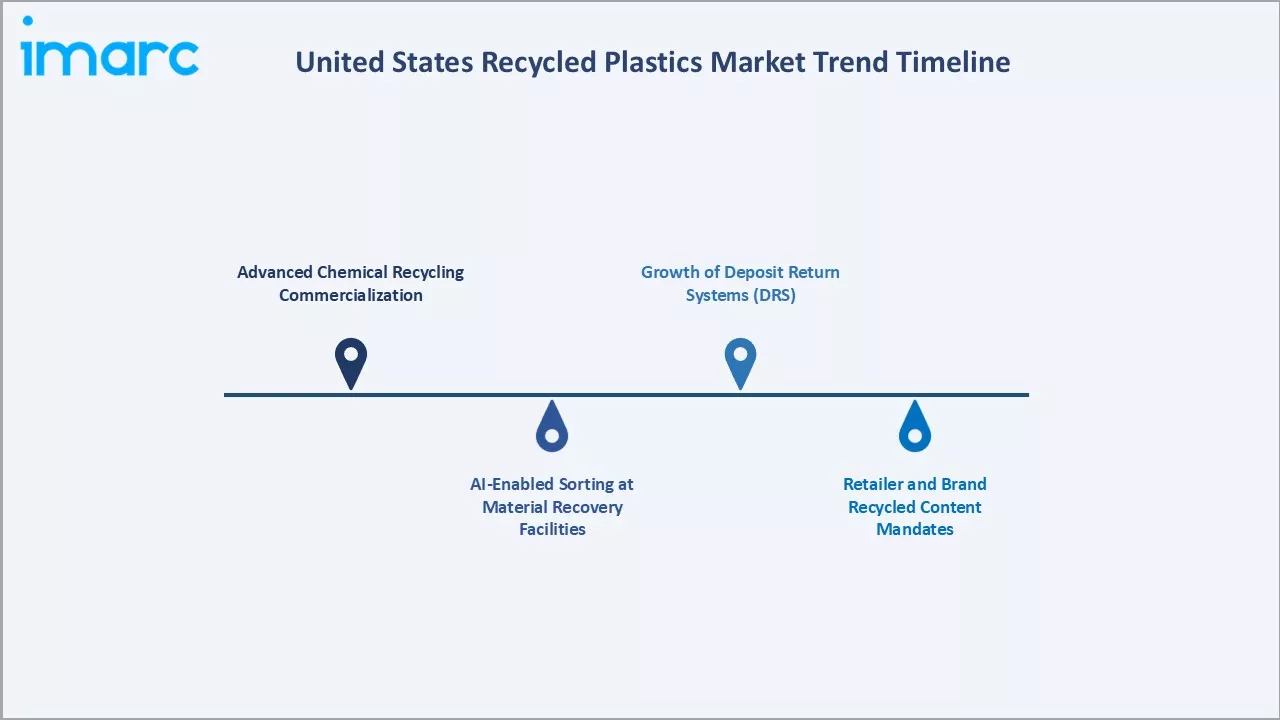
1. Advanced Chemical Recycling Commercialization
Chemical recycling technologies, including pyrolysis and solvent-based purification, are transitioning from pilots to commercial scale across multiple US sites. In February 2024, BASF launched its ChemCycling project in the US, introducing recycled plastic feedstocks to support the local circular economy. Leveraging its global expertise, the company is supplying ISCC+ certified recycled building blocks from its Port Arthur, Texas facility. These technologies convert mixed and contaminated plastics into virgin-equivalent feedstocks, unlocking previously inaccessible material streams and enabling circular economy claims for complex packaging.
2. AI-Enabled Sorting at Material Recovery Facilities
Artificial intelligence-driven robotic sorting systems are being deployed at leading MRFs across the US, improving plastic stream purity and increasing recovery rates for PET, HDPE, and PP. These systems reduce contamination versus manual sorting and enable higher-value material outputs, improving economics for downstream reclaimers.
3. Growth of Deposit Return Systems (DRS)
State-level bottle deposit and return systems are expanding beyond traditional states, improving collection rates for PET and HDPE beverage containers. Higher collection rates from DRS produce cleaner, higher-value bales, enabling bottle-to-bottle recycling and reducing dependency on lower-quality curbside material streams.
4. Retailer and Brand Recycled Content Mandates
Major US retailers are integrating minimum recycled content requirements into supplier sustainability scorecards, creating pull-through demand for domestic recycled plastic resins. This procurement-driven demand is particularly pronounced for rPET in beverage bottles, rHDPE in detergent containers, and rPP in durable consumer packaging applications.
Industry Value Chain Analysis
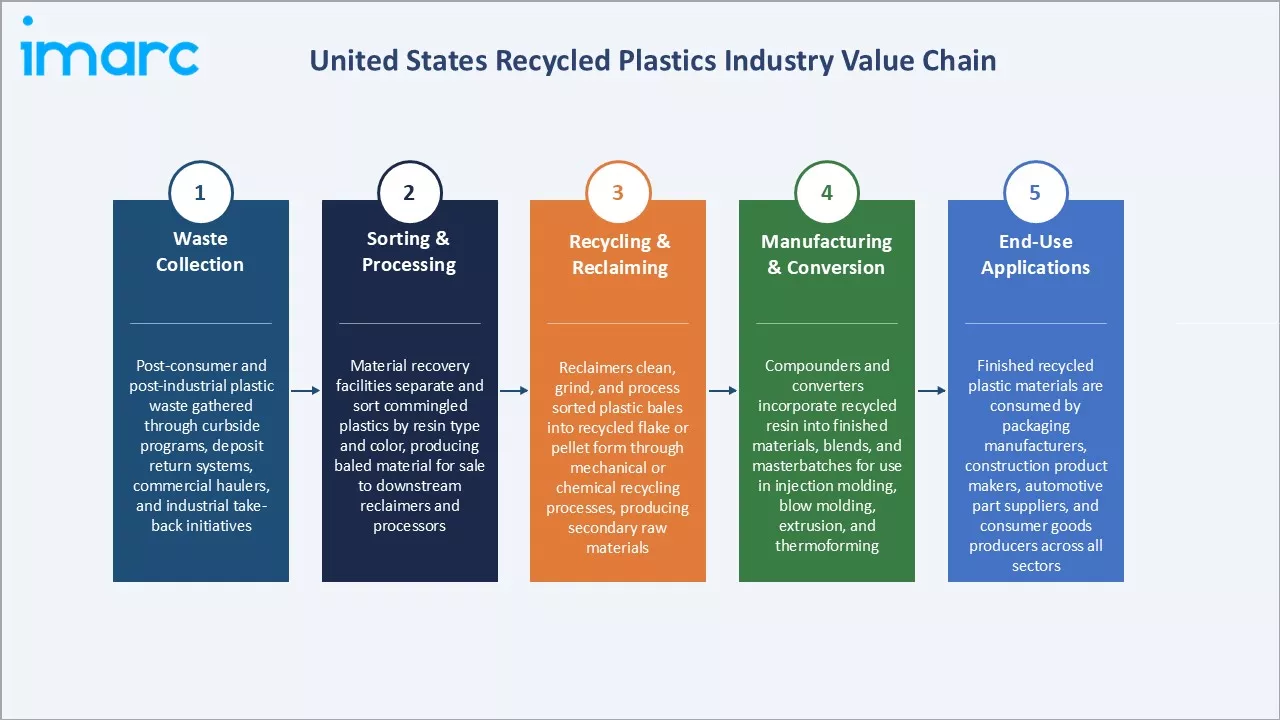
The United States recycled plastics value chain is structured across five integrated stages from post-consumer waste collection through end-use conversion. Each stage creates distinct value through collection logistics, material processing, recycling technology, and product formulation, with the highest value addition occurring at the recycling and reclaiming stage, where advanced decontamination and quality certification create food-grade and specialty resins.
|
Stage |
Key Participants |
| Waste Collection | Post-consumer and post-industrial plastic waste gathered through curbside programs, deposit return systems, commercial haulers, and industrial take-back initiatives. |
| Sorting & Processing | Material recovery facilities separate and sort commingled plastics by resin type and color, producing baled material for sale to downstream reclaimers and processors. |
| Recycling & Reclaiming | Reclaimers clean, grind, and process sorted plastic bales into recycled flake or pellet form through mechanical or chemical recycling processes, producing secondary raw materials. |
| Manufacturing & Conversion | Compounders and converters incorporate recycled resin into finished materials, blends, and masterbatches for use in injection molding, blow molding, extrusion, and thermoforming. |
| End-Use Applications | Finished recycled plastic materials are consumed by packaging manufacturers, construction product makers, automotive part suppliers, and consumer goods producers across all sectors. |
The recycling and reclaiming stage holds the greatest strategic value in the chain, as quality certification and decontamination technology create premium pricing power and long-term offtake relationships with brand owners. Distribution and logistics infrastructure is progressively improving as digital platforms optimize bale sourcing and recycled material procurement across regional supply chains.
Technology Landscape in the United States Recycled Plastics Industry
Advanced Mechanical Recycling
Modern mechanical recycling systems incorporate near-infrared (NIR) sorting, wet washing, extrusion, and solid-state polycondensation (SSP) to produce food-grade recycled PET and HDPE. SSP technology upgrades recycled flakes to virgin-equivalent intrinsic viscosity levels, enabling use in food and beverage packaging with regulatory compliance.
Chemical and Advanced Recycling
Pyrolysis converts post-consumer mixed plastics into pyrolysis oil as a petrochemical feedstock, enabling plastic-to-plastic recycling at the molecular level. Solvent-based purification technologies dissolve and re-precipitate specific resins from mixed streams, offering high purity for PS, PP, and flexible PE films that mechanical systems cannot economically process.
Digital Traceability and Material Passports
Blockchain-based traceability platforms enable certified chain-of-custody documentation for post-consumer recycled content, supporting brand sustainability claims and regulatory compliance reporting. Material passports capturing recycling process data, contamination levels, and performance characteristics are becoming requirements for premium recycled resin buyers.
Market Segmentation Analysis
The report covers the following segments:
|
Segment Category |
Leading Segment |
Market Share |
Year |
|
Plastic Type |
Polyethylene Terephthalate (PET) |
32.0% |
2025 |
|
Application |
Non-Food Contact Packaging |
30.0% |
2025 |
|
Raw Material |
🔒 |
🔒 |
2025 |
|
Region |
South |
35.0% |
2025 |

By Plastic Type
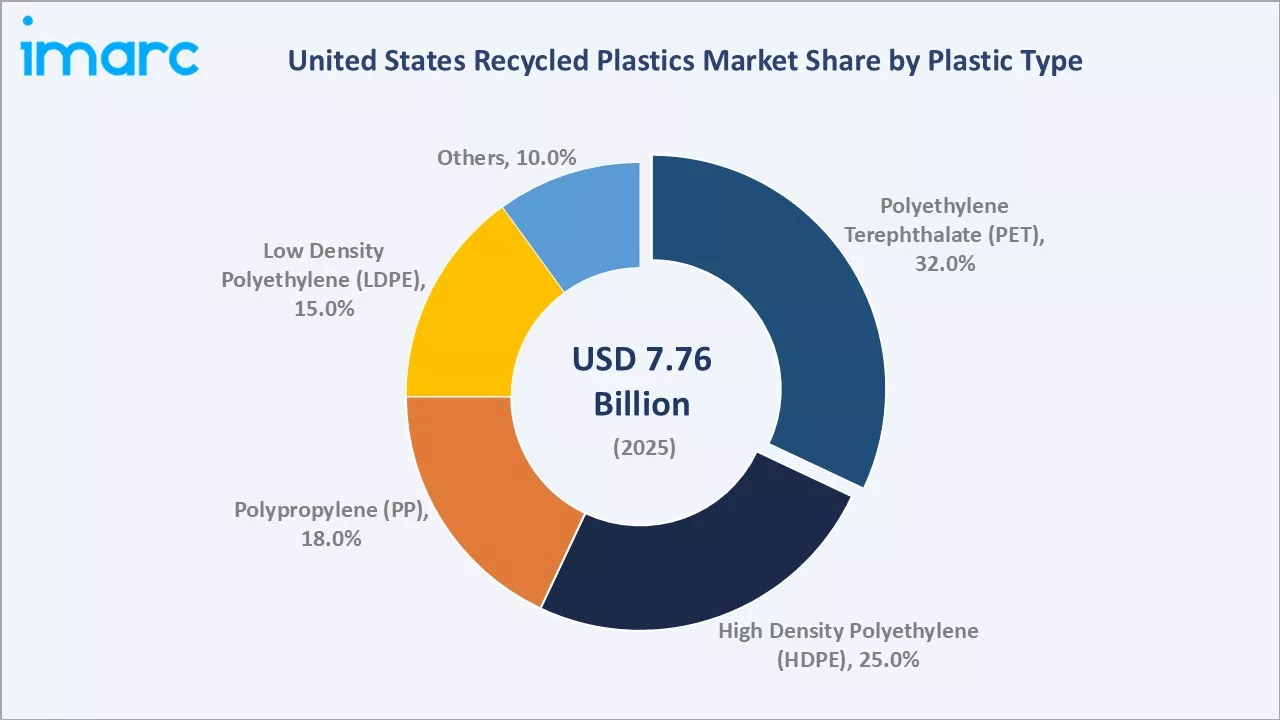
Polyethylene terephthalate (PET) leads at 32.0% in 2025, driven by the well-established post-consumer bottle deposit and curbside collection infrastructure that generates clean, high-value bale material. The food-grade rPET segment is particularly dynamic as beverage brands accelerate bottle-to-bottle recycling to meet state-mandated recycled content requirements. High density polyethylene (HDPE) holds 25.0%, sourced primarily from household packaging and industrial containers, with strong demand from agricultural film, pipe, and household product manufacturers seeking recycled content alternatives.
To access detailed market analysis, Request Sample
Polypropylene (PP) at 18.0% is growing rapidly as brand owners expand recycled PP use in closures, caps, and rigid packaging. Low density polyethylene (LDPE) at 15.0% is driven primarily by post-industrial film recycling as consumer-facing LDPE film collection remains inconsistent. Others at 10.0% include polystyrene, PVC, and engineering plastics increasingly targeted by chemical recycling systems.
By Application
Non-food contact packaging leads at 30.0% in 2025, underpinned by e-commerce fulfillment packaging demand and retailer sustainability programs that mandate minimum recycled content in secondary and tertiary packaging materials. Construction at 22.0% is the second-largest application, driven by growing use of recycled plastic lumber, composite decking, drainage pipes, and insulation materials in residential and infrastructure construction projects.
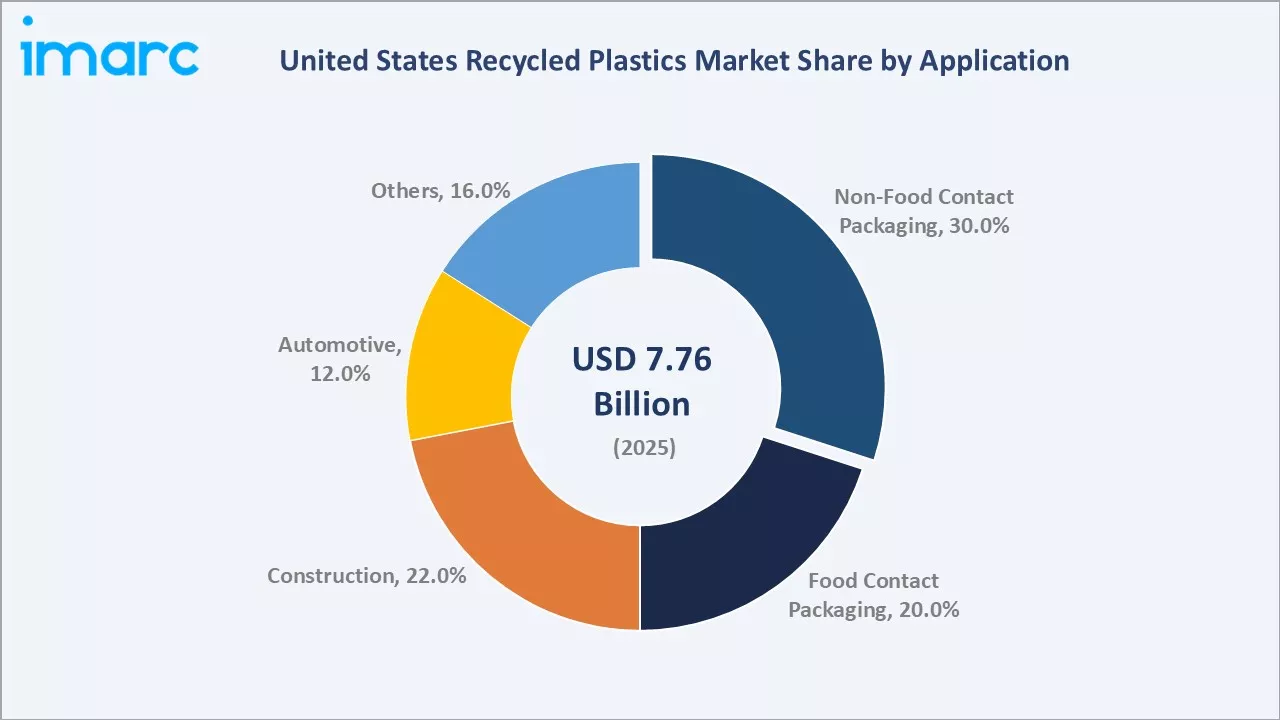
Food contact packaging at 20.0% requires the highest purity standards, driving investment in advanced decontamination and food-grade certification technologies. Automotive at 12.0% reflects growing OEM requirements for recycled content in interior trim, under-hood components, and structural parts to meet corporate sustainability targets and circular economy regulations. Other segments are growing at a 16.0% share.
Regional Market Insights
|
Region |
Share (2025) |
Key United States Recycled Plastics Market Drivers & Characteristics |
| South |
35.0% |
Reflecting the largest population base, high density of manufacturing and CPG production facilities, and significant post-consumer plastic waste generation that support both feedstock supply and end-market demand. |
| West | 25.0% | Reflecting strong state-level recycling infrastructure, progressive EPR legislation, and high consumer demand for sustainable packaging products from technology-sector and retail brand concentrations. |
| Midwest |
22.0% |
Reflecting major industrial manufacturing activity, automotive sector recycled content demand, and established plastic processing and compounding capacity concentrated in key industrial states. |
| Northeast | 18.0% | Reflecting mature urban recycling infrastructure, active bottle deposit return systems generating high-quality PET and HDPE bales, and strong demand from packaging and consumer goods manufacturers. |
The South leads at 35.0% due to its dense manufacturing base, large population generating consistent plastic waste volumes, and high concentration of CPG facilities creating reliable end-market demand for recycled resins. The West at 25.0% benefits from California's progressive recycling legislation that creates structural demand visibility for domestic recycled content, incentivizing investment in state recycling infrastructure.
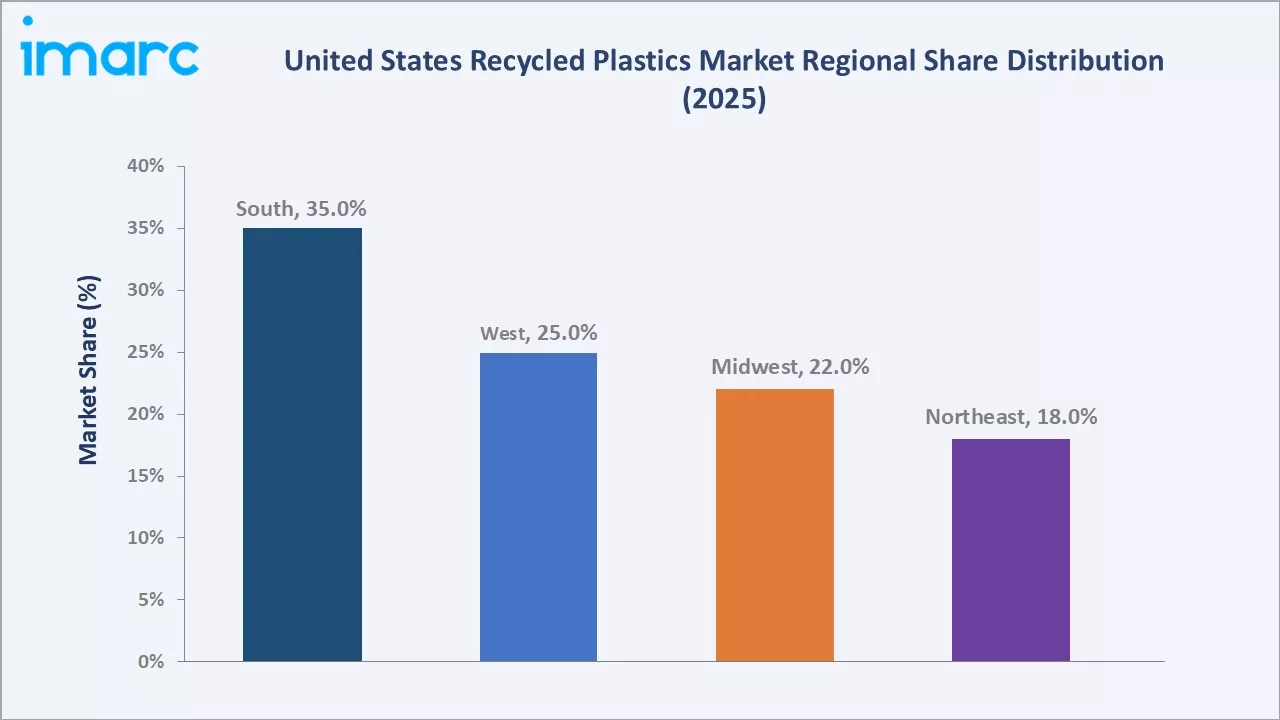
Midwest at 22.0% is anchored by automotive and industrial manufacturing demand for recycled PP, ABS, and engineering plastics, while established compounding and plastics processing infrastructure supports efficient material conversion. The Northeast at 18.0% benefits from mature bottle deposit systems that generate high-purity PET and HDPE bales commanding premium prices in domestic markets.
Competitive Landscape
The US recycled plastics market is moderately fragmented, with a mix of large-scale mechanical reclaimers, integrated packaging companies with recycling capabilities, and emerging chemical recycling innovators. The top players command significant share in specific resin categories, while broader mixed-plastic streams remain served by numerous regional and specialty operators. Competition is intensifying as corporate recycled content mandates create strong demand pull, attracting new entrants and capital investment.
|
Company |
Key Offerings |
Market Position |
Core Strength |
| KW Plastics | HDPE and PP Recycled Resins |
Market Leader |
KW Plastics is one of the largest plastics recyclers and suppliers of recycled high-density polyethylene (HDPE) and polypropylene (PP) resins. |
| PureCycle | PureFive Ultra, PureFive Choice | Established Player | PureCycle plays a crucial role in US recycled plastics by specializing in the recycling of polypropylene. |
| PolyQuest, Inc. | Recycled Polyethylene Terephthalate Resins (rPET), Recycled Polypropylene (rPP) | Innovator | PolyQuest, Inc. serves as a major distributor of virgin thermoplastic resins and a value-added manufacturer of recycled PET (rPET) and rPP. |
| BASF | Plastic ChemCycling | Challenger | BASF advances US recycled plastics primarily through its ChemCycling program, which applies chemical recycling to hard-to-recycle plastic waste. |
Competition in the US recycled plastics market is intensifying as large packaging companies invest backwards into recycling capacity, and chemical recycling innovators attract significant venture and strategic capital. The competitive landscape is reshaping as corporate sustainability mandates drive demand certainty, enabling longer-term capacity investment by established players while creating entry opportunities for technology-differentiated chemical recyclers.
Key Company Profiles
KW Plastics
KW Plastics is one of the largest post-consumer plastics reclaimers in the United States, with a primary focus on high-density polyethylene and polypropylene. Operating from a large-scale facility in Alabama, the company processes hundreds of millions of pounds of post-consumer plastic annually, supplying recycled resin to manufacturers across the packaging, agriculture, and consumer goods sectors. Its long-standing operational expertise and consistent material quality have established it as a preferred supplier.
- Key Offerings: HDPE and PP Recycled Resins.
- Strategic Focus: Expanding recycled resin production capacity, enhancing material quality and consistency standards, and deepening relationships with CPG brand customers seeking reliable domestic supply of post-consumer recycled content materials.
PolyQuest, Inc.
PolyQuest, Inc. is a thermoplastic resin distributor and recycled plastics manufacturer specializes in PET and recycled PET (rPET) products, alongside polypropylene, polyethylene, and polystyrene resins. The company processes post-consumer and post-industrial plastic waste to produce materials for packaging, textiles, films, sheets, and other industrial applications. Through its recycling operations, PolyQuest supports plastic waste recovery and the development of circular material supply chains.
- Key Offerings: Recycled Polyethylene Terephthalate Resins (rPET), Recycled Polypropylene (rPP).
- Strategic Focus: Integrating recycled content across product lines, developing design-for-recyclability solutions, and collaborating with brand customers and retailers to build circular packaging supply chains supported by domestic recycled material sourcing.
Market Concentration Analysis
The US recycled plastics market exhibits moderate concentration at the individual resin category level, where established mechanical reclaimers with large-scale processing infrastructure command significant shares of their respective post-consumer streams. The PET segment is among the most concentrated, supported by bottle deposit systems that channel high-quality feedstock to a limited number of large-capacity food-grade reclaimers with certified supply relationships with major beverage brands.
Across the broader recycled plastics market encompassing mixed resins, post-industrial streams, flexible films, and specialty engineering plastics, the landscape is significantly more fragmented, with regional reclaimers, regrinders, and compounders serving localized demand. The emergence of chemical recycling technology is introducing a new layer of competitive dynamics, as innovation-driven entrants challenge conventional mechanical recyclers for complex feedstock streams and premium recycled material markets.
Investment & Growth Opportunities
Highest Growth Segments
Non-food contact packaging at a 7.6% CAGR represents the most immediately accessible high-growth opportunity, driven by retailer sustainability mandates and e-commerce packaging volume growth.
Investment Themes
- Chemical Recycling Infrastructure: Pyrolysis and depolymerization plant development requires significant capital but offers access to large, previously unrecyclable plastic feedstock volumes and commands price premiums for certified recycled content in food-contact and high-performance applications.
- Emerging Markets for rPP and rLDPE: Polypropylene and flexible polyethylene recycling infrastructure is significantly underdeveloped relative to the available feedstock volumes, presenting a large capacity investment opportunity as sorting and cleaning technology for these resins matures.
Future Market Outlook (2026-2034)
The United States recycled plastics market grew from USD 7.76 Billion in 2025 to USD 8.29 Billion in 2026, reaching USD 14.08 Billion by 2034, exhibiting a CAGR of 6.8% during 2026-2034. The market is expected to reach an intermediate milestone of approximately USD 10.80 Billion by 2030, as EPR legislation across major states becomes fully operational, corporate recycled content commitments mature into binding procurement requirements, and chemical recycling capacity reaches meaningful commercial volumes. This inflection will be supported by significant private and public capital deployment into sorting, collection, and processing infrastructure upgrades.
Three structural forces will define the US recycled plastics market through 2034. First, the progressive rollout of state-level EPR programs will provide a policy-backed demand floor that insulates the market from commodity price cycles affecting virgin plastic economics. Second, the commercialization of chemical recycling at scale will expand the addressable feedstock base to include previously unrecyclable flexible, multi-layer, and contaminated plastic streams, materially increasing supply capacity and quality. Third, the sustained adoption of AI-driven sorting and digital traceability infrastructure will progressively improve material quality and certified recycled content documentation, enabling premium pricing for high-purity recycled resins across food-contact, automotive, and electronics applications through 2034.
Research Methodology
Primary Research
Primary research comprised structured consultations with recycled plastics reclaimer executives, CPG packaging procurement managers, MRF operators, EPR program administrators, chemical recycling technology developers, and sustainability officers at major brand companies. These discussions validated market sizing estimates, assessed regional supply-demand dynamics, and provided insights into technology adoption timelines and competitive positioning across the US recycled plastics sector.
Secondary Research
Secondary research drew on published data from the state EPR program documentation, company annual reports and investor presentations, trade publications, and industry databases tracking MRF capacity, pricing, and post-consumer resin market conditions. Historical market data spanning 2020 through 2025 was cross-validated across primary and secondary sources.
Forecasting Models
Market forecasts were developed using bottom-up and top-down modeling incorporating historical plastic waste generation and recycling rate trends, EPR program rollout timelines and mandated recycled content requirements, corporate sustainability commitment schedules, chemical recycling capacity addition projections, macroeconomic indicators including industrial production and consumer spending, and commodity price scenarios for virgin plastic resin benchmarks.
United States Recycled Plastics Market Report Coverage:
| Report Features | Details |
|---|---|
| Base Year of the Analysis | 2025 |
| Historical Period | 2020-2025 |
| Forecast Period | 2026-2034 |
| Units | Billion USD |
| Scope of the Report | Exploration of Historical Trends and Market Outlook, Industry Catalysts and Challenges, Segment-Wise Historical and Future Market Assessment:
|
| Plastic Types Covered | Polyethylene Terephthalate (PET), High Density Polyethylene (HDPE), Polypropylene (PP), Low Density Polyethylene (LDPE), Others |
| Applications Covered | Non-Food Contact Packaging, Food Contact Packaging, Construction, Automotive, Others |
| Raw Materials Covered | Plastic Bottles, Plastic Films, Rigid Plastic and Foam, Fibres, Others |
| Regions Covered | Northeast, Midwest, South, West |
| Companies Covered | KW Plastics, PureCycle, PolyQuest, Inc., BASF, etc. |
| Customization Scope | 10% Free Customization |
| Post-Sale Analyst Support | 10-12 Weeks |
| Delivery Format | PDF and Excel through Email (We can also provide the editable version of the report in PPT/Word format on special request) |
Key Benefits for Stakeholders:
- IMARC’s industry report offers a comprehensive quantitative analysis of various market segments, historical and current market trends, market forecasts, and dynamics of the United States recycled plastics market from 2020-2034.
- The research report provides the latest information on the market drivers, challenges, and opportunities in the United States recycled plastics market.
- Porter's five forces analysis assist stakeholders in assessing the impact of new entrants, competitive rivalry, supplier power, buyer power, and the threat of substitution. It helps stakeholders to analyze the level of competition within the United States recycled plastics industry and its attractiveness.
- Competitive landscape allows stakeholders to understand their competitive environment and provides an insight into the current positions of key players in the market.
Frequently Asked Questions About the United States Recycled Plastics Market Report
The US recycled plastics market reached USD 8.29 Billion in 2026, driven by EPR legislation, corporate sustainability commitments, and growing demand for recycled packaging materials.
The market is projected to grow at a CAGR of 6.8% during 2026-2034, supported by state-level EPR programs, corporate recycled content mandates, and chemical recycling technology commercialization.
The market is projected to reach approximately USD 10.80 Billion by 2030, driven by expanding EPR operations, mature corporate recycled content programs, and growing chemical recycling capacity.
PET leads with a 32.0% share in 2025, reflecting its mature post-consumer bottle collection infrastructure, food-grade decontamination technology, and strong demand from beverage packaging manufacturers.
Non-food contact packaging leads at 30.0% in 2025, driven by e-commerce packaging volume growth and retailer sustainability scorecards mandating minimum recycled content in packaging materials.
The South leads with a 35.0% share in 2025, reflecting its large population base, high density of CPG manufacturing, and significant plastic waste generation supporting feedstock supply.
Key players include KW Plastics, PureCycle, PolyQuest, Inc., and BASF, among others.
The market is projected to reach USD 14.08 Billion by 2034, driven by EPR maturity, chemical recycling scale-up, and sustained corporate and regulatory demand for domestic recycled plastic resins.
Need more help?
- Speak to our experienced analysts for insights on the current market scenarios.
- Include additional segments and countries to customize the report as per your requirement.
- Gain an unparalleled competitive advantage in your domain by understanding how to utilize the report and positively impacting your operations and revenue.
- For further assistance, please connect with our analysts.
 Request Customization
 Speak to an Analyst
 Request Brochure
 Inquire Before Buying
Benefits of Customization
- Personalize this research
- Triangulate with your data
- Get data as per your format and definition
- Gain a deeper dive into a specific application, geography, customer, or competitor
- Any level of personalization
Get in Touch With Us
UNITED STATES
Phone: +1-201-971-6302
INDIA
Phone: +91-120-433-0800
UNITED KINGDOM
Phone: +44-753-714-6104
Email: [email protected]
Client Testimonials















Related Reports

Choose your plan
*Please note that the prices mentioned below are starting prices for each bundle type. Kindly contact our team for further details.*
Single User License
- 1 User License, Access on 2 Devices
- PDF Report + Excel Dataset (Password Protected)
- Lifetime Access
- No Printing Rights
- 10% Free Report Customization
- 10–12 Weeks of Analyst Support
Five User License
- Access for 5 Users, 2 Devices per User
- PDF Report + Excel Dataset (Password Protected)
- Lifetime Access
- Dedicated Account Manager
- 12–14 Weeks of Analyst Support
- No Printing Rights
- 15% Free Report Customization
- 25% Discount on Your Next Purchase
Corporate User License
- Unlimited User Access (Within Your Organization)
- PDF Report + Excel Dataset
- Lifetime Access
- Dedicated Account Manager
- 14–20 Weeks of Analyst Support
- No Printing Rights
- 20% Free Report Customization
- 30% Discount on Your Next Purchase
Essential Insights
What's included:
3 reports
- Lifetime Access
- PDF Reports
- Excel Datasets
- 2 Weeks of Free Analyst Support
- 2 User Licenses
- Access on 2 Devices
- Printing Rights
- Complimentary PowerPoint (PPT) Version
- Complimentary License Upgrade
Professional Access
What's included:
5 reports
- Lifetime Access
- PDF Reports
- Excel Datasets
- 8 Weeks of Free Analyst Support
- 2 User Licenses
- Access on 2 Devices
- Printing Rights
- Complimentary PowerPoint (PPT) Version
- Complimentary License Upgrade
Business Advantage
What's included:
8 reports
- Lifetime Access
- PDF Reports
- Excel Datasets
- 14 Weeks of Free Analyst Support
- 2 User Licenses
- Access on 2 Devices
- Printing Rights
- Complimentary PowerPoint (PPT) Version
- Complimentary License Upgrade
Enterprise Intelligence
What's included:
10 reports
- Lifetime Access
- PDF Reports
- Excel Datasets
- 20 Weeks of Free Analyst Support
- 2 User Licenses
- Access on 2 Devices
- Printing Rights
- Complimentary PowerPoint (PPT) Version
- Complimentary License Upgrade