
United States Set-Top Box Market Report by Type (Cable STB, Satellite STB, Digital Terrestrial Television (DTT) STB, Internet Protocol (IP) STB, Over-The-Top (OTT) STB), Resolution (HD (High Definition), SD (Standard Definition), UHD (Ultra-High Definition)), End-User (Residential, Commercial, and Others), Service Type (Pay TV, Free-to-Air), Distribution (Online Distribution, Offline Distribution), and Region 2026-2034
Market Overview:
The United States set-top box market size reached USD 1,627.1 Million in 2025. Looking forward, IMARC Group expects the market to reach USD 1,643.9 Million by 2034.
|
Report Attribute
|
Key Statistics
|
|---|---|
|
Base Year
|
2025
|
|
Forecast Years
|
2026-2034
|
|
Historical Years
|
2020-2025
|
|
Market Size in 2025
|
USD 1,627.1 Million |
|
Market Forecast in 2034
|
USD 1,643.9 Million |
Access the full market insights report Request Sample
A set-top box (STB) is an electronic, hardware device that receives and decodes digital signals from digital television (DTV) broadcasts and displays them on the television. It comprises a RAM, web browser, MPEG decoder chip and an operating system, which assists in accessing files, programs, interfaces and services. It performs complex functions, such as video conferencing, home networking, video-on-demand and internet protocol (IP) telephony. It also aids in accessing the Internet and adding premium channels directly from the device. Consequently, it is extensively used in cable, satellite and over-the-air (OTA) television systems in the United States.
The increasing popularity of digital video recording, in confluence with advanced satellite networks and high disposable incomes of individuals, represents one of the significant factors impelling the market growth. Apart from this, the incorporation of interactive features in STB systems, such as motion sensors, Bluetooth connectivity, Internet of Things (IoT), gaming platforms, virtual reality and artificial intelligence (AI), are further contributing to the market growth. Moreover, the spread of the coronavirus disease (COVID-19), along with the growing emphasis on social distancing norms by the Government, has increased the adoption of e-learning across the country. This, in turn, is creating a positive influence on the market growth.
Key Market Segmentation:
IMARC Group provides an analysis of the key trends in each sub-segment of the United States set-top box market report, along with forecasts at the country and regional levels from 2026-2034. Our report has categorized the market based on type, resolution, end-user, service type and distribution.
Breakup by Type:
To get detailed segment analysis of this market Request Sample
- Cable STB
- Satellite STB
- Digital Terrestrial Television (DTT) STB
- Internet Protocol (IP) STB
- Over-The-Top (OTT) STB
Breakup by Resolution:
- HD (High Definition)
- SD (Standard Definition)
- UHD (Ultra-High Definition)
Breakup by End-User:
- Residential
- Commercial
- Others
Breakup by Service Type:
- Pay TV
- Free-to-Air
Breakup by Distribution:
- Online Distribution
- Offline Distribution
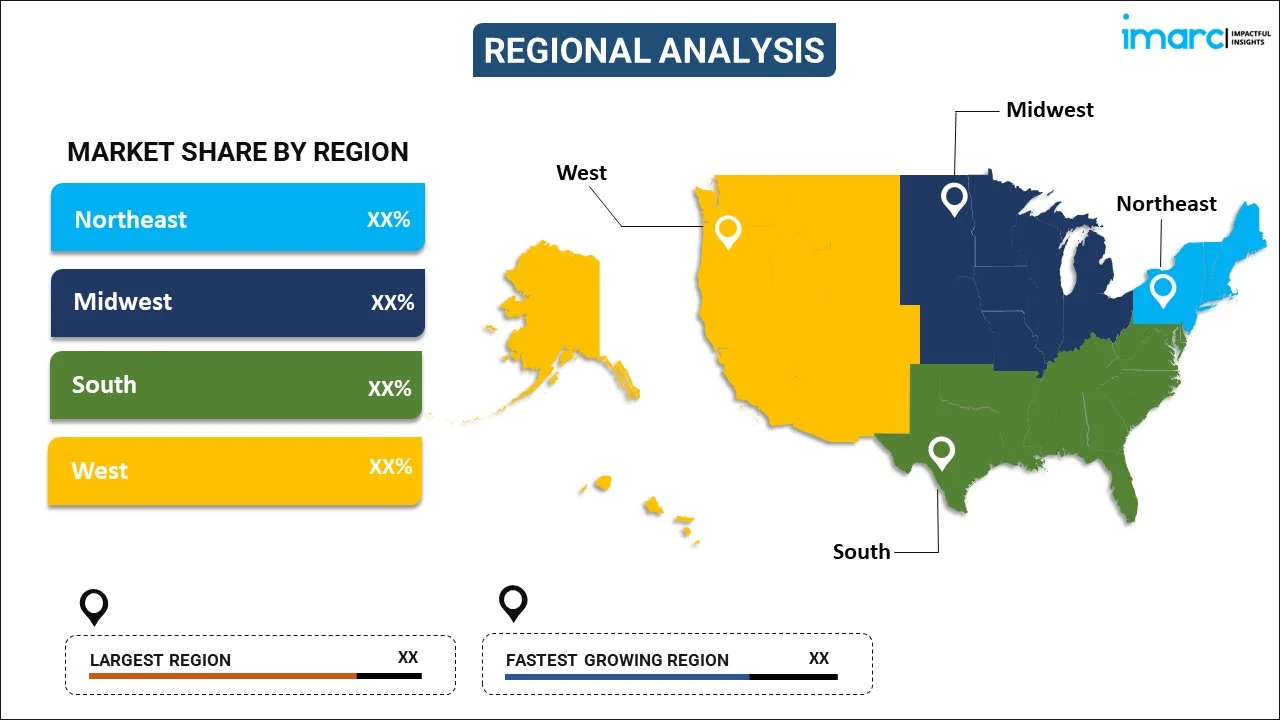
Breakup by Region:
To get detailed regional analysis of this market Request Sample
- Northeast
- Midwest
- South
- West
Competitive Landscape:
The competitive landscape of the industry has also been examined along with the profiles of the key players.
Report Coverage:
| Report Features | Details |
|---|---|
| Base Year of the Analysis | 2025 |
| Historical Period | 2020-2025 |
| Forecast Period | 2026-2034 |
| Units | Million USD |
| Segment Coverage | Type, Resolution, End-User, Service Type, Distribution, Region |
| Region Covered | Northeast, Midwest, South, West |
| Customization Scope | 10% Free Customization |
| Post-Sale Analyst Support | 10-12 Weeks |
| Delivery Format | PDF and Excel through Email (We can also provide the editable version of the report in PPT/Word format on special request) |
Frequently Asked Questions About the United States Set-Top Box Market Report
The United States set-top box market was valued at USD 1,627.1 Million in 2025.
The continuous development of advanced set-top box variants that can perform several complex functions, including video conferencing, home networking, video-on-demand, and Internet Protocol (IP) telephony, is primarily driving the United States set-top box market.
The sudden outbreak of the COVID-19 pandemic has led to the growing demand for set-top-box devices, as a means of indoor entertainment during the lockdown scenario across the United States.
Based on the type, the United States set-top box market can be segregated into cable STB, satellite STB, digital terrestrial television (DTT) STB, internet protocol (IP) STB, and over-the-top (OTT) STB. Currently, satellite STB type accounts for the majority of the total market share.
Based on the resolution, the United States set-top box market has been divided into HD (high definition), SD (standard definition), and UHD (ultra-high definition). Among these, HD (high definition) exhibits a clear dominance in the market.
Based on the end-user, the United States set-top box market can be categorized into residential, commercial, and others. Currently, the residential sector holds the majority of the total market share.
Based on the service type, the United States set-top box market has been segmented into pay TV and free-to-air, where pay TV currently represents the largest market share.
Based on the distribution, the United States set-top box market can be bifurcated into online distribution and offline distribution. Currently, offline distribution accounts for the majority of the total market share.
On a regional level, the market has been classified into Northeast, Midwest, South, and West, where South currently dominates the market.
Need more help?
- Speak to our experienced analysts for insights on the current market scenarios.
- Include additional segments and countries to customize the report as per your requirement.
- Gain an unparalleled competitive advantage in your domain by understanding how to utilize the report and positively impacting your operations and revenue.
- For further assistance, please connect with our analysts.
 Request Customization
 Speak to an Analyst
 Request Brochure
 Inquire Before Buying
Benefits of Customization
- Personalize this research
- Triangulate with your data
- Get data as per your format and definition
- Gain a deeper dive into a specific application, geography, customer, or competitor
- Any level of personalization
Get in Touch With Us
UNITED STATES
Phone: +1-201-971-6302
INDIA
Phone: +91-120-433-0800
UNITED KINGDOM
Phone: +44-753-714-6104
Email: [email protected]
Client Testimonials


.webp)


