
West Africa Biostimulants Market Report by Product Type (Acid-based, Extract-based, and Others), Crop Type (Cereals and Grains, Fruits and Vegetables, Turf and Ornamentals, Oilseeds and Pulses, and Others), Form (Dry, Liquid), Origin (Natural, Synthetic), Distribution Channel (Direct, Indirect), Application (Foliar Treatment, Soil Treatment, Seed Treatment), End-User (Farmers, Research Organizations, and Others), and Country 2026-2034
Market Overview:
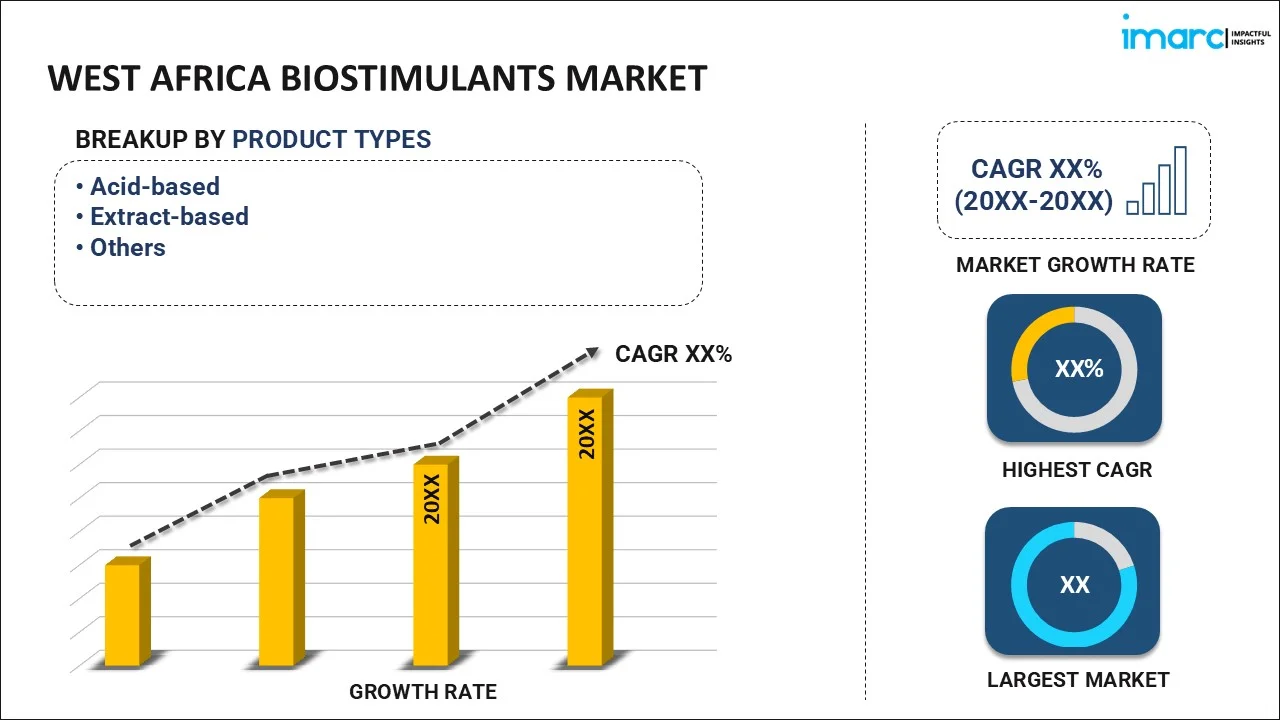
The West Africa biostimulants market size reached USD 17.1 Million in 2025. Looking forward, IMARC Group expects the market to reach USD 35.8 Million by 2034, exhibiting a growth rate (CAGR) of 8.27% during 2026-2034.
|
Report Attribute
|
Key Statistics
|
|---|---|
|
Base Year
|
2025
|
|
Forecast Years
|
2026-2034
|
|
Historical Years
|
2020-2025
|
|
Market Size in 2025
|
USD 17.1 Million |
|
Market Forecast in 2034
|
USD 35.8 Million |
| Market Growth Rate 2026-2034 | 8.27% |
Access the full market insights report Request Sample
Biostimulants comprise plant hormones, trace elements, microorganisms, enzymes, and seaweed extracts. They enhance crop productivity by minimizing the need for fertilizers. They also promote sustainable development and maintain the ecological balance of nature. As they increase the antioxidant activity and stimulate root development among plants, their utilization is increasing in the West African region.
The primary factor driving the market of biostimulants is the increasing significance of organic farming, along with the flourishing agriculture industry, in the West African region. Moreover, rising concerns about agricultural sustainability, soil health and environmental safety, and the growing consumer awareness about the adverse impact of chemically synthesized pesticides and fertilizers among individuals are strengthening the market growth in the region. Apart from this, the surging demand for food due to the rapidly increasing population, coupled with the limited availability of cultivable land, is positively influencing the market. Furthermore, biostimulants offer high yields, increase abiotic stress tolerance, improve plant development, and generate good quality products, which is impelling the market growth in the region. Besides this, numerous manufacturers are focusing on investing in efficient and high-quality products to drive overall sales.
Key Market Segmentation:
IMARC Group provides an analysis of the key trends in each sub-segment of the West Africa biostimulants market report, along with forecasts at the regional and country level from 2026-2034. Our report has categorized the market based on product type, crop type, form, origin, distribution channel, application and end-user.
Breakup by Product Type:
To get detailed segment analysis of this market Request Sample
- Acid-based
- Humic Acid
- Fulvic Acid
- Amino Acid
- Extract-based
- Seaweed Extract
- Other Plant Extracts
- Others
- Microbial Soil Amendments
- Chitin & Chitosan
- Others
Breakup by Crop Type:
- Cereals and Grains
- Fruits and Vegetables
- Turf and Ornamentals
- Oilseeds and Pulses
- Others
Breakup by Form:
- Dry
- Liquid
Breakup by Origin:
- Natural
- Synthetic
Breakup by Distribution Channel:
- Direct
- Indirect
Breakup by Application:
- Foliar Treatment
- Soil Treatment
- Seed Treatment
Breakup by End-User:
- Farmers
- Research Organizations
- Others
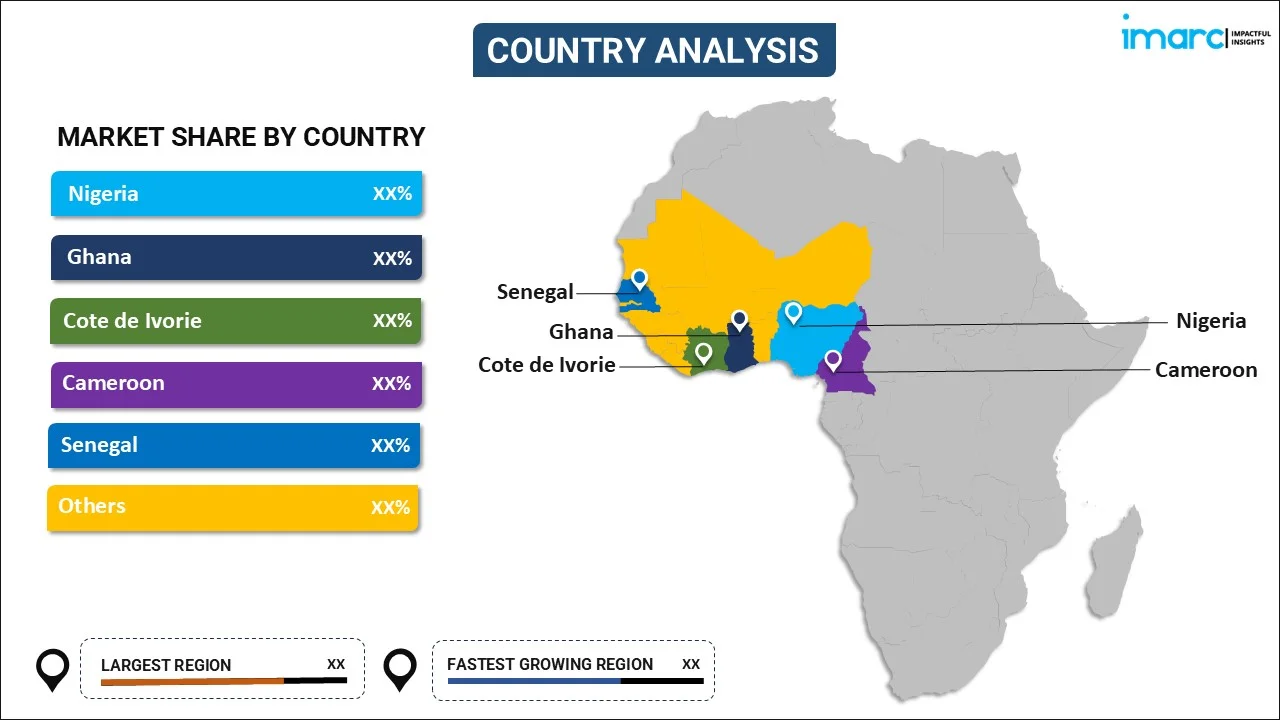
Breakup by Country:
To get detailed regional analysis of this market Request Sample
- Nigeria
- Ghana
- Cote de Ivorie
- Cameroon
- Senegal
- Others
Competitive Landscape:
The competitive landscape of the industry has also been examined along with the profiles of the key players.
Report Coverage:
| Report Features | Details |
|---|---|
| Base Year of the Analysis | 2025 |
| Historical Period | 2020-2025 |
| Forecast Period | 2026-2034 |
| Units | Million USD |
| Segment Coverage | Product Type, Crop Type, Form, Origin, Distribution Channel, Application, End-user, Country |
| Countries Covered | Nigeria, Ghana, Cote de Ivorie, Cameroon, Senegal, Others |
| Customization Scope | 10% Free Customization |
| Post-Sale Analyst Support | 10-12 Weeks |
| Delivery Format | PDF and Excel through Email (We can also provide the editable version of the report in PPT/Word format on special request) |
Key Questions Answered in This Report:
- How has the West Africa biostimulants market performed so far and how will it perform in the coming years?
- What has been the impact of COVID-19 on the West Africa biostimulants market?
- What are the key regional markets?
- What is the breakup of the market based on the product type?
- What is the breakup of the market based on the crop type?
- What is the breakup of the market based on the form?
- What is the breakup of the market based on the origin?
- What is the breakup of the market based on the distribution channel?
- What is the breakup of the market based on the application?
- What is the breakup of the market based on the end-user?
- What are the various stages in the value chain of the industry?
- What are the key driving factors and challenges in the industry?
- What is the structure of the West Africa biostimulants market and who are the key players?
- What is the degree of competition in the industry?
Need more help?
- Speak to our experienced analysts for insights on the current market scenarios.
- Include additional segments and countries to customize the report as per your requirement.
- Gain an unparalleled competitive advantage in your domain by understanding how to utilize the report and positively impacting your operations and revenue.
- For further assistance, please connect with our analysts.
 Request Customization
 Speak to an Analyst
 Request Brochure
 Inquire Before Buying
Benefits of Customization
- Personalize this research
- Triangulate with your data
- Get data as per your format and definition
- Gain a deeper dive into a specific application, geography, customer, or competitor
- Any level of personalization
Get in Touch With Us
UNITED STATES
Phone: +1-201-971-6302
INDIA
Phone: +91-120-433-0800
UNITED KINGDOM
Phone: +44-753-714-6104
Email: [email protected]
Client Testimonials


.webp)


