How to Conduct a Consumer Survey in India Across Tier-1, Tier-2, and Rural Markets
1. Introduction
India is not one market — it is many. A brand launching a packaged snack in Mumbai faces a fundamentally different consumer than one targeting a farmer household in Vidarbha. Yet both audiences matter enormously. Together, India's 1.4 billion people represent the world's most dynamic consumption story and understanding them requires consumer survey research that goes far beyond a simple online survey.
What is a Consumer Survey?
A consumer survey is a structured research instrument that collects standardized data from a defined population to answer specific business or policy questions. In India's context, the survey is not merely a data-collection tool — it is the bridge between a brand's ambitions and the ground reality of how Indians think, spend, and decide.
Why 2026 is a pivotal year for consumer research in India:
- India's internet user base has crossed 900 million, unlocking digital-first research at scale in Tier-1 and increasingly Tier-2 cities.
- The Digital Personal Data Protection Act (DPDPA) 2023 is now actively enforced, fundamentally changing how researchers collect and store respondent data.
- Rural consumption is growing at 1.5x the urban rate, driven by rising agricultural incomes, PM-KISAN transfers, and expanding digital payments.
- AI-assisted questionnaire design and real-time analytics dashboards have compressed research timelines by 30–40%.
- Vernacular and voice-based survey interfaces are democratizing access to previously hard-to-reach populations.
This guide is for brand managers, category heads, strategy consultants, startup founders, and research procurement teams who want to run credible, actionable consumer surveys across India's full market spectrum. It covers every stage — from defining objectives to choosing the right field agency, from sampling in remote villages to interpreting data for boardroom decisions.
2. Understanding India's Market Tiers and Segmentation
India's consumer landscape defies simple categorization. The standard tier framework, while imperfect, remains the most operationally useful lens for market research planning.
The Tier Framework Explained
Tier-1: Urban Affluent, Digital-First (NCCS A/B1)
These are India's eight largest metros: Mumbai, Delhi NCR, Bengaluru, Chennai, Hyderabad, Kolkata, Pune, and Ahmedabad. Characterized by high digital adoption, dual-income households, brand-literate consumers, and strong e-commerce penetration. NCCS A/B1 households dominate, with monthly household incomes above INR 50,000. Research here benefits from large online panels, strong mobile internet, and relatively high survey response rates — though urban fatigue is a growing concern.
Tier-2: Aspirational Middle Class (NCCS B2/C1)
India's 50+ Tier-2 cities — including Lucknow, Jaipur, Surat, Kochi, Coimbatore, and Nagpur — represent the fastest-growing consumer segment. Monthly household incomes of INR 20,000–INR 50,000 place them in NCCS B2/C1 brackets. These consumers are digitally connected but not digitally exclusive — they respond to CATI, regional media, and face-to-face interaction as well as online channels. Language diversity is significant: English competency drops sharply, making vernacular capability essential.
Tier-3 and Rural: Bharat Consumers (NCCS C2/D/E)
India's 600,000+ villages and small towns below Tier-2 classifications hold over 65% of India's population and an increasingly large share of consumer spending. NCCS C2/D/E households (monthly incomes below INR 20,000) purchase primarily through kirana stores, mandis, and local service providers. Research requires face-to-face consumer survey method, local language interviewers, community entry strategies, and logistics planning that city-based agencies often underestimate.
NCCS vs. SEC vs. Income Segmentation: Which to Use?
The New Consumer Classification System (NCCS) replaced the Socio-Economic Classification (SEC) in 2011 and is now the industry standard for Indian consumer research. NCCS classifies households based on education level of the chief wage earner and type of household durable goods owned (TV, refrigerator, washing machine, etc.), producing a grid from A1 (most affluent) to E2 (least affluent).
- Use NCCS when: designing sample quotas for consumer goods, FMCG, healthcare, or financial products research.
- Use income-based segmentation when: financial products, credit behaviour, or discretionary spend is the research focus.
- Use hybrid profiling when: conducting multi-sector research across diverse Indian geographies.
3. Defining Survey Objectives and Scope
The single most common reason consumer surveys fail to deliver business value is poor objective-setting. Research that begins with 'we want to understand our consumers' invariably produces reports full of interesting data and empty of actionable insight.
Translating Business Questions into Research Objectives
Every consumer survey solution should be anchored to a specific decision: Should we enter this market? Which price point is optimal? Why is our NPS declining in Tier-2? Is our new formulation acceptable to rural consumers?
Strong research objectives follow the SMART framework — Specific, Measurable, Achievable, Relevant, and Time-bound. 'Understand consumer attitudes to health foods in India' is not an objective. 'Measure the purchase intent and key decision drivers for fortified atta among NCCS B/C households in five Tier-2 cities within six weeks' is.
Research Type of Consumer Survey Matters
- Exploratory research: Used when entering unfamiliar markets. Qualitative-heavy, small samples, open-ended questions. Outputs: hypotheses, frameworks, consumer language.
- Descriptive research: Quantifies attitudes, behaviors, and market size across a defined population. Large samples, structured questionnaires. Outputs: market sizing, segmentation profiles, NPS.
- Causal research: Tests hypotheses about cause and effect — does Price A drive higher purchase intent than Price B? Requires experimental design. Outputs: validated insights, pricing optima.
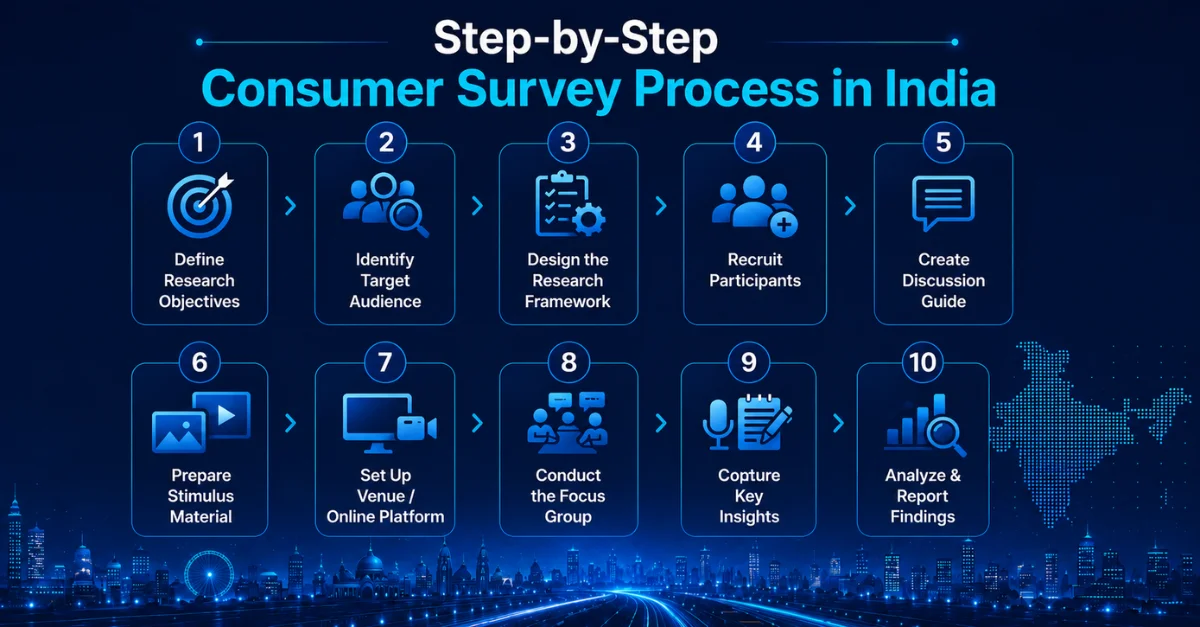
4. The 9-Step Consumer Survey Process
A well-run consumer survey follows nine sequential steps. Skipping or compressing any stage consistently produces unreliable data.
- Objective Setting: Define the business decision, research questions, and success metrics. Align all stakeholders before any field work begins.
- Research Design: Choose between exploratory, descriptive, or causal designs. Decide the methodology mix — online, CATI, CAPI, face-to-face, or hybrid.
- Sampling: Define the target population, choose sampling technique (stratified, cluster, multi-stage), calculate the required sample size with confidence intervals and design effect.
- Questionnaire Design: Write questions in English, then translate and back-translate into all required languages. Pilot internally before field testing.
- Pilot Testing: Run with 30–50 respondents across key demographics. Measure completion rates, identify problematic questions, revise before full fieldwork.
- Fieldwork: Execute data collection across all geographies. Real-time supervisor monitoring, daily response tracking, and interviewer GPS check-ins are non-negotiable.
- Quality Control: Back-check 10–20% of responses. Run automated logic checks, flag outliers, remove fraudulent or incomplete responses.
- Analysis: Clean the dataset, apply weights for national representativeness, run cross-tabulations, and apply appropriate statistical tests.
- Reporting and Insight Delivery: Translate findings into business language. Highlight implications, not just findings. Deliver interactive dashboards alongside static reports where possible.
5. Choosing the Right Research Methodology
No single methodology works for all of India. The right approach depends on the target tier, research objective, budget, timeline, and the literacy and technology access of respondents.
Core Data Collection Modes
CAWI (Computer-Assisted Web Interviewing) / Online Surveys
Best for Tier-1 and educated Tier-2 consumers. Platforms: Qualtrics, SurveyMonkey, Google Forms, proprietary panel systems. Fast, scalable, cost-effective. Key limitation: significant non-response bias in Tier-2 and complete inapplicability in rural markets. Online panels in India have a known skew toward younger, more educated, more affluent respondents.
CATI (Computer-Assisted Telephone Interviewing)
The workhorse of Tier-2 research. Provides structured, interviewer-administered data with reasonable reach and cost efficiency. Vernacular CATI — using local-language interviewers — is increasingly the method of choice for Hindi belt and South Indian markets. Typical response rates of 30–45% in Tier-2 versus 10–20% in metros.
CAPI (Computer-Assisted Personal Interviewing)
The gold standard for rural India. Field investigators visit respondents at home, market, or community hub, conducting structured interviews on tablets with embedded logic checks, GPS tagging, and photo verification. More expensive and time-intensive but the only reliable method for low-literacy, offline-first populations.
Mobile-First and WhatsApp-Based Surveys
A rapidly growing channel, particularly for rural and Tier-2 panels. India has over 500 million WhatsApp users. Short, vernacular, visual surveys via WhatsApp are proving effective for brand tracking and rapid pulse studies. JioPhone users and feature phone penetration have expanded the potential sample frame significantly.
Face-to-Face and Focus Group Discussions
For qualitative depth and concept testing, face-to-face remains indispensable. Essential when testing packaging, advertising concepts, product prototypes, or exploring emotional territory that structured surveys miss.
6. Tier-Wise Methodology and Execution
6.1 Tier-1 Cities
India's metros are data-rich environments where speed and panel quality matter most. Digital respondents are survey-experienced, making questionnaire design and incentive structure especially critical.
- Digital-first: leverage established online panels (MRSS India, IndiaSpeaks, Dynata India) for rapid turnaround.
- Social media intercepts on Instagram and YouTube are effective for reaching Gen Z (15–24 years).
- Mall intercepts in premium locations (Phoenix Malls, Palladium properties) for high-income NCCS A respondents.
- App-based surveys with UPI incentives achieve 2–3x higher completion rates than email-based invitations.
- Sample frame: 300–500 per city; 5-city metro study requires 1,500–2,500 completes.
- Typical timeline: 2–3 weeks from questionnaire lock to data delivery.
- Cost per response: INR 150–INR 400 depending on survey length and panel quality.
6.2 Tier-2 Cities
The fastest-growing consumer base demands the most nuanced research approach. Language variation, semi-digital status, and aspirational consumption patterns make Tier-2 research a discipline of its own.
- Vernacular CATI is the default entry point — local-language calling significantly improves cooperation rates.
- Hybrid CATI + face-to-face works well for mixed audiences (e.g., kirana owners + modern trade shoppers in the same city).
- Retail audit integration: partnering survey data with POS off-take data provides validation and context.
- Local field agency partnerships in each cluster city are preferable to deploying central metro teams.
- Sample frame: 250–400 per cluster; a 10-city Tier-2 study requires 2,500–4,000 completes.
- Typical timeline: 4–6 weeks, including translation and back-translation.
- Cost per response: INR 250–INR 600.
6.3 Rural and Tier-3 Markets
Rural India is not a monolith. Agri-dependent Uttar Pradesh, coastal fishing communities in Odisha, tribal markets in Jharkhand, and irrigated Punjab require different approaches, different languages, and different field logistics.
- CAPI door-to-door household surveys are the only method that reaches all rural segments reliably.
- Mandi and weekly haat intercepts provide cost-efficient access to male farmer and trader respondents.
- Voice-based and IVR surveys work for basic attitudinal tracking among low-literacy populations.
- Entry strategy requires coordination with local community leaders, self-help groups, and panchayat networks.
- Field logistics: survey windows must avoid harvest seasons (Oct–Nov, Mar–Apr), monsoon mobility constraints, and major festival periods (Diwali, Dussehra, Eid, harvest festivals by state).
- Sample frame: 400–600 per region; a 5-state rural study requires 2,000–3,000 completes.
- Typical timeline: 6–10 weeks.
- Cost per response: INR 400–INR 900 (inclusive of travel, accommodation, supervisor costs).
6.4 Tier Comparison Matrix
| Feature | Tier-1 Cities | Tier-2 Cities | Rural / Tier-3 |
|---|---|---|---|
| Preferred Method | CAWI / Online Panels | CATI + Face-to-Face | CAPI Door-to-Door |
| Language | English + Hindi | Regional + Hindi | Local Dialect |
| Avg. Response Rate | 15–25% | 30–45% | 55–70% |
| Cost per Response | INR 150–INR 400 | INR 250–INR 600 | INR 400–INR 900 |
| Typical Timeline | 2–3 weeks | 3–5 weeks | 5–8 weeks |
| Incentive Type | UPI / e-Voucher | Mobile Recharge | Cash-in-hand |
| Key Challenge | Survey fatigue | Language variation | Logistics & access |
7. Sampling Strategy for India
India's demographic and geographic complexity makes sampling design one of the most consequential decisions in research design. A biased sample produces biased data — no amount of analysis corrects for a fundamentally unrepresentative sample.
Probability vs. Non-Probability Sampling
Probability sampling (simple random, stratified, cluster, multi-stage) is the gold standard for nationally representative consumer research. Every unit in the population has a known, non-zero probability of selection. Required for any study making population-level claims. Non-probability sampling (convenience, quota, snowball, purposive) is acceptable for exploratory studies, hypothesis generation, and certain B2B research contexts. Cannot support statistical generalization.
Multi-Stage Sampling for Pan-India Studies
A typical pan-India consumer survey uses three-stage sampling: (1) Geographic primary sampling units — districts or blocks — are randomly selected within each state. (2) Within each PSU, households or individuals are randomly selected from voter lists, census frames, or local enumeration. (3) Within each household, a Kish grid or equivalent is used for respondent selection.
Sample Size Calculation
The required sample depends on: confidence level (typically 95%), margin of error (typically ±3–5%), expected variance in the key metric, design effect (typically 1.5–2.0 for multi-stage designs), and expected non-response and quality rejection rates (add 20–30% buffer).
8. Questionnaire Design
A well-designed questionnaire is invisible — respondents flow through it without noticing the craftsmanship. A poorly designed one produces data that contradicts itself, frustrates interviewers, and misleads stakeholders.
Core Principles
- Lead with engagement: Open with easy, non-threatening questions to build rapport. Never begin with sensitive topics (income, health, political views).
- Use the right scale for the right construct: Likert 5-point for attitudes, NPS 0–10 for loyalty, semantic differentials for brand personality, MaxDiff for priority ranking.
- Control question order effects: Awareness questions must precede usage questions. Aided recall must follow unaided recall. Never reverse this.
- Cap length: 15–20 minutes maximum for Tier-1; 12–15 minutes for Tier-2; 10–12 minutes for rural CAPI to minimize fatigue and incomplete responses.
- Include internal consistency checks: Ask the same construct from two directions to flag contradictory responses.
Designing for Low-Literacy Respondents
Rural and semi-rural surveys require visual scales, pictorial response options (smiley faces, hand signals, product images), and audio playback for question prompts on CAPI tablets. Avoid abstract constructs ('Would you say your satisfaction is above average?') in favor of concrete behavioral anchors ('In the last month, did you buy this product again?').
9. Vernacular and Multilingual Strategy
India has 22 scheduled languages and hundreds of dialects. A study covering five states may require questionnaires in Hindi, Tamil, Telugu, Kannada, and Marathi — plus Bhojpuri or Rajasthani variants in specific UP/Rajasthan districts.
Translation Protocol
- Master questionnaire to be developed in English.
- Forward translation by a native speaker with domain expertise (e.g., healthcare translator for pharma studies).
- Back-translation by a different native speaker — back to English — to identify meaning drift.
- Reconciliation review by a bilingual research manager.
- Cognitive testing with 5–10 target respondents per language to identify comprehension issues.
- Final field version locked and programmed.
Critical watch-out: Hindi is not monolithic. A questionnaire optimized for Delhi NCR may confuse respondents in Bhojpuri-dominant eastern UP or Chhattisgarhi-speaking MP. Dialects must be accounted for in both interviewer selection and questionnaire adaptation.
10. Field Operations: Investigators and Incentives
Profile of an Effective Field Investigator by Tier
- Tier-1: University-educated, tech-comfortable, bilingual (English + regional language), experienced with CAWI/CAPI platforms.
- Tier-2: Local language fluency essential, CATI experience valued, familiar with regional consumer culture, strong communication skills.
- Rural: Local community embeddedness critical, fluent in district-level dialects, physically mobile (owns vehicle), trusted by community gatekeepers.
Incentive Structures by Tier
- Tier-1: UPI transfers (INR 100–INR 300), Amazon/Flipkart vouchers, sweepstakes entry. Digital incentives achieve fastest processing and highest respondent preference.
- Tier-2: Mobile recharges, branded merchandise, cash via UPI or bank transfer. INR 150–INR 400 typical range.
- Rural: Cash-in-hand remains most trusted and most motivating. In some contexts, kind incentives (branded product sample, household item) work better than cash. INR 200–INR 500 typical, sometimes supplemented with community contribution (donation to local school).
Ethical note: Over-incentivization attracts professional survey respondents who satisfice rather than engage thoughtfully. Incentive levels should motivate participation, not manufacture it. MRSI guidelines recommend incentive-to-time ratios that approximate fair compensation for the respondent's time.
11. Quality Control and Data Validation
Data quality is where Indian consumer research most frequently fails. Field fraud — curbstoning, interviewer falsification, proxy responses — is a real and persistent problem across all tiers. Robust QC is non-negotiable.
Real-Time Field Monitoring
- GPS tagging: Every CAPI interview must be GPS-stamped to verify the respondent's actual location.
- Photo verification: Tablet-based CAPI should capture a timestamped photo of the respondent (with consent) in Tier-3 and rural fieldwork.
- Real-time dashboards: Supervisors and client teams should have live visibility into daily interview counts, completion rates by geography, and flagged anomalies.
Back-Check and Audit Protocols
- Back-check 15–20% of all rural and Tier-2 interviews within 48 hours of completion.
- Accompaniment audits (field supervisor observes interviewer): Recommended for first 10% of a new interviewer's work.
- Audio audits for CATI: Random 5–10% of calls reviewed for adherence to questionnaire and consent protocols.
Automated Data Validation
- Completion rate checks: Flag incomplete responses above a threshold (typically >20% missing).
- Speeders: Interviews completed significantly below median time are flagged for manual review.
- Straight-liners: Respondents choosing the same scale point for all items are automatically flagged.
- Logic inconsistencies: Auto-check responses for internal contradiction (e.g., 'I have never heard of this brand' followed by a detailed usage description).
12. Regulatory and Ethical Considerations
DPDPA 2023 Research Obligations
- Informed consent must be obtained before data collection — written, verbal (recorded), or digital click-through.
- Data must be used only for the stated research purpose and cannot be shared with third parties without explicit consent.
- Data localization: Personal data of Indian residents must be stored on servers within India unless the Data Protection Board grants specific cross-border transfer approvals.
- Respondents have the right to access, correct, and request deletion of their data.
- Special categories: Data about health, financial status, religious beliefs, and children under 18 requires additional consent and heightened protection.
ESOMAR, MRSI, and ICC/ESOMAR Code
IMARC Group follows the ICC/ESOMAR International Code on Market, Opinion and Social Research, which sets global standards for researcher-respondent relationships, data protection, and reporting transparency. Indian fieldwork also adheres to MRSI (Market Research Society of India) operational guidelines.
13. Cost and Timeline Benchmarks
Budgeting a consumer survey in India requires understanding both the fixed components (project management, questionnaire design, analysis, reporting) and the highly variable field costs (sample size, tier mix, language count, geography spread).
| Project Type | Sample Size | Geographies | Est. Cost (INR) | Timeline |
|---|---|---|---|---|
| Tier-1 Online Survey | 500–1,000 | 5 metros | INR 2–5 Lakhs | 3–4 weeks |
| Tier-2 CATI Study | 400–800 | 10 cities | INR 4–10 Lakhs | 4–6 weeks |
| Pan-India CAPI Survey | 1,000–2,000 | All tiers | INR 12–25 Lakhs | 8–12 weeks |
| Rural Household Survey | 600–1,200 | 50+ villages | INR 8–18 Lakhs | 6–10 weeks |
| Mixed-Method Tracker | 2,000+ | All tiers | INR 20–50 Lakh | Ongoing |
Note: This is an indicative cost only. This may vary project to project and industry to industry.
Key Cost Drivers
- Sample size: The single largest cost variable. Doubling sample size increases cost by 60–80%, not 100%, due to fixed cost spread.
- Geographic spread: Adding states increases cost disproportionately due to local coordinator fees and travel.
- Language count: Each additional language adds translation, back-translation, programming, and interviewer training costs.
- Methodology mix: CAPI is 2–3x the cost of CAWI per completed response.
- Timeline: Rush delivery premiums of 20–30% are standard for sub-3-week turnarounds.
14. Sector-Specific Application of Consumer Survey Considerations
FMCG and Consumer Goods
Brand tracking, pack testing, concept validation, pricing research. Focus on unaided brand awareness, usage frequency, and last-purchase behavior. Rural distribution is a critical research variable — availability, not preference, is often the binding constraint.
Retail and E-Commerce
Omnichannel purchase journey mapping, NPS for digital platforms, cart abandonment drivers. Tier-2 is the growth frontier for quick commerce and D2C brands. Comparing online vs. offline trust levels is a high-value research area.
Healthcare and Pharma
Patient journey research, treatment adherence, physician prescribing behaviour, OTC purchase drivers. Requires DPDPA-compliant health data handling. Female health decisions in rural India are particularly under researched and high opportunity.
Food and Beverages
Consumption habits, dietary transitions, health-nutrition positioning, fortification acceptance. Regional taste preferences are a critical sampling variable — a pan-India food survey that ignores South India's distinct palette will produce misleading national averages.
Technology, Media, and Telecom
Telecom NPS, OTT platform usage, smartphone upgrade cycles, feature adoption. Feature phone to smartphone transition in Tier-3/rural is a live research area with significant brand and policy implications.
Financial Services and Fintech
Financial inclusion measurement, UPI adoption, credit behaviour, insurance penetration. Rural India's financial behaviour is being transformed faster than most research tracks — continuous tracking studies are high value here.
Agriculture and Rural Enterprise
Input purchase behaviour, crop advisory adoption, agri-input brand awareness, credit access. Research must be designed around agricultural calendars. Farmers are most accessible post-harvest and least accessible during sowing.
15. Technology and Tools for 2026
- CAPI Platforms: SurveyCTO, ODK Collect, Dimagi CommCare, and proprietary systems. Key features to evaluate: offline functionality, GPS/photo capture, real-time sync, skip logic depth.
- AI-Assisted Questionnaire Design: Tools like Qualtrics ExpertReview and custom LLM integrations flag leading questions, ambiguous wording, and order effects before programming.
- Real-Time Analytics Dashboards: Client-facing dashboards showing live fieldwork progress, preliminary toplines, and geographic distribution of completes.
- Speech-to-Text and Vernacular NLP: For open-ended response coding in Hindi, Tamil, Telugu, Marathi, and other Indian languages. Reduces post-coding time by 60–70%.
- Geo-tagging and Biometric Verification: GPS stamping and optional fingerprint/face verification for rural CAPI to prevent proxy interviews and location fraud.
16. Emerging Trends Shaping 2026
- AI-Powered Insight Generation: Automated crosstab analysis, NLP-driven open-end coding, and AI narrative generation are compressing time from data delivery to insight. However, synthetic respondents — AI-generated survey responses — remain a quality and ethics risk that requires active monitoring.
- Conversational and Chat-Based Surveys: WhatsApp and chatbot-based surveys achieve 2–4x higher completion rates than traditional online links for Tier-2 and rural audiences.
- Passive Data Collection: Behavioural analytics from apps, payment systems, and location data are increasingly being integrated with survey data for richer consumer profiles — with explicit DPDPA consent.
- Hyperlocal Panels: Gig-economy field networks (similar to delivery partner models) are creating dense, available investigator pools in Tier-2 and Tier-3 geographies, compressing rural fieldwork timelines by 20–30%.
- DPDPA-Driven Consent Architecture: Granular, purpose-specific consent management systems are becoming standard for panel-based research, replacing legacy opt-in approaches.
17. Common Challenges and How to Overcome Them
Low Response Rates in Tier-1
Urban survey fatigue is real. Solution: shorter surveys (under 12 minutes), compelling mobile-first design, relevant and immediate incentives, and targeted recruitment through high-quality opt-in panels rather than cold outreach.
Translation Drift and Questionnaire Equivalence
A question that reads identically in English may carry different connotations in Hindi, Tamil, and Telugu. Solution: cognitive testing in every language before fieldwork, bilingual research managers reviewing all translations, and back-translation as a standard protocol.
Field Fraud and Curbstoning
Fabricated interviews — interviewers completing surveys without speaking to real respondents — remain a risk in poorly supervised fieldwork. Solution: GPS verification, photo capture, back-checks within 48 hours, and randomized supervisor accompaniment.
Seasonal and Festival Disruptions
India's agricultural calendar and festival density can collapse fieldwork efficiency by 50–70% in affected geographies. Solution: maintain a national festival and harvest calendar mapped to each state; build 15–20% schedule buffers for rural studies.
Gatekeeper Bias
Male head-of-household answering on behalf of women respondents is a persistent rural research challenge. Solution: female-only interviewer teams for women-targeted studies, separate interview rooms in household settings, and screener questions that identify and exclude proxy respondents.
18. How to Choose the Right Consumer Survey Services Partner
The quality of your research is only as good as the agency executing it. In India's crowded research supplier landscape, the gap between best-in-class and poor execution is enormous.
Key Evaluation Criteria
- Tier coverage: Does the agency have genuine rural reach or just urban subcontractors who claim rural capability? Ask for district-level coverage maps and field team rosters by state.
- Methodology depth: Can they execute CAPI, CATI, CAWI, and mixed method in a single study? Do they own their CAPI platforms or rely on third-party tools?
- Quality certifications: ISO 20252 is the international standard for market research quality management. MRSI and ESOMAR membership indicates commitment to ethical standards.
- Technology stack: Real-time client dashboards, GPS-stamped field data, audio audit capability, and AI-assisted analysis are now table stakes for premium research.
- Reporting quality: Do they deliver insight or data? Ask to see sample reports. The best partners translate findings into business implications, not just charts.
Red Flags
- Unusually low-cost bids: Cost-per-response that is 50%+ below market benchmarks typically means compromised sample quality, minimal QC, or outsourced rural fieldwork with no supervision.
- No back-check protocol: Any agency that cannot describe their back-check and QC process should not be trusted for decision-grade research.
- Limited vernacular capability: An agency that offers only English and Hindi questionnaires cannot credibly cover South India, Northeast India, or many Tier-2 markets.
19. Why IMARC Group
Our Consumer Research Capabilities
- Pan-India footprint across all tiers and 600+ districts, with active field teams in every major state.
- Multilingual research capability covering 20+ Indian languages, with native-speaker translators and bilingual field investigators.
- Sector expertise across FMCG, healthcare, financial services, agri-input, retail, and technology.
- End-to-end research: from study design and sampling through fieldwork, quality control, advanced analytics, and executive reporting.
- Proprietary CAPI platform with real-time GPS verification, audio audit, and live client dashboards.
- ESOMAR and MRSI member; ISO 20252 aligned quality management protocols.
- DPDPA 2023 compliant data handling, consent management, and storage architecture.
Whether you need a rapid 500-response Tier-1 online study or a 2,000-household rural CAPI survey across five states, IMARC Group provides the methodological depth, geographic reach, and analytical rigor to turn India's complexity into competitive advantage.
Our Clients










Contact Us
Have a question or need assistance?
Please complete the form with your inquiry or reach out to us at
Phone Number
+91-120-433-0800+1-201-971-6302
+44-113-547-7077
Previous Post

India has emerged as one of the world's most important qualitative research markets. As brands compete to understand an increasingly diverse and aspirational consumer base — spanning Mumbai's digitally native Gen Z to rural Maharashtra's first-time FMCG buyers — the depth of insight that only qualitative research can provide has never been more strategically valuable.
The global camping tent market has evolved into a significant segment within the outdoor and recreational equipment industry, reflecting changing consumer preferences, sustainability priorities, and lifestyle shifts. Traditionally associated with adventure tourism and leisure activities, camping tents have now become integral to outdoor experiences that emphasize mobility, comfort, and environmental awareness. Their growing relevance is driven by a blend of technological innovation, material advancements, and an expanding base of consumers seeking nature-driven recreation.
Aluminum cookware and kitchenware are popular cookware and kitchenware items produced mainly with high-purity aluminum, which are light in weight, have high heat conductivity, and are resistant to corrosion. Aluminum utensils involve a wide array of products ranging from pots, pans, pressure cookers, frying pans, serving trays, ladles, and baking dishes. Aluminum's superior heat distribution has the ability to distribute heat evenly, thus saving energy, and hence is a popular choice for both household and commercial kitchens.
Seamless tubes consist of high-strength, hollow cylindrical products that are produced without welds with uniform structure and higher mechanical performance. Made from solid steel billets using extrusion and piercing operations, seamless tubes boast high dimensional precision, good resistance to pressure, and the capacity to handle high temperature and corrosive environments. Seamless tubes can be made in carbon steel, alloy steel, and stainless-steel grades based on the application.
In an era of rising energy costs and increasing environmental awareness, businesses must optimize their utility consumption to reduce expenses and enhance sustainability. Utility cost and energy efficiency audits give an in-depth examination of energy consumption, highlighting areas where there are inefficiencies and suggesting practical solutions for reducing costs and optimizing day-to-day operations.
Seamless digital documentation and ERP integration are important in today's data-driven business landscape to ensure operational effectiveness, adherence to regulations, and data-driven decision-making.
Discover a complete guide to setting up a manufacturing plant in Japan, including key steps, site selection, government incentives, and industry insights.
Explore key steps, costs, and compliance tips for setting up a manufacturing plant in the Saudi Arabia. A complete guide for investors and entrepreneurs.
Explore key steps, incentives, costs, and compliance tips for setting up a manufacturing plant in the Germany. A complete guide for investors and entrepreneurs.
On-site technical support and troubleshooting services offer real-time, expert solutions to fix intricate technical problems at your business site. On-site services guarantee minimal downtime, maximum system efficiency, and uninterrupted operations by sending experienced technicians directly to your location.
Environmental compliance audits are formal assessments of an organization's compliance with environmental rules, policies, and best practices. Environmental compliance audits assist companies in discovering latent risks, maintaining compliance with legislation, and making sustainable operating enhancements.
Green Building Certification Support services aid companies in obtaining prestigious sustainability certifications like LEED (Leadership in Energy and Environmental Design) and IGBC (Indian Green Building Council).
With the extremely regulated business world today, proper documentation and technical file preparation are essential for product compliance, market access, and quality assurance. Our Documentation and Technical File Preparation services offer intensive support to companies facing intricate regulatory requirements in various global markets.
Warranty and AMC coordination services refer to the process of managing and optimizing warranty claims, maintenance contracts, and after-sales support for companies. They provide smooth coordination between manufacturers, service providers, and customers, increasing customer satisfaction and operational efficiency.
Fire safety and security system design services entail the careful planning, development, and deployment of systems to safeguard people, property, and assets against fire risks and security threats.
In today’s competitive and compliance-driven environment, businesses cannot afford quality lapses, recurring errors, or regulatory non-conformance. Whether in manufacturing, life sciences, energy, or services, Corrective and Preventive Action (CAPA) systems are vital for continuous improvement and risk mitigation. At IMARC Group, we provide strategic CAPA Support Services to help organizations systematically identify, resolve, and prevent quality issues—enhancing productivity, safety, and customer satisfaction.
Civil, Structural, and MEP (Mechanical, Electrical, Plumbing) Design and Verification services involve the holistic planning, design, and validation of infrastructure projects to ensure safety, performance, and adherence to regulatory requirements. These services are essential to build resilient and efficient buildings, industrial premises, and city infrastructure.
In today’s competitive and fast-paced industrial environment, unplanned downtime can significantly disrupt operations and inflate costs. Preventive Maintenance Planning (PMP) offers a proactive approach to asset management - ensuring that equipment, machinery, and infrastructure are serviced regularly to prevent unexpected failures.
Land acquisition and legal due diligence services encompass the detailed process of finding, assessing, and acquiring land parcels for business growth, industrial ventures, or property development. These services confirm that the land is legally sound, unencumbered by disputes, and in line with the client's strategic interests. Through careful due diligence, companies can avoid risks, steer clear of legal traps, and make sound judgments when it comes to land investments.
In today’s hypercompetitive global market, organizations are under constant pressure to boost efficiency, reduce costs, and maximize output. However, improving productivity is not about working harder—it's about working smarter. Productivity Benchmarking and Optimization is a strategic approach that empowers businesses to compare performance metrics, identify gaps, and implement best practices tailored to their industry. At IMARC Group, we provide actionable insights through data-driven benchmarking and optimization strategies to help organizations transform performance into a long-term competitive advantage.
Discover a complete guide to setting up a manufacturing plant in Vietnam, including key steps, site selection, government incentives, and industry insights.
Step-by-step semiconductor manufacturing guide covering wafer production, photolithography, etching, deposition, testing, and the global supply ecosystem.
Process optimization and lean consulting solutions enable companies to streamline operations, eliminate waste, and maximize efficiency in their value chain. Through Lean techniques and continuous improvement practices, we empower organizations to increase productivity, decrease costs, and improve quality, turning operations into competitive strengths.
Explore a step-by-step guide to setting up a paper bag manufacturing plant, including planning, machinery, raw materials, costs, and marketing strategies.
Explore a detailed guide on establishing a manufacturing plant in the UAE, including incentives, legal steps, costs, and strategic industry insights.
In industries where accuracy and compliance are critical, equipment calibration and vendor coordination form the foundation of reliable operations. Whether in production, pharmaceuticals, energy, or research, calibration of equipment ensures accuracy, quality, and compliance with regulatory requirements. At the same time, successful coordination with vendors provides timely service, technical support, and supply chain effectiveness. At IMARC Group, we offer end-to-end calibration and coordination services that help businesses minimize downtime, reduce errors, and maintain operational excellence.
In today's fast-evolving industrial landscape, organizations from various end-use industries are quickly embracing automation and digital monitoring to gain real-time insights, enhance productivity, maintain safety, as well as reduce costs. From smart factories to the digitally enabled energy systems, Industry 4.0 is no longer an option—it is a strategic necessity. Using our services at IMARC Group, we help businesses in identifying, evaluating, as well as implementing tailored automation and digital monitoring solutions that enhance efficiency and long-term sustainability.
Equipment Relocation & Reinstallation services provide secure, efficient, and disruption-minimal transportation of equipment, production lines, and vital assets to new locations. Our turnkey solutions reduce downtime, safeguard precious equipment, and ensure operational readiness after the move, be it for plant growth, site consolidation, or process improvement.
Regulatory approval and licensing entail seeking formal permission from authorities to produce, distribute, or offer products and services in target markets. The procedure depends on the industry, geography, and type of product and may demand careful paperwork, compliance with standards, and extensive testing or inspections.
Explore key steps, incentives, costs, and compliance tips for setting up a manufacturing plant in the US. A complete guide for investors and entrepreneurs.
As industries evolve and operational lifecycles conclude, responsible decommissioning and site closure have become essential components of environmental stewardship and regulatory compliance. Whether it’s an industrial plant, mine, manufacturing unit, or energy facility, decommissioning is not just about shutting down—it's about doing so sustainably, safely, and in alignment with legal and community obligations.
Quality audit services are critical for companies with the objective of upholding high standards, compliance with regulations, and maximizing operational effectiveness. The services entail a rigorous review of processes, products, and systems for purposes of ensuring compliance with quality standards, industry practices, and statutory requirements. Through rigorous audits, firms can detect weaknesses, minimize risks, and undertake remedial measures to better overall performance and customer satisfaction.
Effective spare parts planning and inventory setup are vital for ensuring uninterrupted operations, minimizing downtime, and optimizing costs. Whether you're managing a manufacturing facility, utility infrastructure, or industrial fleet, maintaining the right stock of critical spare parts is essential. At IMARC Group, we help organizations build resilient spare parts strategies through advanced data-driven planning, industry benchmarking, and feasibility assessments.
In today’s highly regulated industrial and commercial environment, Standard Operating Procedures (SOPs) serve as the backbone of compliance, quality, and operational integrity. For businesses across sectors like pharmaceuticals, healthcare, manufacturing, and food processing, adherence to SOPs is not just about maintaining internal discipline—it’s about meeting rigorous external regulatory expectations.
Health and safety compliance audits are organized reviews of workplace conditions, policies, and practices to confirm compliance with occupational safety standards and industry best practices. These audits enable companies to discover potential hazards, reduce risks, and ensure compliance with local and global safety standards, promoting a secure and productive work environment.
Our workforce planning and technical staffing solutions enable companies to create nimble, future-fit teams by linking talent strategies and business goals. We excel at identifying, recruiting, and retaining high-caliber technical talent for operational excellence and innovation in various industries.
Overall Equipment Effectiveness (OEE) is an essential metric used to assess manufacturing efficiency based on the performance of equipment in three significant factors: Availability, Performance, and Quality. Our OEE Improvement Services assist organizations in detecting inefficiencies, removing production losses, and maximizing operational performance to achieve increased productivity and profitability.
In an era defined by rapid industrialization, urban expansion, and climate consciousness, Environmental Impact and Sustainability Studies have emerged as critical tools for responsible decision-making. Governments, investors, and corporations are under growing pressure to adopt sustainable practices that align with global environmental standards. At IMARC Group, we bridge this need by offering comprehensive market intelligence and prefeasibility studies with a dedicated focus on environmental impact and sustainability.
3D modeling and simulation technologies, especially Digital Twins, now serve as laboratories for operational efficiency, product innovation, and predictive maintenance in the era of the digital transformation propelling the industry's evolution. These latest developments permit real-time monitoring and optimization for the lifecycle of any physical asset, system, or process by providing a virtual rendering.
Post-commissioning performance validation is an essential process for guaranteeing that newly commissioned systems, equipment, or facilities are performing as desired, according to design specifications, regulatory requirements, and performance criteria.
Pilot plant setup and evaluation services include designing, building, and running small-volume manufacturing plants for the purpose of testing and proving processes prior to full-scale commercial development. Pilot plant services fill the gap between laboratory experimentation and plant production so that companies can prove technology, determine feasibility, and avoid risk before committing substantial capital.
In today’s dynamic industrial landscape, ensuring the health, safety, and environmental well-being of employees is more critical than ever. Environmental, health, and safety (EHS) training is becoming an essential aspect of responsible corporate practices. It promotes a culture of safety while also guaranteeing adherence to changing regulatory standards. At IMARC Group, we offer customized EHS training solutions aimed at assisting organizations in reducing risk, improving compliance, and fostering robust safety cultures.
In today's dynamic market environment, businesses are under constant pressure to minimize costs, enhance efficiency, and meet customer expectations without overstocking or understocking. At IMARC Group, our Inventory Optimization and Stock Planning Services aim to equip organizations with data-informed insights and practical strategies that effectively align supply with demand.
In today’s fast-paced and highly competitive marketplace, businesses are under increasing pressure to optimize operations, reduce environmental footprints, and comply with evolving regulatory requirements. Equipment Lifecycle Assessment Services (ELAS) offer an all-encompassing method for assessing the efficiency, expenses, ecological effects, and overall sustainability of machinery and equipment for its complete lifespan—from acquisition to disposal.
In today’s hyper-regulated global economy, the difference between a successful market entry and a costly delay often comes down to one word: compliance. Whether you're manufacturing pharmaceuticals, exporting packaged food, or launching consumer electronics, aligning your processes with regulatory standards isn't optional—it's mission-critical.
Multi-vendor coordination and integration services involve the strategic management and seamless unification of multiple vendors, suppliers, and service providers to ensure cohesive operations and optimized performance for your business.
In industries where even the slightest environmental variation can compromise product integrity, the role of clean rooms and cold chain systems becomes paramount. From life-saving pharmaceuticals to temperature-sensitive vaccines and high-precision semiconductors, these operations demand absolute control over air quality and temperature.
In a world where environmental footprint is on the global agenda, waste management has emerged as the defining feature of responsible business and governance. Waste is no longer an afterthought as it used to be. Now it's at the forefront of policy formulation, sustainability reporting, and operational planning.
Establishing a temporary site office and providing utility services requires having fully furnished temporary office facilities with minimal infrastructure to support business operations in remote or project-oriented areas. The establishment of a temporary site office and provision of utility services also provides businesses with an expert working environment that has the necessary utilities, allowing them to focus on temporary work assignments, construction ventures, or expanding into new markets.
In a landmark achievement, India has surpassed Japan to become the world’s fourth-largest economy in 2025, with a nominal GDP of $4.187 trillion, according to the International Monetary Fund (IMF). This milestone, driven by robust growth, strategic reforms, and favorable global conditions, positions India as a global economic powerhouse, trailing only the United States, China, and Germany. As India celebrates this ascent, the nation sets its sights on overtaking Germany to claim the third spot by 2028. Join us as we explore the drivers, implications, and future prospects of India’s economic rise.
In an age defined by resource efficiency, regulatory scrutiny, and rising operational costs, utilities planning is no longer an afterthought—it is a strategic imperative. Whether it's ensuring uninterrupted power in a data center, maintaining air quality in a hospital, or optimizing water and steam systems in a manufacturing plant, intelligent utility planning is the hidden force behind seamless operations.
Raw material sourcing and import advisory services entail the strategic activity of sourcing, screening, and procuring quality raw materials from both local and foreign suppliers. These services help companies obtain cost-effective, dependable, and compliant sources of materials to facilitate smooth production and supply chain operations.
Construction management services, powered by deep market intelligence, provide comprehensive oversight across the entire lifecycle of a construction project—from pre-construction planning to final handover. At IMARC, we integrate data-driven insights into supplier benchmarking, cost forecasting, and regulatory trends to support efficient execution and strategic decision-making.
In a volatile global economy, risk is no longer a question of if but when. Whether it's regulatory changes, supply chain disruptions, cyber attacks, or environmental issues, companies in various industries face uncertainties that can halt growth and profitability. It is here that Risk Assessment and Mitigation Planning Services are no longer a safety measure but a strategic imperative.
Organizations tend to outgrow the facilities that they already have with the fast-paced and ever-changing world of business today. It may be because of growing production requirements, expansion of new markets, or merely maximizing operational efficiencies, facility expansion is always a key component of long-term business planning. Moreover, expanding the facility is not just about expanding space it is about aligning future objectives with infrastructure, reducing risks, and maximizing return on investment.
Vendor auditing and compliance verification are essential procedures for companies that depend on vendors of raw materials and machinery to ensure product quality, operational effectiveness, and regulatory compliance. Vendor auditing is the systematic assessment of vendors to meet specified standards in quality control, financial strength, compliance with laws, and operational dependability. Through careful auditing, companies can manage risks, increase supply chain transparency, and promote long-term, reliable vendor relationships.
In the competitive business environment of the present times, completing projects successfully depends on precise planning and financial management. Project scheduling and cost estimation services are important elements that assist companies in mapping timelines, allocating resources optimally, and estimating project budgets accurately. These services enable organizations to have a systematic mechanism for managing projects, minimizing delays, cost overruns, and scope creep, thereby delivering the project on scheduled time and within the budgeted funds.
In the current competitive and regulation-focused business environment, companies must continuously provide quality, uphold compliance standards, and enhance operational efficiency. A key facilitator for achieving these goals is a Standard Operating Procedure (SOP) - a documented collection of detailed instructions aimed at assisting teams in executing regular tasks reliably and effectively. At IMARC Group, we focus on developing personalized SOPs designed for particular industries and business requirements, guaranteeing your operations stay efficient, adaptable, and compliant.
Installation supervision and equipment commissioning are critical phases in the successful delivery of any capital project. They confirm that equipment, systems, and infrastructure are installed based on technical specifications and run safely and efficiently from their earliest possible start. These services facilitate the identification and rectification of defects early on, cutting down delays, preventing expensive rework, and decreasing long-term operational risks. As industrial projects increase in complexity, proper supervision and formal commissioning are critical to achieve performance goals, comply with regulations, and optimize the return on investment. This process is the basis for dependable, efficient, and safe operations in a broad range of industries.
Contract manufacturer identification services involve the process of locating, evaluating, and selecting reliable manufacturing partners capable of producing goods according to your specifications, quality standards, and business requirements. These services ensure seamless production, cost efficiency, and scalability by identifying manufacturers that align with your operational goals, regulatory compliance, and market demands.
The Bill of Materials (BOM) is a crucial document in the manufacturing process, providing a comprehensive list of all the components, materials, assemblies, and sub-assemblies needed to manufacture a product. BOM preparation services are designed to ensure that every detail of the manufacturing process, from raw materials to finished products, is properly accounted for and organized. At IMARC Group, we offer expert BOM preparation services that help manufacturers streamline production, reduce errors, and optimize costs.
Penetrating new markets is a vital business growth strategy, but it is also fraught with challenges when extending into foreign markets where there are varying regulatory regimes, cultural sensitivities, and business conventions. Perhaps one of the most reliable ways to avoid these challenges is through finding local partners or joint ventures. Local Partner or Joint Venture Identification Services offer companies the necessary assistance required to identify the appropriate local entities that can assist them in overcoming these complexities, driving growth, and realizing operational success in a new market.
On construction and infrastructure projects, on-site delivery of work is a critical aspect to be managed in a manner that projects are delivered on time, within budget, and as per defined quality standards. Site Supervision and Civil Execution Oversight Services aim to ensure that the entire process of construction, starting from planning to execution, adheres to safety requirements, laws, and project specifications. Such services include carefully tracking site work, coordinating contractors, managing resources, and monitoring daily operations to prevent risks and maximize the implementation process.
India and United Kingdom have announced the successful conclusion of a mutually beneficial India – UK Free Trade Agreement (FTA). This forward-looking Agreement is aligned with India’s vision of Viksit Bharat 2047 and complements the growth aspirations of both the countries.
Plant layout and process flow design services optimize the physical arrangement of equipment, workflows, and operational systems within industrial facilities. These services enhance productivity, minimize costs, and ensure seamless material and personnel movement, tailored to your production goals and industry standards.
Procurement Strategy and Cost Benchmarking Services play a pivotal role in optimizing an organization's procurement processes, ensuring that the company gets the best value for its investments. In a world where cost efficiency, sustainability, and strategic sourcing are critical, these services offer businesses the necessary tools to improve their procurement operations and strengthen their competitive position. By offering insights into industry standards, historical data, and best practices, organizations can make informed decisions to streamline their supply chain management, reduce costs, and increase operational efficiency.
In today’s competitive business environment, expanding into new markets or establishing new manufacturing facilities requires careful navigation through local regulations, licensing processes, and government incentives. This is where Industrial Licensing and Incentive Advisory Services come into play. These services guide businesses through the complex regulatory landscape and help them access valuable incentives offered by governments to promote industrial growth.
In today's globalized and competitive market, businesses are constantly seeking ways to improve their supply chain operations. One critical element of a successful supply chain strategy is identifying and evaluating the right suppliers. Supplier Identification and Evaluation Services help businesses find reliable suppliers who can meet their quality, cost, and delivery expectations. At IMARC Group, we offer comprehensive services to guide businesses through the complex supplier selection process, ensuring they partner with the most suitable suppliers to drive efficiency and growth.
Capital Expenditure (CapEx) and Operating Expenditure (OpEx) represent two fundamental pillars of corporate financial management. Capital Expenditure (CapEx) covers investments in assets that fuel future growth—new machinery, property, or digital infrastructure. It builds long-term value, boosts capacity, and often attracts investor confidence.
Starting a new business or expanding an existing one involves substantial risk and investment. To steer through these intricacies, business corporations and entrepreneurs both bank on expert feasibility studies as well as full-fledged business planning services. At IMARC Group, we equip businesses with the insights and strategic tools they require to make informed, data-driven decisions.
Technology transfer services enable the smooth transfer of innovations, knowledge, and technical skills from universities, research institutions, or firms to business enterprises. This enables bridging the innovation-market gap such that advanced technologies are developed, scaled, and commercialized successfully.
In today’s complex project environments, the success of any venture—whether it's an industrial plant, residential development, or large-scale commercial project—largely hinges on the availability and adequacy of utilities and infrastructure. At IMARC Group, we provide utility and infrastructure evaluation services aimed at giving businesses a thorough insight into key support systems that contribute to operational efficiency and project feasibility.
For companies hoping to succeed and last, location analysis and site selection are essential procedures. This service offers a thorough analysis to determine the best geographical areas and sites suited to a client's particular operational requirements and strategic goals. To make sure our recommendations are in complete harmony with your vision, we thoroughly examine your business model, target market, logistical needs, and growth goals.
Distribution partner identification services involve the process of locating, assessing, and selecting reliable and capable partners to distribute your products or services in targeted markets. These services aim to ensure efficient supply chain management, seamless market entry, and expanded business reach by identifying partners that align with your business goals and market requirements.