Top Fintech Companies in India 2026: UPI Market Share of PhonePe, Google Pay, and Paytm
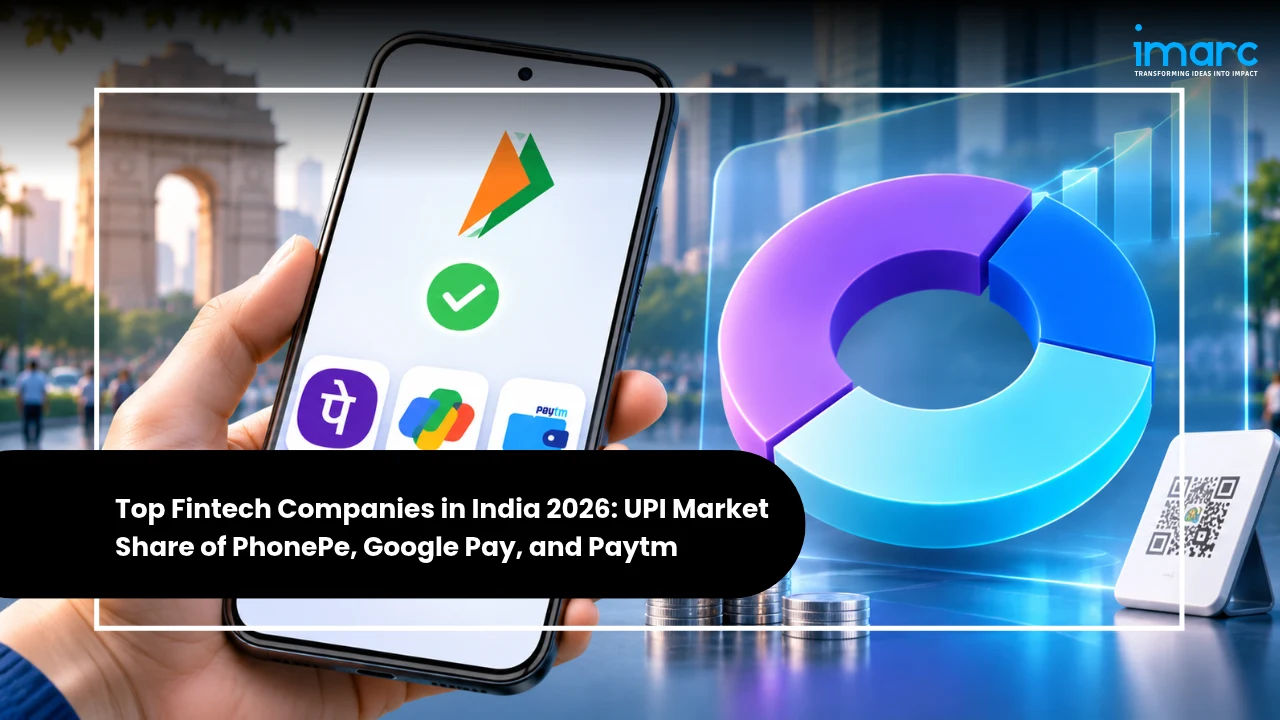
The India’s fintech market was valued at USD 142.5 Billion in 2025 and is projected to reach USD 642.9 Billion by 2034, growing at a CAGR of 16.70% during 2026–2034 (IMARC Group). In UPI, India’s largest digital payments network, PhonePe led in September 2026 with a 45.57% share of transactions, followed by Google Pay at 32.23% and Paytm at 8.1% (National Payments Corporation of India (NPCI)).
India has established itself as one of the world’s most significant fintech markets, driven by rapid digital payment adoption, strong venture capital interest, and expanding partnerships between banks, non-banking financial institutions, and technology companies. This guide by IMARC Group explains who the top fintech companies in India are, how much UPI market share the leading players hold today, and what the upcoming 30% market share cap could mean for them.
India Fintech Market at a Glance
| Metric | Value | Source |
|---|---|---|
| Market size, 2025 | USD 142.5 Billion | IMARC Group |
| Forecast, 2034 | USD 642.9 Billion | IMARC Group |
| CAGR, 2026–2034 | 16.70% | IMARC Group |
| UPI transactions, FY2025 | 185.8 Billion | IMARC Group |
| UPI share of digital retail payments | 83.4% | IMARC Group |
| UPI volume, October 2026 | 25.47 Billion (record) | NPCI |
| UPI value, October 2026 | INR 31.53 lakh crore | NPCI |
| Daily average, October 2026 | 822 Million transactions; INR 1,01,707 crore | NPCI |
UPI is the backbone of this growth. The latest NPCI data shows the momentum continuing: October 2026 set a new record of 25.47 billion transactions worth INR 31.53 lakh crore, up 23% in volume and 16% in value from October 2025. The average daily transaction value crossed INR 1 lakh crore for the first time.
What Are Fintech Companies in India?
Fintech companies in India are technology-led businesses that deliver financial services such as payments, lending, insurance, wealth management, and banking infrastructure through digital channels. IMARC Group classifies the market by application into Payment and Fund Transfer, Loans, Insurance and Personal Finance, Wealth Management, and Others, and by technology into APIs, artificial intelligence, blockchain, robotic process automation, and data analytics.
The result is a competitive field where banks, global technology platforms, and homegrown startups compete, and frequently collaborate, within the same ecosystem.
Who Are the Top Fintech Companies in India?
IMARC Group’s competitive landscape names Paytm, PhonePe, Razorpay, Pine Labs, CRED, Policybazaar, Zerodha, BharatPe, and MobiKwik among the most prominent players, with Google Pay also profiled as a leading UPI platform. The leading profiles are summarised below.
| Company | Leading brands | Key highlights (IMARC Group) |
|---|---|---|
| PhonePe (Walmart Inc.) | PhonePe UPI, PhonePe Financial Services, Digital Gold | Built on a UPI foundation and expanding into insurance distribution and investment products; processed about 9.91 billion transactions in January 2026, roughly 45.7% of UPI volume |
| Google Pay (Alphabet Inc.) | Google Pay UPI | Processed over 7.23 billion transactions in January 2026, roughly a third of total UPI volume |
| Paytm (One97 Communications Ltd.) | Paytm Wallet, Paytm Payments Bank, Digital Gold | Deployed over 13.7 million Soundbox devices by September 2025, embedding itself in everyday small-merchant payments |
| Razorpay | Razorpay Payment Gateway, RazorpayX | Payment infrastructure layer serving startups to large enterprises, with gateway, business banking, and financial automation products and a growing AI roadmap |
| CRED (Dreamplug Technologies Pvt. Ltd.) | CRED | Received RBI authorization as a licensed payment aggregator in March 2026; facilitated 8.5 trillion in payments for about 15 million users in FY2025 |
Beyond these, Pine Labs, BharatPe (Resilient Innovations Pvt. Ltd.), MobiKwik (One MobiKwik Systems Ltd.), and Policybazaar (PB Fintech Limited) each hold meaningful positions in their respective segments and continue to shape how the broader market develops.
Source: IMARC Group, India Fintech Market Report
UPI Market Share of Top Fintech Companies: September 2026
Market share here means each app’s share of UPI transaction volume, the most widely tracked and government-published measure of how fintech apps compete for consumer payments. The table below uses the latest app-wise data from NPCI (September 2026), calculated on the 23.93 billion transactions processed through NPCI-listed apps.
| UPI app | Transactions, Sept 2026 | Share, Sept 2026 | Share, Sept 2025 |
|---|---|---|---|
| PhonePe | 10.91 Billion | 45.57% | 46.47% |
| Google Pay | 7.71 Billion | 32.23% | 35.43% |
| Paytm | 1.94 Billion | 8.1% | – |
| Navi | 1.14 Billion | ~4.8%* | – |
| All other apps | ~2.23 Billion * | ~9.3%* | – |
| PhonePe + Google Pay | ~18.62 Billion * | 77.8% | 81.9% |
Data Source: National Payments Corporation of India (NPCI) figures
What the numbers tell us
- The duopoly is easing, slowly. PhonePe and Google Pay together handled 77.8% of transactions in September 2026, down from 81.9% a year earlier.
- Google Pay lost the most ground. Over twelve months, its share fell 3.2 percentage points, against 0.9 points for PhonePe.
- The top three still dominate. PhonePe, Google Pay, and Paytm together account for roughly 85.9% of volume, which leaves about 14% for every other app combined.
- PhonePe’s share has held steady. IMARC Group’s data put PhonePe at about 45.7% in January 2026, almost identical to its September level, while Google Pay has slipped from roughly a third of volume to 32.23%.
IMARC Group also flags this concentration as one of the more consequential open questions for the sector, since regulatory intervention may eventually be required to address competitive balance.
What Is the 30% UPI Market Share Cap?
NPCI proposed the cap in November 2020 to prevent over-concentration: no single third-party UPI app provider should process more than 30% of total UPI volume. The cap is measured on a rolling three-month basis, and under the framework an app above the limit could be restricted from onboarding new users. The compliance deadline has been extended several times and currently stands at 31 December 2026, per the latest NPCI circular. Check NPCI for any update before making decisions.
| App | Share, Sept 2026 | Gap above 30% cap |
|---|---|---|
| PhonePe | 45.57% | +15.57 percentage points |
| Google Pay | 32.23% | +2.23 percentage points |
For PhonePe, compliance would mean a substantial change in how it grows its user base. For Google Pay, the gap is far narrower. For challengers such as Paytm, Navi, and newer entrants, the cap represents an opening to capture share. Merchants and fintech builders, meanwhile, will want to support multiple UPI apps rather than depend on two.
Source: NPCI, UPI Applications Data (September 2026)
Which Segments Lead India’s Fintech Market?
| Segment | Leading category | Market share, 2025 |
|---|---|---|
| Deployment mode | Cloud-Based | 64.7% |
| Technology | Application Programming Interface | 27.9% |
| Application | Payment and Fund Transfer | 46.5% |
| End user | Banking | 41.8% |
| Region | West and Central India | 34.6% |
Cloud infrastructure has become the operational backbone for most fintech firms because it scales with fluctuating transaction loads. APIs, the most widely used technology, enable secure data exchange across banks and third-party providers. Payments and fund transfers lead applications because UPI normalised instant, near-free digital payments, while banks lead end users as they partner with fintechs to modernise their digital infrastructure.
Regionally, West and Central India leads, anchored by Mumbai and Pune. Delhi NCR drives North India’s lending and B2G payments activity, Bengaluru anchors South India as the most technologically advanced hub, and East India is emerging around financial inclusion, microfinance digitisation, and agri-fintech.

Key Trends and Growth Drivers, 2026–2034
IMARC Group identifies several forces shaping the leading fintech companies:
- Real-time payments: UPI and mobile wallets continue to anchor everyday transactions, with merchant payments growing as a share of volume.
- Artificial intelligence: Fintech firms are applying AI to fraud detection, customer service, and credit risk assessment, extending credit to borrowers excluded by traditional models.
- API-driven open banking: Secure data exchange enables digital lending, embedded finance, and personal finance tools.
- Tier-2 and tier-3 expansion: Smaller cities are becoming the primary growth frontier, supported by vernacular and voice-first interfaces.
- Embedded finance: E-commerce and ride-hailing platforms now offer lending, insurance, and investing within their core products.
- Financial inclusion and lending: The Account Aggregator framework, digital lending platforms, and neobanks widen the addressable base.
The main restraints are regulatory complexity, market concentration in digital payments, and rising cybersecurity and data protection demands.
Listed Fintech Companies in India
Among the players in IMARC Group’s list, Paytm (One97 Communications Ltd.), Policybazaar (PB Fintech Limited), and MobiKwik (One MobiKwik Systems Ltd.) are public limited companies. PhonePe has filed for a public offering, but a listing date had not been announced as of this writing. Listing status changes, so confirm the current position of any company on the NSE and BSE websites.
Who Regulates Fintech Companies in India?
There is no single fintech regulator; oversight depends on the activity. The Reserve Bank of India (RBI) oversees payments, payment aggregators, and digital lending, and NPCI operates UPI under its framework. SEBI regulates investment and broking platforms, and IRDAI regulates insurance. IMARC Group notes that RBI guidelines on digital lending and data localisation evolve frequently, pushing fintechs to invest in regulatory technology for continuous compliance.
Get the Full IMARC Group India Fintech Market Report
This article summarises the headline findings. The full report, India Fintech Market Size, Share, Trends and Forecast by Deployment Mode, Technology, Application, End User, and Region, 2026–2034, goes much deeper.
| Report feature | Details |
|---|---|
| Base year / historical | 2025 / 2020–2025 |
| Forecast period | 2026–2034 |
| Units | USD Billion |
| Segments covered | Deployment Mode, Technology, Application, End User, Region |
| Includes | Market drivers and challenges, Porter’s five forces, competitive landscape |
| Customization | 10% free customization |
| Delivery | PDF and Excel |
Frequently Asked Questions
1. How many fintech companies are there in India?
There is no single official count, because the number depends on how fintech is defined. IMARC Group’s report profiles the leading names, including Paytm, PhonePe, Razorpay, Pine Labs, CRED, Policybazaar, Zerodha, BharatPe, Lendingkart, and MobiKwik, alongside Google Pay.
2. What are the top 10 fintech companies in India?
IMARC Group’s list of prominent players includes Paytm, PhonePe, Razorpay, Pine Labs, CRED, Policybazaar, Zerodha, BharatPe, Lendingkart, and MobiKwik. The list is not a revenue ranking.
3. What is the size of the India fintech market?
IMARC Group values it at USD 142.5 Billion in 2025, projected to reach USD 642.9 Billion by 2034, at a CAGR of 16.70%.
4. Which company has the highest UPI market share?
PhonePe, with 45.57% of UPI app transactions in September 2026, followed by Google Pay at 32.23% and Paytm at 8.1%, per NPCI.
5. Which fintech segment is largest?
Payment and fund transfer, with a 46.5% share of the market in 2025.
6. How to start a fintech company in India?
Choose a segment such as payments, lending, insurance, or wealth, then confirm the licences that apply from the RBI, SEBI, or IRDAI. Most new entrants partner with banks or NBFCs and build compliance in from day one. This is general information, not legal advice.
Sources: IMARC Group, India Fintech Market report; NPCI UPI Product Statistics (October 2026) and NPCI UPI Applications data (September 2026)
Our Clients







Contact Us
Have a question or need assistance?
Please complete the form with your inquiry or reach out to us at
Phone Number
+91-120-433-0800+1-201-971-6302
+44-113-547-7077
Previous Post

The Japan cyber insurance market is entering a period of sustained expansion, driven by a convergence of rising cyberattack frequency, sweeping regulatory reform, and deepening enterprise digitalization. According to IMARC Group, the market was valued at USD 1,005.66 Million in 2025 and is projected to reach USD 4,798.00 Million by 2034, advancing at a compound annual growth rate (CAGR) of 18.96% from 2026 to 2034.
Japan spent decades as a market where conglomerates held non-core units indefinitely and founders passed businesses to family. Both assumptions have broken down, and private capital is absorbing the change.
Investor capital is rotating away from traditional Metro Manila residential product for a simple, measurable reason: the condominium market is oversupplied. Metro Manila closed 2025 with a residential vacancy rate of 24.7%, projected to peak at a record 25.6% by end-2026 as roughly 13,000 new units complete, nearly double 2025 deliveries, with Bay Area vacancy potentially approaching 60%.
Australia's property sector is drawing renewed investor attention because population-driven demand, a persistent housing shortage, and a tightening foreign investment regime are reshaping who can enter and how.
The Commercial Insurance Market reached USD 979.7 Billion in 2025 and is projected to reach USD 1,701.8 Billion by 2034, growing at a CAGR of 6.01% (2026–2034).
The Australia private equity industry is experiencing transformative growth as institutional investors increasingly allocate capital to high-potential sectors, including technology, healthcare, and renewable energy. The Australia private equity market size reached USD 23.9 Billion in 2025 and is projected to surge to USD 48.5 Billion by 2034, exhibiting a robust compound annual growth rate (CAGR) of 8.21% during 2026-2034.
The global maritime sector operates as the backbone of international trade, facilitating the movement of the world’s goods by volume. Within this vast and complex ecosystem, the marine insurance market plays an indispensable role by providing financial protection against risks inherent to maritime operations. From hull and machinery coverage to cargo, liability, and protection and indemnity (P&I) insurance, marine insurance safeguards the assets, revenues, and reputation of shipowners, cargo operators, and logistics companies.
The Australian travel insurance market has grown from a value-added travel product to a necessary protection for travelers. As confidence in domestic and foreign travel increases, Australian travelers increasing value full coverage against unexpected events like medical issues, flight cancellations, and trip interruptions.
Australia’s wealth management industry is undergoing a profound transformation, driven by rapid technological advancements, evolving investor behavior, and the increasing integration of artificial intelligence (AI) in financial services. The nation’s strong economic fundamentals, coupled with its expanding base of high-net-worth individuals (HNWIs) and robust superannuation system, have established a solid foundation for sustained market growth.
The Australia investment banking industry is experiencing transformative growth driven by technological innovation, sustainable finance initiatives, and robust mergers and acquisitions activity. With market valuations reaching USD 7.9 Billion in 2024, the sector demonstrates remarkable resilience despite global economic uncertainties.
The Australian fintech industry stands as one of the most dynamic and rapidly expanding financial technology ecosystems in the Asia-Pacific region. The market reached USD 4.10 Billion in 2024 and is projected to surge to USD 9.50 Billion by 2033, representing a compound annual growth rate (CAGR) of 8.90%. This remarkable trajectory positions Australia as a global fintech powerhouse, with around 767 companies operating across major capital cities including Sydney, Melbourne, and Brisbane.
Australia’s equity market is leaning into artificial intelligence as a practical lever for returns, liquidity, and product innovation. By size, the Australia stock market reached USD 72.9 Million in 2024 and is projected to hit USD 114.4 Million by 2033 at a 5.13% CAGR (2025–2033). Those headline figures sit on top of an economy where listed companies already deploy AI in operations, compliance, and customer-facing tools, while market plumbing: data centers, cloud, and connectivity, ramps for GPU-heavy workloads.
The Australian cryptocurrency market is experiencing significant growth, with the rise of digital assets capturing both public and institutional interest. Driven by technological innovation, evolving regulations, and increasing institutional adoption, the Australia cryptocurrency exchange market was valued at USD 975.76 Million in 2024, stated by the IMARC Group.
India’s real estate market is entering a new phase of structured growth, driven by a powerful confluence of factors. The real estate market size in India was valued at approximately USD 482 Billion in 2024, is being reshaped by robust residential demand, the expansion of commercial spaces, and increasing institutional investment.
In a progressively interconnected world, where digital operations form the backbone of commerce and daily life, the specter of cyber threats is no longer rare – it is becoming a daily headline. From phishing scams to full-blown ransomware assaults, cyber threats are evolving faster than most businesses can react.
India’s foreign exchange market has emerged as a crucial component of the nation's financial system. Over the past decade, its scale, depth, and liquidity have expanded significantly, fueled by increasing international trade volume, attracting foreign investments (FDI and FII), and facilitating outbound remittances.
India's real estate market is rapidly transforming, driven by urbanization, economic growth, and evolving consumer preferences. Real estate is no longer limited to residential and commercial properties; it is shaping infrastructure, technology-driven housing, and sustainable developments. With increasing investments, policy reforms, and rising demand for smart and affordable housing, the sector is witnessing significant expansion.
Real estate represents tangible property encompassing land and any enhancements, whether natural or artificial, affixed to it. It can serve various purposes, including residential, commercial, agricultural, and industrial. Ownership of real estate can belong to a government, a corporate entity, or a private party. The value of real estate is often influenced by factors such as location, demand, economic conditions, and market trends. Real estate markets can vary significantly from one region to another, with factors like population growth, urbanization, and infrastructure development playing crucial roles in shaping these markets.
The combustion of fossil fuels results in the release of a substantial amount of greenhouse gases, mainly carbon dioxide. Carbon dioxide emissions occur directly or indirectly from individuals, organizations, events, or products. A carbon footprint measures the environmental impact in terms of carbon emissions. Governments and organizations worldwide are engaged in various initiatives to reduce carbon emissions. In 1992, the United Nations Framework Convention on Climate Change (UNFCCC) introduced the "Kyoto Protocol," an international agreement aimed at significantly reducing greenhouse gas emissions. Adopted in Kyoto, Japan, on December 11, 1997, it became international law on February 16, 2005. Under the Kyoto Protocol, countries were allocated a maximum number of carbon credits. If a country exceeded its assigned limit, penalties in the form of a reduced emissions cap for the subsequent period were imposed.