Solar Power Plant Setup Cost in India: Manufacturing Process Flow, Machinery, DPR & Financial Model 2026
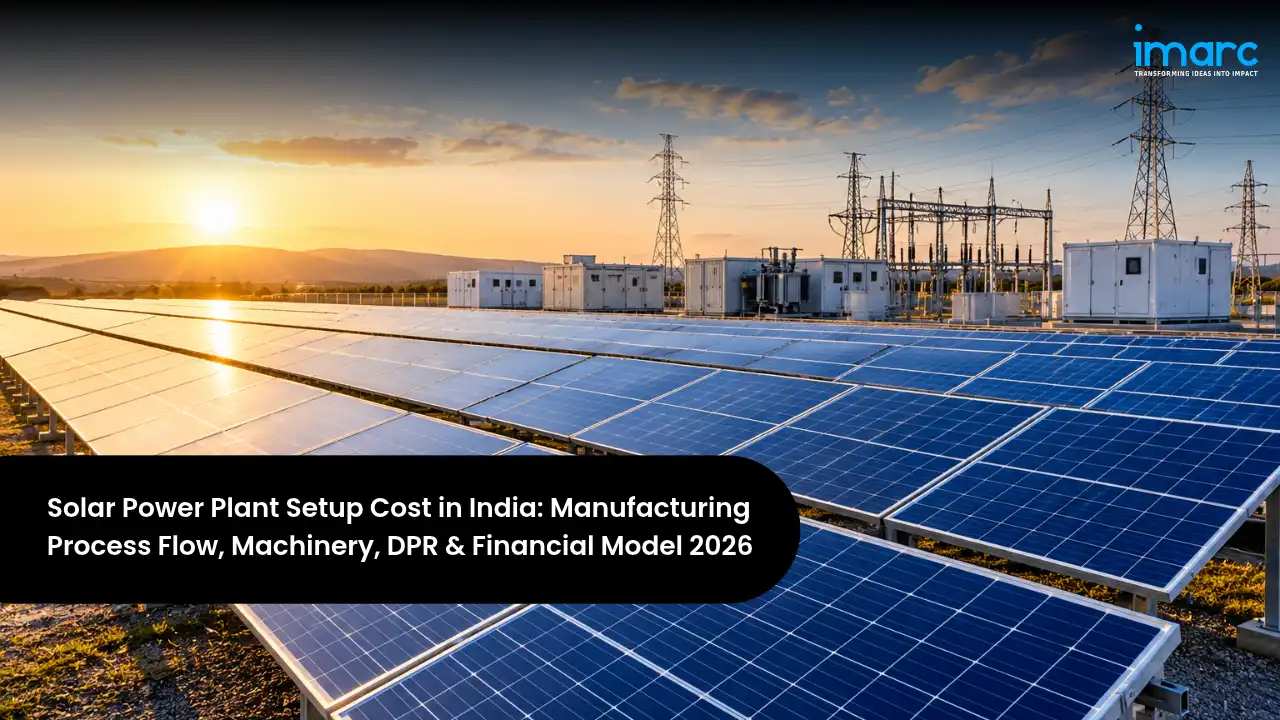
A utility-scale photovoltaic project turns sunlight into electricity through fields of PV modules, converts it from DC to AC in inverters, steps up the voltage, and feeds it into the grid for sale under long-term power purchase agreements. It is now the cheapest source of new daytime electricity in India, with recent central auctions clearing at about INR 2.6 per unit, and it sits at the centre of the national target of 500 GW of non-fossil capacity by 2030. India added a record 44.61 GW of solar in FY2026, taking cumulative capacity past 150 GW, and IMARC values the global market at about USD 170.23 billion in 2025. With falling tariffs, a deep pipeline of tenders, and growing demand from industry, Solar Power Plant Setup in India has become one of the most bankable infrastructure investments for developers and long-term investors.
Investment depends mainly on capacity, whether the project uses fixed-tilt structures or single-axis trackers, the type and origin of modules, the DC to AC ratio, land cost, the distance to the grid substation, and whether battery storage is added. The Solar Power Plant Cost ranges from about INR 4–25 crore for a 1 to 5 MW captive or open access project, to INR 175–225 crore for a 50 MW ground-mounted plant, and INR 1,750–2,500 crore or more for 500 MW installations inside solar parks. Modules alone make up close to half of the capital, and the shift to domestically made cells from June 2026 has pushed system prices up. Once built, operating costs are very low, so returns are driven by capital cost, generation yield, tariff, and the cost of debt.
This guide is written for investors exploring how to start a Solar Power plant in India. It focuses on a ground-mounted grid-connected project of about 50 MW AC (around 65 MWp DC) on single-axis trackers, selling to a central agency, a state DISCOM, or industrial buyers through open access, and also explains smaller captive projects and large park-based installations. It covers project types and buyers, the demand outlook, the generation process flow, key components and inputs, location and infrastructure, a detailed cost and financial breakdown, approvals, and how a DPR and financial model turn all of this into a bankable plan.
India Market Snapshot
| Key Facts | Details |
|---|---|
| Global Market (2025) | About USD 170.23 Billion |
| Global Market Forecast (2034) | USD 468.28 Billion, 11.9% CAGR |
| India Additions (FY2026) | 44.61 GW, a Record |
| India Cumulative Capacity | Over 150 GW (Mid-2026) |
| Recent Auction Tariffs | INR 2.57 – 2.64 per kWh |
| Indicative Total Investment | INR 4 Crore to 2,500+ Crore |
The snapshot shows a large and fast-growing sector in which India is now one of the biggest markets in the world. Tariffs are among the lowest anywhere, so projects win on tight cost control, high generation yield, and cheap finance rather than on price. Access to land and grid connectivity, rather than demand, has become the main constraint on new capacity.
Investment Highlights
Indicative Project Cost in India (2026)
| Parameter | Value |
|---|---|
| Product Range | Grid power, RECs, carbon credits |
| Plant Capacity | 1 MW – 500+ MW (AC) |
| Total Project Investment | INR 4–25 Crore (1–5 MW) to 175–225 Crore (50 MW plant) |
| Payback Period | 7 – 9 Years |
| Net Profit Margin | 15 – 30% |
| Equity IRR | 12 – 15% |
| Preferred States | Rajasthan, Gujarat, Karnataka, Maharashtra, Andhra Pradesh, Madhya Pradesh |
| Key Requirement | Land, grid access, signed PPA |
These ranges provide a realistic frame for early planning, but actual returns depend on module and tracker prices, domestic content rules, solar irradiance at the site, the capacity utilisation factor, tariff and buyer credit quality, transmission and open access charges, grid curtailment, land lease terms, and the interest rate on long-term debt. A site-specific Solar Power Feasibility Report narrows each of these assumptions to your chosen capacity, location, technology, and buyers.
Table of Contents
- What is Solar Power Manufacturing?
- Why is Solar Power Manufacturing Growing in India?
- Solar Power Manufacturing Process Flow
- Raw Materials Required for Solar Power Manufacturing
- Location, Land & Infrastructure
- Solar Power Manufacturing Machinery and Equipment
- Solar Power Manufacturing Plant Setup Cost in India (CapEx & OpEx)
- Financial Analysis and Profitability
- Licenses and Approvals for Solar Power Manufacturing in India
- Recent Developments in the India Solar Power Manufacturing Industry
- How a Solar Power Manufacturing Project Report and DPR Helps Investors
- Frequently Asked Questions
What is Solar Power Manufacturing?
A utility-scale PV project is a large array of solar modules mounted on steel structures, wired into inverters and transformers, and connected to the grid through a substation. Modern Indian projects mostly use bifacial TOPCon modules, which capture light on both faces, mounted on single-axis trackers that follow the sun from east to west. A well-designed site in Rajasthan or Gujarat delivers a capacity utilisation factor of about 24 to 29% on an AC basis, which means each megawatt produces roughly 2.1 to 2.5 million units a year. Yield, availability, degradation, and the cost of each unit decide value.
Commercially, the electricity is sold under 25-year contracts to central agencies such as SECI, NTPC, NHPC, and SJVN, directly to state DISCOMs, to industrial and commercial buyers through open access or captive structures, or on power exchanges, with renewable energy certificates and carbon credits as extra income. A Solar Power Plant can serve several of these buyers through one grid connection, with a mix of long-term and merchant sales. Buyers value low tariffs, reliable supply, and green credentials that count toward their renewable purchase obligations.
- Central Agencies: SECI, NTPC, NHPC, SJVN tenders.
- State DISCOMs: Direct state auctions.
- Industry: Open access and captive supply.
- Exchanges: Merchant sales and RECs.
The Main Project Types and Applications
Choosing the project type is the most important commercial decision, because it determines scale, location, buyer, and risk:
| Project Type | Description | Key Feature | Primary Buyer |
|---|---|---|---|
| Utility Tender | Large ground-mounted | Fixed 25-year tariff | SECI, DISCOMs |
| Solar Park Plot | Plug-and-play site | Shared evacuation | Central agencies |
| Open Access | Third-party supply | Savings for buyer | Industry, data centres |
| Captive / Group | Owned by consumers | Lower charges | Factories, campuses |
| Solar with Storage | PV plus batteries | Peak or firm supply | Peak power tenders |
| Merchant Plant | Exchange sales | Price upside | IEX, PXIL |
These choices shape the whole project. Central tenders offer secure, long contracts with strong counterparties but very low tariffs, while open access and captive projects earn higher prices from industrial buyers but depend on state charges and the buyer's credit.
Why is Solar Power Manufacturing Growing in India?
Key Growth Drivers in India
Demand is supported by national targets, rising electricity use, and the low cost of solar generation:
- National target: India aims for 500 GW of non-fossil capacity by 2030.
- Power demand: Industry, cooling, and electrification keep peak demand rising.
- Lowest-cost power: New solar is cheaper per unit than new coal generation.
- Corporate buyers: Industry and data centres seek green power through open access.
- Policy support: Solar parks, transmission waivers, and steady central tenders.
India-Specific Market Opportunity
| Segment | Market Context | Project Role |
|---|---|---|
| Central Tenders | Steady auctions | Large contracted plants |
| State DISCOMs | RPO compliance | State-level projects |
| C&I Open Access | Green energy rules | Mid-size plants |
| Storage Tenders | Evening peak | Solar plus batteries |
| Agricultural Feeders | PM-KUSUM scheme | Small distributed plants |
The strongest opportunity for new entrants lies in mid-size open access and captive projects for industrial buyers, in solar-plus-storage plants for evening peak supply, and in distributed plants for agricultural feeders. Developers that secure land with grid access, sign creditworthy buyers, and control capital costs will be best placed to grow.
Solar Power Manufacturing Process Flow
Understanding the development and generation flow helps you plan design, layout, and where cost and yield are decided. The flow runs from resource assessment and land acquisition through grid connectivity, site preparation, piling and mounting structures, module installation, DC cabling, inverters, step-up transformers, the pooling substation and transmission line, and finally testing, commercial operation, and long-term operation and maintenance. Module choice and tracker design decide yield, while evacuation and grid connection usually decide the timeline.
The Solar Power Manufacturing Process Flow
The sequence below reflects a 50 MW ground-mounted project on single-axis trackers. Projects inside solar parks skip much of the land and evacuation work.
| Unit Operation | Key Activity |
|---|---|
| Resource Assessment | Irradiance, soil, grid |
| Land & Connectivity | Lease, grid approval |
| Site Preparation | Grading, drainage |
| Piling & Structures | Trackers or fixed tilt |
| Module Installation | Strings on tables |
| DC Cabling | Strings to inverters |
| Inverters | DC to AC conversion |
| Step-up Transformers | 33 kV collection |
| Substation & Evacuation | 220 kV grid link |
| Testing, COD & O&M | SCADA, cleaning |
Two factors decide profitability across this flow. The first is energy yield, because revenue is units sold multiplied by tariff, so irradiance, module efficiency, bifacial gain, tracking, the DC to AC ratio, soiling, and plant availability directly set income. The second is capital cost and timing, since nearly all spending happens before the first unit is sold, and delays in land, connectivity, or module supply add interest costs and can trigger tariff penalties under the contract.
Raw Materials Required for Solar Power Manufacturing
The main inputs are PV modules, galvanised steel for structures and trackers, copper and aluminium cables, inverters and transformers, and during operation, water for module cleaning, spare parts, and land on long lease. Modules now must come from manufacturers on the government's approved list, and projects under central and state schemes must use domestically made cells.
| Input | Role in Project | India Sourcing | % of Project Cost |
|---|---|---|---|
| PV Modules | Convert sunlight | ALMM-listed makers | 45–52% |
| Steel Structures | Hold, track modules | Domestic fabricators | 10–14% |
| Cables | Carry DC and AC power | Domestic makers | 4–6% |
| Inverters | Convert DC to AC | Domestic, imported | 4–6% |
| Cleaning Water | Remove dust | Local supply, robots | Recurring cost |
Modules are by far the largest cost, and their price depends on cell origin, technology, and supply conditions in the domestic market.
Location, Land & Infrastructure
Site selection for a PV project is driven by high solar irradiance, flat and affordable land, proximity to a substation with spare capacity, and state policies on land, open access, and banking. Other factors include soil conditions for piling, dust and water availability for cleaning, flood risk, access roads for heavy deliveries, and the cost of transmission to the buyer. Because grid capacity is now scarce in many high-irradiance areas, securing connectivity early is often as important as finding the land itself.
Choosing the Best Location for Solar Power Plant Setup
| State / Region | Why It Works | Key Advantage |
|---|---|---|
| Rajasthan | Bikaner, Jodhpur, Jaisalmer | Highest irradiance |
| Gujarat | Khavda, Kutch, Dholera | Land, policy |
| Karnataka | Pavagada, Tumakuru | Mature parks |
| Maharashtra | Feeder solarisation | Large demand |
| Andhra Pradesh | Kurnool, Anantapur | Parks, policy |
| Madhya Pradesh | Rewa, Neemuch, Agar | Parks, PPAs |
Rajasthan and Gujarat lead national additions thanks to strong sunlight and large land banks, while Karnataka, Andhra Pradesh, and Madhya Pradesh offer established solar parks. The final choice should weigh irradiance, land cost, grid capacity, buyer location, and state charges.
Quality, Safety and Performance Systems
A bankable project needs modules and inverters that meet BIS and IEC standards, factory inspection and testing of modules before shipment, and independent engineers to check design, construction, and performance. During operation, a SCADA system with weather stations tracks generation against expected yield, and regular thermal imaging and electroluminescence tests find faulty modules early. Safety focuses on high-voltage DC and AC equipment, fire risk in cables and inverters, and work at height, while grid code compliance covers forecasting, scheduling, and reactive power. Environmental care covers water use for cleaning, drainage, and land restoration. An experienced Solar Power Plant Consultant in India can help plan capacity, technology, layout, and connectivity so the project meets lender and grid requirements from the start.
Infrastructure Requirements (50 MW AC Plant)
| Infrastructure Element | Specification | India-Specific Note |
|---|---|---|
| Plant Land | 175 – 250 acres | Lease or purchase |
| Pooling Substation | 33/220 kV | Shared in parks |
| Transmission Line | To ISTS or state grid | Connectivity approval |
| Roads & Drainage | All-weather access | Monsoon proofing |
| Water for Cleaning | Robotic or manual | Scarce in deserts |
| SCADA & Weather Station | Real-time data | Grid code compliance |
| Fencing & Security | Full perimeter | Theft prevention |
Contiguous land with clear title, a confirmed grid connection with enough capacity, and a reliable evacuation line are the most important infrastructure requirements, since they decide both cost and the commissioning date.
Solar Power Manufacturing Machinery and Equipment
The equipment set covers power generation, conversion, voltage step-up, evacuation, monitoring, and maintenance. Modules account for most of the investment, followed by trackers and structures, inverters, transformers, and the substation.
| Equipment | Function | Key Specification |
|---|---|---|
| PV Modules | Generate DC power | Bifacial TOPCon |
| Single-axis Trackers | Follow the sun | East-west tracking |
| Inverters | Convert DC to AC | String or central |
| Inverter Transformers | Step up voltage | 0.8/33 kV |
| DC & AC Cables | Carry power | Copper, aluminium |
| Combiner Boxes & ACDB | Collect circuits | Protection built in |
| Switchgear & Protection | Isolate faults | 33 kV panels |
| Power Transformer | Grid voltage | 33/220 kV |
| SCADA & Weather Station | Monitor output | Remote control |
| Cleaning Robots | Remove dust | Waterless option |
| Battery Storage | Shift energy | Optional add-on |
Equipment should follow the project plan. A 1 to 5 MW captive project usually uses fixed-tilt structures, string inverters, and a simple connection at 11 or 33 kV, while a 50 MW or larger plant adds trackers, a dedicated pooling substation, a high-voltage line, and more advanced monitoring.
Solar Power Manufacturing Plant Setup Cost in India (CapEx & OpEx)
The tables below break down capital and operating costs for a ground-mounted 50 MW AC project in India on single-axis trackers. The final Solar Power Investment Cost for your project will depend on capacity, module type and origin, tracker or fixed-tilt design, land cost, distance to the grid, storage, and location.
Capital Expenditure (CapEx) Cost Structure
| CapEx Component | % of Total CapEx | What It Covers |
|---|---|---|
| PV Modules | 45–52% | ALMM, domestic cells |
| Trackers & Structures | 10–14% | Steel, piling |
| Inverters & Electricals | 14–18% | Inverters, cables |
| Substation & Evacuation | 6–10% | Transformer, line |
| Civil Works, Land & Site | 5–8% | Grading, roads |
| Pre-operatives & IDC | 3–5% | Fees, interest |
Modules make up the largest share, and the rule requiring domestically made cells has raised their cost compared with imported cells. Because of this, a detailed Solar Power Business Plan should model module prices and delivery schedules, tracker gain, the DC to AC ratio, yearly degradation, plant availability, grid curtailment, tariff and buyer credit, open access charges, land lease escalation, inverter replacement, and debt terms together, so that funding supports the project over its 25-year life.
Operating Expenditure (OpEx) Cost Structure
| OpEx Component | % of Total OpEx | India-Specific Note |
|---|---|---|
| O&M Contract | 35–45% | Cleaning, upkeep |
| Land Lease | 10–15% | Yearly escalation |
| Insurance | 8–12% | Asset, weather |
| Grid & Scheduling Charges | 10–15% | Forecasting, SLDC |
| Spares & Replacements | 8–12% | Inverters, modules |
| Admin, Security & Audits | 10–15% | Staff, guards |
Operating costs are small, at roughly INR 5 to 7 lakh per MW a year, so margins depend mainly on generation, tariff, and timely payment by the buyer. A good operating model tracks units generated against expected yield, plant availability, curtailment, soiling losses, and receivables, and tests results against lower irradiance, higher degradation, or payment delays.
Financial Analysis and Profitability
Based on analysis of a 50 MW AC ground-mounted project, the financial profile is capital intensive with very stable, contracted cash flows, high operating margins, and a long asset life, but returns are sensitive to capital cost, yield, tariff, and interest rates. The profitability of Solar Power business in India improves markedly with high-irradiance sites, trackers and bifacial modules, low-cost long-tenor debt, creditworthy buyers, open access sales to industry at higher tariffs, and income from renewable energy certificates.
| Financial Metric | Indicative Value | India Context |
|---|---|---|
| EBITDA Margin | 85–90% | Very low running costs |
| Net Profit Margin | 15–30% | Rises as debt is repaid |
| Payback Period | 7–9 Years | Capital intensive |
| Equity IRR | 12–15% | With 70–75% debt |
| Capacity Utilisation Factor | 24–29% | With trackers, bifacial |
| Debt Service Coverage Ratio | 1.20–1.35x | Lender minimum |
Capital cost and generation decide where a project lands within these ranges. Projects with excellent sites, low-cost equipment, and long fixed-tariff contracts earn steady infrastructure-like returns, while merchant projects carry more price risk.
Returns can be strengthened by adding batteries for higher evening prices, selling to industrial buyers under open access, refinancing at lower rates after commissioning, earning carbon credits, and using robotic cleaning to cut soiling losses.
Key Risks and Mitigation
The main risks are module price and supply swings, delays in land and grid connectivity, curtailment, late payment by buyers, lower-than-expected yield, and interest rate changes. Price risk is reduced by early supply contracts; connectivity risk by choosing solar parks or securing access first; curtailment risk by contract clauses and storage; payment risk by payment security mechanisms and strong buyers; yield risk by bankable resource studies; and rate risk by fixed-rate or hedged debt. Promoters often work with a Solar Power Business Plan Consultant in India to test these scenarios before committing capital.
Licenses and Approvals for Solar Power Manufacturing in India
Approvals for a PV project centre on land, grid connectivity, the power sale contract, equipment compliance, and electrical safety, along with standard business registrations. Promoters setting up a Solar Power Plant in India generally need the following:
- Grid Connectivity: Connectivity from CTUIL for the inter-state grid, or from the state transmission utility.
- Power Sale Contract: PPA with an agency, DISCOM, or buyer, and tariff adoption by the regulator.
- Land: Land use conversion, lease registration, and state nodal agency registration.
- Equipment Compliance: ALMM-listed modules, domestic cells where required, and BIS certification.
- Electrical Safety: CEA or Electrical Inspector approval before energisation.
- Environment & Local: State pollution board check, panchayat NOC, and forest clearance if needed.
- Business & Tax Registrations: Company incorporation, GST, Udyam, and Import Export Code if importing.
Land acquisition, grid connectivity, and the power sale contract are usually on the critical path, followed by equipment supply and safety inspection.
Note: The exact approvals, registrations, licenses, and certification requirements may vary depending on factors such as plant location, capacity, products, state pollution control categories, customer specifications, and applicable regulations. Businesses are advised to undertake a detailed regulatory assessment during the project planning stage to ensure full compliance and timely implementation.
Recent Developments in the India Solar Power Manufacturing Industry
Several recent developments give useful context for investors considering this market:
- Record year: In FY2026, India added a record 44.61 GW of solar, against 23.83 GW a year earlier, with Rajasthan and Gujarat leading.
- Domestic cells: From June 2026, the ALMM List-II rule requires domestically made cells in covered projects, and Wood Mackenzie expects utility system prices to rise about 20% by Q4 2026.
- Cost benchmark: In September 2026, CTUIL published an indicative cost of about INR 3.5 crore per MW and about 3 acres of land per MW.
- Pipeline: In January to September 2026, India added 35.2 GW of solar, with a pipeline of about 149 GW, though utility-scale additions slowed by quarter.
The common thread is very fast growth alongside rising equipment costs and tighter grid capacity. Developers who secure land with connectivity, lock in module supply, and sign strong buyers will be best placed to grow.
How a Solar Power Manufacturing Project Report and DPR Helps Investors
A detailed DPR provides a structured roadmap for the venture, from market and buyer strategy to site selection, resource assessment, technology choice, plant layout, connectivity, approvals, and economics. It helps investors decide the right capacity, location, and sales model, estimate capital and operating expenditure, assess profitability, and identify risks before committing funds.
At its core is a detailed Solar Power Financial Model covering hourly or monthly generation, the capacity utilisation factor, yearly degradation, plant availability, curtailment, tariff and escalation, open access and transmission charges, O&M, land lease, insurance, inverter replacement, depreciation, taxes, financing, debt servicing, cash flows, return on investment, and payback under different yield and tariff scenarios. Banks and investors rely on this model to judge long-term viability, which is why many promoters appoint a Solar Power Plant Project Report Consultant in India to prepare the report and validate its assumptions against current market data.
For a PV project, a strong DPR also clarifies the land and connectivity plan, the module sourcing strategy under domestic content rules, the buyer and contract structure, and the financing plan, which together are the factors most likely to decide success.
Frequently Asked Questions
What are the first steps to set up a solar power manufacturing project in India?
Start by choosing the sales route, such as a central tender, a state auction, or an open access contract with an industrial buyer. Then commission a feasibility study and DPR, secure land and grid connectivity, choose modules, trackers, and inverters, sign the power sale contract, obtain approvals, and arrange project financing.
How much does it cost to set up a solar power manufacturing project in India?
Investment ranges from about INR 4–25 crore for a 1 to 5 MW captive or open access project to INR 175–225 crore for a 50 MW ground-mounted plant, and INR 1,750–2,500 crore or more for 500 MW in solar parks.
What are the main steps in building and running the solar power project?
The flow runs from resource assessment, land, and connectivity through site preparation, piling and structures, module installation, DC cabling, inverters, step-up transformers, the substation and evacuation line, and testing, commercial operation, and O&M.
Which equipment does the solar power manufacturing plant need?
Key equipment includes PV modules, single-axis trackers or fixed structures, inverters, inverter transformers, DC and AC cables, combiner boxes, switchgear, a power transformer, SCADA and weather stations, cleaning robots, and optional battery storage.
How much land is needed for solar power manufacturing plant?
A ground-mounted plant typically needs about 3 to 5 acres per MW AC, depending on trackers, the DC to AC ratio, and terrain, so a 50 MW project needs roughly 175 to 250 acres.
How profitable is a solar power manufacturing project in India?
A well-run 50 MW project typically earns an EBITDA margin of 85 to 90% and an equity IRR of 12 to 15%, with payback in about 7 to 9 years. Profitability depends on capital cost, yield, tariff, and the cost of debt.
Which approvals does the solar power manufacturing project need in India?
Typical approvals include grid connectivity, the power sale contract and tariff adoption, land use conversion and lease registration, ALMM and domestic content compliance, electrical safety inspection, local NOCs, and company, GST, and Udyam registrations.
How do I get a feasibility study or DPR for the solar power manufacturing project?
A detailed feasibility study and DPR covers market and buyers, resource assessment, technology, layout, connectivity, approvals, and full financials. Investors usually engage a Solar Power Plant Feasibility Study Consultant with experience in renewable energy projects to prepare the report and validate it for lenders.
Our Clients










Contact Us
Have a question or need assistance?
Please complete the form with your inquiry or reach out to us at
Phone Number
+91-120-433-0800+1-201-971-6302
+44-113-547-7077
Previous Post

Distribution transformers step down medium-voltage power, typically 11, 22, or 33 kV, to the 415 or 230 volts used by homes, shops, farms, and factories. They are the last link in the power supply chain and are installed in very large numbers on poles, plinths, and in substations across every town and village.
Flexible solar panels are lightweight, frameless modules that can bend to fit curved or weak surfaces where standard glass-and-aluminium panels are too heavy or rigid.
The low voltage cable market sits exactly where electrification stops being a policy target and becomes physical infrastructure. Every new solar rooftop, data centre hall, charging depot, factory line and connected building relies on low voltage cable to move power from a transformer to the load, which is why demand keeps compounding even when headline generation projects pause.
Recycled, or secondary, aluminium is made by melting aluminium scrap and refining it into alloy ingots, billets, and liquid metal, using about 95% less energy than making primary aluminium from bauxite.
The Australia Power Industry is the physical foundation of one of the developed world's most coal-reliant electricity systems, which is precisely why its transition now ranks among the largest infrastructure investment programmes in the country's history.
Every solar panel is connected by cables built to survive 25 years or more of sun, heat, rain, and high DC voltage. India added a record 44.6 GW of solar capacity in 2025-26, taking cumulative solar capacity past 150 GW, and rooftop programmes such as PM Surya Ghar are adding millions of smaller systems.
Biomass briquettes, often called white coal, are dense blocks of compressed agricultural and forestry residues that burn cleanly in industrial boilers, furnaces, and power plants.
Lead-acid batteries start every car, truck, and two-wheeler, back up telecom towers, data centres, and homes through inverters and UPS systems, and store energy for solar installations. Almost all of the lead, plastic, and acid in a used battery can be recovered, and India already meets more than 80% of its lead demand from recycling.
Fuel cells turn hydrogen into electricity with water as the only exhaust, which makes them one of the most important technologies in India's clean energy transition. They power hydrogen buses, trucks, and trains, provide backup power for telecom towers and data centres, and supply off-grid and distributed electricity where diesel generators are used today.
India's cities generate well over a lakh tonnes of municipal solid waste every day, and much of it still ends up in overflowing dumpsites that release methane, catch fire, and pollute land and water.
Every solar power system needs an inverter to convert the direct current produced by solar panels into alternating current that homes, businesses, and the grid can use.
Sodium-ion batteries are emerging as a practical complement to lithium-ion technology. They work on the same principle, shuttling ions between a cathode and an anode, but use sodium, which is abundant, inexpensive, and available within India, in place of lithium.
Few industries in India have scaled as quickly as solar manufacturing. Backed by ambitious renewable energy targets, a rooftop programme for households, import duties on foreign modules, and the Approved List of Models and Manufacturers (ALMM), domestic module capacity has multiplied in just a few years.
Setting up an Electrical Panel Manufacturing Plant in India is a fabrication-and-assembly venture powered by heavy grid modernisation, a fast-growing renewable-energy build-out, rising industrial and commercial construction, and the spread of automation across factories and buildings.
Saudi Arabia has turned its power transition into one of the world's largest procurement programmes, and international developers, lenders, and equipment makers are following the tenders.
Setting up a Battery Manufacturing Plant in India is a high-demand, energy-driven venture, powered by the country's booming automotive sector, huge power-backup market, and the fast-growing shift to electric vehicles and renewable storage.
Setting up a Liquefied Natural Gas (LNG) Manufacturing Plant in India is a capital-intensive, strategically important venture, powered by the country's push toward a gas-based economy, the shift to cleaner fuels in transport and industry, and rising demand for LNG as a truck, bus, and industrial fuel.
The India carbon credit market is moving from a voluntary, project-by-project trade into a regulated national system with binding targets, a central registry, and exchange-based price discovery. According to IMARC Group, the market was valued at USD 33.69 Billion in 2025, grew to USD 44.42 Billion in 2026, and is projected to reach USD 405.47 Billion by 2034, expanding at a CAGR of 31.84% (2026–2034).
Setting up a Syngas Production Plant in India is a capital-intensive but strategically valuable venture, driven by the country's push for cleaner industrial fuels, coal and biomass utilization, and chemical self-reliance. Syngas, or synthesis gas, is a mixture of hydrogen and carbon monoxide produced by gasifying carbon-rich feedstocks, and it serves as a versatile building block for power, chemicals, hydrogen, and synthetic fuels. With abundant biomass, coal, and waste feedstock and growing policy support for gasification, India offers a favourable environment for new plants.
Setting up a Battery Energy Storage System Manufacturing Plant in India is a capital-efficient, high-growth venture, driven by the country's renewable energy expansion, grid modernization, and supportive storage policies. As solar and wind capacity scales up and the grid needs to balance variable generation, battery energy storage systems have become essential infrastructure.
Setting up a Lithium-ion Battery Recycling Plant in India is a capital-intensive but high-potential venture. India's rapid rise as a major electric-vehicle market, its large consumer-electronics base, and its fast-growing energy-storage sector are together creating one of the deepest and fastest-expanding pools of end-of-life lithium-ion batteries in the world.
Solar glass is a type of specialty glass that has high transmittance and is designed exclusively for use in solar energy systems. Unlike regular flat glass, solar glass is designed to have maximum light transmission with minimal losses due to reflection and absorption.
A solar inverter is a vital component in solar photovoltaic (PV) systems, responsible for transforming the direct current (DC) electricity produced by solar panels into alternating current (AC) electricity. This AC power is then suitable for use by the electrical grid, various appliances, and industrial equipment.
Australia has firmly established itself as a dominant force in the global liquefied natural gas (LNG) market, maintaining its position as one of the world's leading exporters. The country's strategic geographical location in the Asia-Pacific region, combined with substantial natural gas reserves, has enabled it to become a critical energy supplier to rapidly growing Asian economies, particularly China, Japan, and South Korea.
Japan's lead acid battery market stands as a cornerstone of the nation's energy storage infrastructure, demonstrating remarkable resilience and adaptability in an era dominated by rapid technological evolution. Despite the global shift toward lithium-ion technologies, the Japanese lead acid battery sector continues to thrive, driven by its unmatched cost-effectiveness, proven reliability, and exceptional recyclability.
Green hydrogen is the cleanest form of hydrogen available, as it is produced through water electrolysis using the electricity generated from renewable energy sources such as solar, wind, or hydropower. Carbon dioxide emissions are zero since no fossil fuels are used. Essentially, an electrolyzer is used in the electrolysis process to split water molecules into hydrogen and oxygen. The resulting hydrogen is refined by purification, compression, or liquefaction and then fed into various applications. Green hydrogen is considered a cornerstone of the global energy transition because it can store renewable energy, decarbonize hard-to-abate sectors, and serve as a sustainable alternative to fossil-fuel-based hydrogen.
Japan’s thermal power plant industry remains a crucial pillar of the nation’s energy infrastructure, providing a stable and reliable source of electricity for both industrial and residential consumption. Thermal power generation, which primarily involves the combustion of fossil fuels such as coal, natural gas, and oil, continues to play a key role despite increasing investments in renewable energy.
An electrical panel, also called a distribution board or switchboard, is an important installation in electrical infrastructure that acts as the main center for the distribution, control, and protection of electrical power within residential, commercial, and industrial systems. It acts as the point at which electrical energy is received from the utility or a source of power generation and is distributed to various circuits and equipment in an organized manner.
The global oil and gas EPC market is currently experiencing a remarkable transformation as it positions itself at the intersection of traditional energy demands and technological innovation. As of 2024, the market is demonstrating robust growth, reaching USD 52.9 Billion in 2024, depending on regional scope and market segmentation approaches. This substantial market base is supporting a major number of capital projects worldwide, including offshore platform projects and onshore installations that are collectively shaping the energy landscape.
Bamboo pellets are a biomass fuel type created through the compression of bamboo residues like shavings, sawdust, and chips into thick cylindrical pellets. They are an environmentally friendly substitute for conventional fossil fuels like natural gas and coal. Due to the fast growth rate and high biomass yield of bamboo, it has become one of the most renewable raw materials for the production of bioenergy.
Biomass briquettes are dense, solid fuel blocks made of compressed organic waste materials like sawdust, agricultural wastes, wood shavings, coconut shells, rice husk, or herbaceous biomass. The briquetting process usually involves drying the biomass to lower the moisture content (usually down to 10-15%), grinding or milling for a fine particle size uniformity, and then compressing under high pressure with or without a binding agent.
Biogas is a renewable energy form generated by the anaerobic fermentation of organic matter including agricultural residues, animal waste, municipal solid waste, sewage sludge, and food waste. Microorganisms in the absence of oxygen break down organic substances in the process and produce a gaseous mixture of mainly methane (CH4) and carbon dioxide (CO2), with traces of hydrogen sulfide (H2S) and water vapor.
A battery is an electrochemical energy storage system that transforms chemical energy into electrical energy by way of redox reactions between its electrodes and electrolyte. It consists of a single or multiple electrochemical cells, each having a positive electrode (cathode), a negative electrode (anode), and an electrolyte for ion transfer. Batteries are categorically divided into primary (non-rechargeable) and secondary (rechargeable) types.
The global energy landscape is undergoing a seismic transformation, with green hydrogen emerging as one of the most promising solutions to achieve deep decarbonization across sectors. Far from a niche technology, green hydrogen is emerging as a critical pillar of the future energy system, offering a pathway to a sustainable and resilient economy.
Transmission line towers are essential support components of transmission lines installed on overhead to distribute high-voltage electricity over long distances. Towers are made of galvanized steel, primarily, and are designed to tolerate mechanical stress, environmental loads, and electrical safety. Some of the important characteristics of transmission line towers are high structural strength, corrosion resistance, adaptability for modular design, and high service life. They are normally produced in lattice form (tubular or free-standing towers) or tubular form, with types including suspension towers, tension towers, angle towers, and terminal towers based on use.
The energy storage revolution is here, and it's powered by graphene. While the world struggles with the limitations of conventional lithium-ion batteries, a new technology is emerging that promises to shatter every performance barrier we've accepted as unchangeable.
Australia is undergoing a significant energy transformation, underscoring the growing role of renewable energy sources. These sources are key to combating climate change by reducing greenhouse gas emissions, the primary cause of global warming and air pollution. Beyond environmental benefits, renewable energy strengthens energy security by diversifying power sources and reducing dependence on volatile fossil fuel imports, contributing to greater energy independence.
Learn how to plan capital investment, manage raw material costs, post manufacturing cost and optimize operations for setting up solar panel plant.
Battery Energy Storage System (BESS) represents a power grid technology that stores electricity to enhance electric power grid reliability while increasing operational efficiency. BESS permits battery recharging during periods of low demand or extra grid supply capacity. BESS provides three principal operational functionalities which include power grid stabilization during supply disruptions, control of energy supply variations, and integration of intermittent renewable generation from wind and solar resources.
China's economic presence is expanding globally, and Latin America and the Caribbean (LAC) have become a focal point for its investments, especially within the energy sector. The region, rich in natural resources and experiencing rising energy demands, offers strategic opportunities for Chinese energy giants looking to invest and expand. LAC is currently leading a transformative movement towards sustainable energy. From 2015 to 2022, the region increased its renewable energy capacity by an impressive 51%, now generating 64% of its electricity from renewables such as hydropower, wind, and solar. This shift addresses the global demand for cleaner energy while supporting local economic growth and enhancing energy security.
Hydrogen is a clean, renewable, and widely available energy source that can be produced through various methods. Production techniques such as coal gasification, steam methane reforming, electrolysis, and thermochemical processes highlight its versatility. Hydrogen is essential in several critical sectors, including methanol and ammonia production, petroleum refining, transportation, power generation, as well as in electronics, metal industries, and as a rocket propellant. The increasing concern over carbon emissions and greenhouse gases has led to a shift towards cleaner fuel options. Hydrogen is recognized for its cleanliness and versatility as an energy carrier. Additionally, supportive government initiatives and favorable policies are driving the growth of hydrogen production globally.
Hydrogen is a clean, renewable, and abundant energy source derived from various methods. Its applications span across transportation, heating, and power generation. Diverse production methods, including coal gasification, steam methane reforming, electrolysis, and thermochemical processes, contribute to its versatility. Hydrogen plays a pivotal role in crucial sectors like methanol and ammonia production, petroleum refining, transportation, power generation, as well as in electronics, metal industries, and as a rocket propellant.
A floating solar farm is a renewable energy installation in which solar panels are mounted on floating structures in water bodies such as lakes, reservoirs, ponds, or even the sea. This technology, also known as a floating photovoltaic (PV) system, or “floatovoltaics,” enables solar power generation in areas with limited available land or where land use is restricted for other purposes. Floating solar farms offer various benefits, including improved solar panel efficiency through cooling, land conservation, reduction of evaporation and algae growth, and integration with hydropower facilities to generate both solar and hydroelectric power in the same location.
Nuclear power utilizes nuclear reactions to generate heat, which is then converted into electricity. This energy is released from the nucleus—the core of atoms composed of protons and neutrons. Nuclear power can be derived from nuclear fission, nuclear decay, and nuclear fusion reactions. Across the globe, nuclear power plants predominantly use the fission of uranium and plutonium to produce electricity. The heat generated from fission is used to create steam, which drives turbines connected to generators. Nuclear power offers several advantages over fossil fuels, such as minimal greenhouse gas emissions and a higher energy density, meaning a small amount of nuclear fuel produces a large amount of energy.