Electric Bike Plant Setup Cost in India: Manufacturing Process Flow, Machinery, DPR & Financial Model 2026
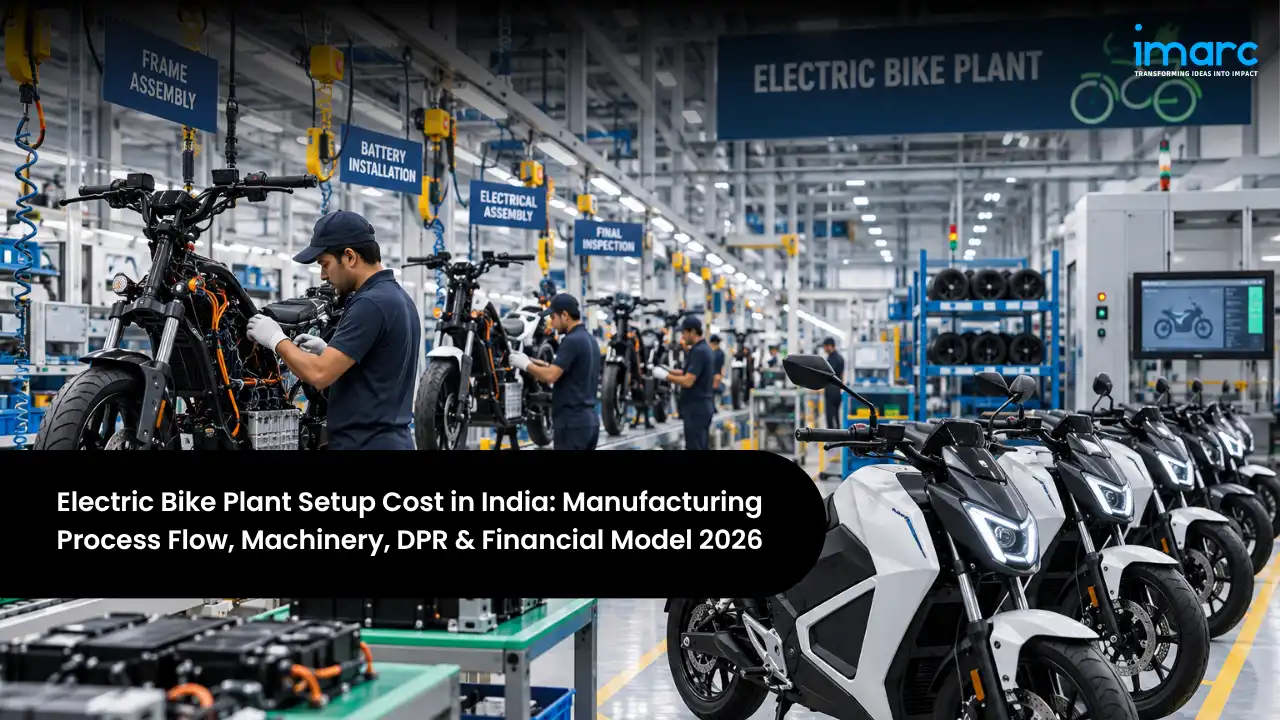
Electric bicycles, or e-bikes, combine a conventional bicycle with a small electric motor, a lithium-ion battery, and a controller that assists the rider's pedalling. In India, models limited to 250 watts and 25 km/h do not need registration or a driving license, cost a few paise per kilometre to run, and suit short commutes, fitness riding, students, and last-mile delivery. India's e-bike market reached about USD 1.42 billion in 2025 and is growing steadily, while organised brands are scaling up quickly and exporters are finding demand in Europe and other markets. With a deep bicycle supply base in Ludhiana, rising urban congestion, and fast-growing delivery fleets, Electric Bike Manufacturing Plant Setup in India is an appealing opportunity in light electric mobility.
Investment depends above all on scale and on how much of the e-bike the plant makes itself. A unit assembling e-bikes from bought-in frames, motors, and battery packs is a modest project, while a plant that welds and paints its own frames, builds battery packs, and later makes motors, displays, and chargers is a much larger undertaking. The Electric Bike Manufacturing Plant Cost ranges from about INR 3–8 crore for an assembly unit of 10,000 to 30,000 e-bikes a year to INR 30–80 crore for a plant of 1 to 2 lakh units a year with in-house frames and battery packs, and INR 150–300 crore for a large integrated plant of 5 lakh units or more. Components make up 70 to 80% of operating cost, with the battery and motor the largest items, so sourcing, localisation, and design shape profitability. A well-run plant typically earns a gross margin of 25 to 35% and a net margin of 10 to 20%.
This guide is written for investors exploring how to start an Electric Bike manufacturing plant in India. It focuses on a mid-sized plant making pedal-assist city, mountain, and cargo e-bikes with in-house frame fabrication, painting, and battery pack assembly; it does not cover registered electric motorcycles or scooters. It covers products and markets, the demand outlook, the production process flow, machinery and components, location and infrastructure, a detailed cost and financial breakdown, approvals, and how a DPR and financial model turn all of this into a bankable plan.
India Market Snapshot
| Key Facts | Details |
|---|---|
| Global E-Bike Market (2025) | USD 28.10 Billion |
| Projected Global Market (2034) | USD 48.60 Billion, 6.1% CAGR |
| India E-Bike Market (2025) | USD 1,420.78 Million |
| Projected India Market (2034) | USD 3,007.19 Million, 8.69% CAGR |
| Pedal-Assisted Share in India (2025) | 82% of e-bike demand |
| Indicative Total Investment | INR 3 Crore to 300 Crore |
The snapshot shows a large global market and an Indian market growing faster, led by pedal-assisted city models with lithium-ion batteries. The organised segment is consolidating around a handful of brands selling tens of thousands of units a month, while delivery fleets, rental operators, and exports are opening new channels. The wide investment range reflects a real choice between a focused assembler, a mid-sized manufacturer with its own frames and packs, and a large integrated producer. The sections below work through that choice.
Investment Highlights
Indicative Project Cost in India (2026)
| Parameter | Value |
|---|---|
| Product Range | City, mountain, cargo, folding, and fleet e-bikes |
| Plant Capacity | 1,00,000 – 5,00,000 units per year |
| Total Project Investment | INR 3 Crore (assembly) to 150–300 Crore (integrated plant) |
| Payback Period | 3 – 5 Years |
| Net Profit Margin | 10 – 20% |
| IRR | 18 – 25% |
| Preferred States | Punjab, Maharashtra, Tamil Nadu, Karnataka, Haryana, Gujarat |
| Key Requirement | Battery and motor supply, brand building, and sales channels |
These ranges provide a realistic frame for early planning, but actual returns depend on battery and motor costs, product design and quality, the mix of online, dealer, fleet, and export sales, marketing spend, and after-sales service. A site-specific Electric Bike Feasibility Report narrows each of these assumptions to your chosen products, capacity, integration depth, location, and channels.
Table of Contents
- What is Electric Bike Manufacturing?
- Why is Electric Bike Manufacturing Growing in India?
- Electric Bike Manufacturing Process Flow
- Raw Materials Required for Electric Bike Manufacturing
- Location, Land & Infrastructure
- Electric Bike Manufacturing Machinery and Equipment
- Electric Bike Manufacturing Plant Setup Cost in India (CapEx & OpEx)
- Financial Analysis and Profitability
- Licenses and Approvals for Electric Bike Manufacturing in India
- Recent Developments in the India Electric Bike Manufacturing Industry
- How an Electric Bike Manufacturing Project Report and DPR Helps Investors
- Frequently Asked Questions
What is Electric Bike Manufacturing?
An e-bike is a bicycle fitted with an electric drive system: a lithium-ion battery pack, a hub or mid-drive motor, a controller, a pedal-assist or torque sensor, and usually a display and throttle. When the rider pedals, the sensor signals the controller to add motor power, making hills, headwinds, and longer distances easy without the rider arriving tired. In India, e-bikes with motors of up to 250 watts and a top assisted speed of 25 km/h are treated as low-speed vehicles that need no registration, number plate, or license, which keeps them simple and affordable for buyers.
Commercially, e-bikes serve personal, commercial, and export buyers. An Electric Bike Manufacturing Plant can supply urban commuters, students, fitness and leisure riders, delivery and quick-commerce fleets, rental and shared mobility operators, corporate campuses and townships, tourism operators, and export markets in Europe, the Middle East, and elsewhere. Buyers weigh price, range, ride quality, reliability, battery safety, and service support.
- Personal Commuting: Affordable city e-bikes for short daily trips, students, and office commuters.
- Delivery & Fleets: Cargo e-bikes for food, grocery, and parcel deliveries.
- Fitness & Leisure: Mountain, fat-tyre, and hybrid e-bikes for recreation and tourism.
- Exports: Certified e-bikes and components for overseas brands and markets.
The Main E-Bike Types and Segments
Choosing the product range is the most important commercial decision, because it determines frames, components, capital cost, and customers:
| E-Bike Type | Description | Key Property | Primary Demand |
|---|---|---|---|
| City & Commuter E-Bikes | 250 W hub motor, step-through frames | Affordable, easy to ride | Commuters and students |
| Mountain & Fat-Tyre E-Bikes | Suspension and wider tyres | Rough terrain and fitness | Enthusiasts and tourism |
| Cargo & Delivery E-Bikes | Reinforced frames and carriers | High payload, durability | Delivery fleets |
| Folding E-Bikes | Compact foldable frames | Portable and space-saving | Metro and apartment users |
| Fleet & Rental E-Bikes | Rugged, IoT-enabled models | Tracking and low upkeep | Rental and campus operators |
| Conversion Kits & Components | Motors, packs, and controllers | Retrofit and supply | Aftermarket and other brands |
These choices shape the whole plant. City e-bikes are the largest and most price-sensitive segment, while mountain, cargo, and folding models earn higher margins and attract more loyal buyers. Assembling battery packs in-house improves cost and safety control, and in-house motors and displays add value at scale. Most new entrants therefore begin with a focused range of city and cargo e-bikes, build their own packs, sell through a mix of online and dealer channels, and add premium and export models as the brand grows.
Why is Electric Bike Manufacturing Growing in India?
Key Growth Drivers in the Indian Market
Demand is supported by low running costs, urban congestion, delivery growth, health awareness, and favourable regulation:
- Very low running costs: An e-bike costs only a few paise per kilometre to charge, far below petrol two-wheelers or public transport for short trips.
- No registration or license: Low-speed e-bikes avoid registration, insurance requirements for motor vehicles, and licenses, making them accessible to students and new riders.
- Delivery and quick commerce: Fleets are adopting cargo e-bikes for dense urban deliveries at lower cost than motorised two-wheelers.
- Health and lifestyle: Rising interest in fitness, cycling, and outdoor recreation supports premium mountain and hybrid e-bikes.
- Policy and tax support: Electric vehicles attract 5% GST, and state EV policies and city cycling initiatives support adoption.
India-Specific Market Opportunity
| Segment | India Market Context | Manufacturing Role |
|---|---|---|
| Urban Commuters & Students | Congested cities, short trips | Affordable city e-bikes |
| Delivery & Quick Commerce | Rapid fleet growth | Cargo and fleet models |
| Fitness & Leisure Riders | Growing cycling culture | Mountain and hybrid e-bikes |
| Rental & Campuses | Townships, campuses, tourism | Rugged connected e-bikes |
The strongest opportunity for new entrants lies in segments where focused products and service can win, such as cargo and fleet e-bikes, value city models for smaller towns, premium leisure bikes, and exports to buyers looking for alternatives to Chinese supply. Makers that keep battery costs and quality under control, offer reliable service, and build strong online and dealer channels will be best placed as e-bikes move into the mainstream.
Electric Bike Manufacturing Process Flow
Understanding the process helps you plan equipment, layout, and where cost and quality are decided. Production runs from incoming inspection through frame fabrication, heat treatment, painting, battery pack assembly, wheel building, main assembly, electrical integration, and testing to packing and dispatch. Safe battery packs, correct electrical integration, and thorough testing determine reliability, while component cost and assembly productivity are the largest controllable costs.
The Electric Bike Manufacturing Process Flow
The sequence below reflects a mid-sized plant with in-house frame fabrication, painting, and battery pack assembly. An assembly-only plant buys painted frames and finished packs and begins at wheel building and main assembly.
| Unit Operation | Key Activity |
|---|---|
| Incoming Inspection | Cells, motors, frames, and parts checked |
| Frame Fabrication | Tubes cut, mitred, and welded in jigs |
| Heat Treatment & Alignment | Aluminium frames treated, frames aligned |
| Painting & Decals | Pre-treatment, powder coating, and graphics |
| Battery Pack Assembly | Cells sorted, welded, BMS fitted, packs tested |
| Wheel Building | Hub motors and rims laced and trued |
| Main Assembly | Fork, drivetrain, brakes, and wheels fitted |
| Electrical Integration | Controller, sensor, display, and harness connected |
| Testing | Speed limit, brake, electrical, and ride checks |
| Packing & Dispatch | Part-assembled e-bikes boxed and shipped |
Two factors decide profitability across this flow. The first is battery quality and cost careful cell grading, consistent welding, a well-matched battery management system, and pack testing prevent fires and warranty claims, while good cell sourcing keeps packs competitive. The second is assembly productivity, because balanced lines, good jigs and fixtures, and efficient testing raise output per worker and reduce returns.
Raw Materials Required for Electric Bike Manufacturing
The main inputs are lithium-ion cells or battery packs, battery management systems, hub or mid-drive motors, controllers, pedal-assist or torque sensors, displays, chargers, and wiring harnesses, together with aluminium or steel frame tubes, forks, drivetrain parts, brakes, wheels and tyres, saddles, and accessories. Because cells and many electronic parts are imported and components make up most of the cost, secure supply and steady localisation are central to project planning.
| Component / Material | Role in E-Bike | India Sourcing | % of OpEx |
|---|---|---|---|
| Lithium-Ion Cells & Battery Packs | Store energy, set range | Imported cells, local pack makers | 25–32% |
| Hub Motors & Controllers | Drive and control assistance | Largely imported, some local | 12–16% |
| Frames, Forks & Tubes | Structure and suspension | Ludhiana suppliers and imports | 8–11% |
| Drivetrain, Brakes, Wheels & Tyres | Pedalling, stopping, and ride | Largely domestic | 10–13% |
| Displays, Sensors, Chargers & Harness | Control and charging | Domestic and imported | 5–7% |
India has one of the world's largest bicycle industries, centred on Ludhiana, which supplies frames, rims, spokes, chains, saddles, and many other parts. Cells, motors, and controllers are still mostly imported, though domestic battery pack makers and motor suppliers are growing. Qualifying more than one cell and motor supplier, using standardised platforms across models, and localising packs, displays, and chargers step by step help manage cost and supply risk.
Location, Land & Infrastructure
Site selection for an e-bike plant is shaped by proximity to bicycle and electronics supplier clusters, availability of skilled assemblers and technicians, road and port connectivity for imported cells and exports, distance to major urban markets, reliable power, and state EV and industrial incentives.
Choosing the Best Location for Electric Bike Manufacturing Plant Setup
| State / Region | Why It Works | Key Advantage |
|---|---|---|
| Punjab (Ludhiana) | India's bicycle manufacturing capital | Frames, parts, and skilled labour |
| Maharashtra (Pune) | Leading e-bike and EV cluster | Suppliers, talent, and ports |
| Tamil Nadu (Chennai, Hosur) | Bicycle and EV ecosystems | Suppliers and export ports |
| Karnataka (Bengaluru) | Electronics and design hub | Engineering talent and D2C brands |
| Haryana & Delhi NCR | Large northern market | Market access and suppliers |
| Gujarat | Strong industrial and EV policy | Land, ports, and incentives |
Punjab's Ludhiana cluster offers unmatched access to bicycle parts and experienced labour, while Pune combines a strong e-bike ecosystem with port access. Tamil Nadu brings bicycle and EV suppliers and export ports, Karnataka adds electronics and design talent, Haryana serves large northern markets, and Gujarat offers land, ports, and incentives. The final choice should weigh supplier proximity, talent, logistics to markets and ports, power, and incentives.
Quality, Safety and Environmental Systems
E-bikes sold as low-speed vehicles must stay within the 250 W and 25 km/h limits, typically confirmed through certification by a testing agency such as ARAI or ICAT, while lithium-ion cells must meet BIS registration requirements and export models usually need EN 15194 compliance. A credible plant needs ISO 9001 quality systems, cell and pack testing, frame fatigue and brake testing, speed-limit verification, and traceability from cells to finished e-bikes. Lithium-ion batteries create fire risk, so cell storage, pack assembly, and charging areas need fire separation, thermal monitoring, and suppression, along with emission control in the paint shop. An experienced Electric Bike Manufacturing Consultant in India can help plan product design, sourcing, battery safety, certification, and quality systems so the plant meets regulatory and customer expectations from the start.
Infrastructure Requirements (Mid-Sized Electric Bike Plant)
| Infrastructure Element | Specification | India-Specific Note |
|---|---|---|
| Total Land Area | 3 – 10 acres | Depends on capacity and integration |
| Assembly Building | Assembly lines and sub-assembly areas | Room for added lines |
| Battery Pack Shop | Controlled area with fire separation | Thermal monitoring and suppression |
| Frame & Paint Shop | Welding, heat treatment, powder coating | Fume and emission control |
| Testing Area | Brake, speed, and ride testing | Short test track |
| Power Supply | HT connection, 0.5 – 2 MW | Paint ovens and pack testing |
| Warehouse & Dispatch | Component stores and boxed e-bikes | Space for e-commerce dispatch |
A safe battery pack shop and a well-planned assembly building are the most important infrastructure requirements, since pack quality governs safety and assembly flow governs productivity. The plant also needs frame and paint facilities with proper emission control, a testing area, reliable power, and generous warehousing, because component inventory and boxed e-bikes for online and dealer orders take up significant space.
Electric Bike Manufacturing Machinery and Equipment
The equipment set covers frame fabrication, heat treatment, painting, battery pack assembly, wheel building, assembly, testing, and material handling. Battery pack lines, welding and paint facilities, assembly conveyors, and test equipment account for most of the machinery budget. The main items are summarised below.
| Equipment | Function | Key Specification |
|---|---|---|
| Tube Cutting & Mitring Machines | Prepare frame tubes | Accurate lengths and angles |
| Frame Welding Jigs & TIG Welders | Weld frames | Fixtures for each frame size |
| Heat Treatment Furnace | Treat aluminium frames | Controlled solution and ageing cycles |
| Pre-treatment & Powder Coating Line | Paint frames and forks | Booths and curing ovens |
| Cell Sorting Machines | Grade cells for packs | Voltage and resistance sorting |
| Spot or Laser Welders | Join cells and nickel strips | Consistent, low-resistance joints |
| Battery Pack Testers | Test packs and BMS | Charge, discharge, and insulation tests |
| Wheel Lacing & Truing Machines | Build wheels and motor wheels | Automatic tensioning and truing |
| Assembly Conveyor & Tooling | Assemble e-bikes | Stations with torque tools |
| Test Rigs & Speed Testers | Verify finished e-bikes | Brake, speed limit, and electrical checks |
| Packing & Material Handling | Box and move products | Packing tables, racks, forklifts |
Machinery should follow the product, capacity, and integration plan. An assembly-only plant needs mainly conveyors, tooling, wheel building, and test equipment, while in-house frames, painting, and battery packs require more investment but give better control of cost and quality. Automated cell sorting and welding, torque-controlled tools, and end-of-line testing improve safety and consistency, and flexible lines that can build several models help a growing brand respond to demand.
Electric Bike Manufacturing Plant Setup Cost in India (CapEx & OpEx)
The tables below break down capital and operating costs for a mid-sized e-bike plant in India. The final Electric Bike Investment Cost for your project will depend on capacity, product range, the depth of integration in frames, batteries, and electronics, the level of automation, R&D and certification spending, and location.
Capital Expenditure (CapEx) Cost Structure
| CapEx Component | % of Total CapEx | What It Covers |
|---|---|---|
| Plant & Machinery | 35–45% | Frame, paint, pack, assembly, and test lines |
| Civil Works & Buildings | 15–20% | Assembly hall, pack shop, paint shop, stores |
| Tooling, Jigs & Fixtures | 6–10% | Frame jigs and assembly tooling |
| R&D, Testing & Certification | 5–8% | Prototypes, validation, and certifications |
| Land & Site Development | 5–8% | Land, roads, and test area |
| Pre-operative & Contingency | 4–6% | Engineering, DPR, commissioning, buffer |
| Working Capital | 10–15% | Component stocks, finished goods, receivables |
Machinery and buildings dominate the capital budget, while product development and certification are significant items that new entrants often underestimate. Working capital is substantial, because imported cells and motors need lead time and dealers, e-commerce channels, and fleet buyers expect stock and credit. Because sales depend on brand building, a detailed Electric Bike Business Plan should model sales ramp-up by channel, battery and motor prices, marketing spend, dealer and platform margins, and warranty costs together, so that funding carries the business to scale.
Operating Expenditure (OpEx) Cost Structure
| OpEx Component | % of Total OpEx | India-Specific Note |
|---|---|---|
| Components & Raw Materials | 70–80% | Battery and motor are the largest items |
| Utilities (power, water) | 5–10% | Paint ovens and pack testing |
| Labour | 5–8% | Assemblers, welders, and technicians |
| Marketing & Channel Costs | 4–6% | Online, dealer, and fleet sales |
| Warranty & After-Sales | 2–3% | Battery and electronics claims |
| Logistics & Overheads | 2–4% | Dispatch, administration, and R&D |
With components making up most of the cost, margins depend on battery and motor prices, localisation, design efficiency, and pricing power. A good operating model tracks bill of materials per e-bike, battery cost per watt-hour, labour minutes per unit, first-pass yield, return and warranty rates, and channel margins, and tests how profitability responds when cell prices move or competitors cut prices.
Financial Analysis and Profitability
Based on analysis of a mid-sized e-bike plant, the financial profile is attractive, supported by steady market growth and moderate capital needs, but margins depend on brand strength, component costs, and channel mix. The profitability of Electric Bike manufacturing business in India improves markedly with competitive cell and motor sourcing, in-house battery packs, a focused product range, efficient online and dealer channels, and fleet and export orders.
| Financial Metric | Indicative Value | India Context |
|---|---|---|
| Gross Profit Margin | 25–35% | Higher for premium and cargo models |
| Net Profit Margin | 10–20% | After depreciation and Indian corporate taxes |
| Payback Period | 3–5 Years | Faster with fleet and export orders |
| IRR (Internal Rate of Return) | 18–25% | Higher with localisation and scale |
| Capacity Utilization (stable ops) | 60–85% | Depends on brand and channels |
| Break-even Capacity Utilization | 40–50% | Moderate fixed costs |
Brand, product mix, and cost position decide where a plant lands within these ranges. Makers with strong brands, reliable products, and efficient sourcing earn healthy margins, while those competing only on price against imports struggle. Cargo, premium, and export models lift margins, and fleet contracts provide steady volume beyond seasonal retail demand.
Returns can be strengthened by localising packs, frames, displays, and chargers, standardising platforms across models, building a mix of online, dealer, fleet, and export sales, offering financing and battery warranties, and adding connected features that support fleet and rental customers. Reliability and responsive service are what build word of mouth in a market where many buyers are trying e-bikes for the first time.
Key Risks and Mitigation
The main risks are price competition from imports and other brands, battery safety incidents, cell and motor supply disruptions, seasonal demand, high marketing costs, and changes in regulation. Competition risk is reduced through focused segments and quality; safety risk by rigorous pack design and testing; supply risk by multiple suppliers and localisation; seasonality by fleet and export sales; and regulatory risk by designing within low-speed limits and tracking rule changes. Promoters often work with an Electric Bike Business Plan Consultant in India to test these scenarios before committing capital.
Licenses and Approvals for Electric Bike Manufacturing in India
Approvals for an e-bike plant combine product and battery compliance with industrial, environmental, and safety permits. Promoters setting up an Electric Bike Manufacturing Plant in India generally need the following:
- Low-Speed Vehicle Certification: Certification from a testing agency such as ARAI or ICAT that models meet the 250 W and 25 km/h limits for exemption from registration.
- Battery & Product Compliance: BIS registration for lithium-ion cells under compulsory registration, relevant BIS bicycle standards, and EN 15194 for export models.
- Battery Waste Compliance: Registration and extended producer responsibility under the Battery Waste Management Rules.
- Pollution Control Consents: Consent to Establish and Consent to Operate from the State Pollution Control Board, especially for welding and paint shop emissions.
- Factory & Fire Approvals: Factory license under the Occupational Safety, Health and Working Conditions Code, 2020, building approval, and Fire NOC with battery-specific fire safety measures.
- Power & Water Approvals: Industrial power connection and water supply permissions.
- Business & Trade Registrations: Company incorporation, GST, Udyam where applicable, IEC for imports and exports, and EPF and ESI registrations.
Product certification and battery compliance are usually on the critical path, since each model needs testing before launch, while pollution consents and fire approvals are needed before production. Planning product development, certification, and plant approvals in parallel shortens the time from investment decision to commercial launch.
Note: The exact approvals, registrations, licenses, and certification requirements may vary depending on factors such as plant location, capacity, product specifications, battery sourcing, export markets, and applicable regulations. Businesses are advised to undertake a detailed regulatory assessment during the project planning stage to ensure full compliance and timely implementation.
Recent Developments in the India Electric Bike Manufacturing Industry
Several recent developments give useful context for investors considering this market:
- Market leaders scale up: Hero Lectro holds an estimated 30–35% share of the organised e-cycle market, and leading brands together sell an estimated 25,000–32,000 units a month.
- Large integrated capacity: EMotorad is building an e-cycle gigafactory in Pune with capacity for 5 lakh e-bikes a year and in-house batteries, motors, displays, and chargers.
- New entrants: In July 2025, TVS Motor announced plans to launch made-in-India electric bicycles in FY2026.
- Connected products: In December 2025, EMotorad launched the T-Rex Smart, described as India's first connected e-cycle with built-in Bluetooth and GPS.
The common thread is a market attracting large manufacturers, investing in integrated capacity, and moving towards smarter products. New entrants who control component costs, build reliable products, and focus on segments and channels where they can win will be best placed as e-bikes become a mainstream mobility choice in India.
How an Electric Bike Manufacturing Project Report and DPR Helps Investors
A detailed DPR provides a structured roadmap for the venture, from market demand and product strategy to plant design, machinery, component sourcing, certification, approvals, and economics. It helps investors decide the right product range, capacity, and integration depth, estimate capital and operating expenditure, assess profitability, and identify risks before committing funds.
At its core is a detailed Electric Bike Financial Model covering revenue by model and channel, bill of materials per e-bike, battery and motor costs, labour and overheads, marketing and channel margins, warranty, working capital, debt servicing, cash flows, break-even, return on investment, and payback under different volume and pricing scenarios. Banks and investors rely on this model to judge long-term viability, which is why many promoters appoint an Electric Bike Plant Project Report Consultant in India to prepare the report and validate its assumptions against current market data.
For an e-bike project, a strong DPR also clarifies the battery and motor sourcing plan, the localisation roadmap, the certification timeline, and the sales and service strategy, which together are the factors most likely to decide success. By testing margins against price competition, component cost swings, and slower sales, the report turns a fast-growing opportunity into a plan that lenders and partners can trust.
Frequently Asked Questions
What are the first steps to set up an electric bike manufacturing plant in India?
Start by choosing target segments, product range, capacity, and integration depth, and develop or license the e-bike designs. Then commission a feasibility study and DPR, line up cell, motor, and component suppliers, secure land and power, obtain pollution consents and fire approvals, build the assembly, pack, and paint facilities, install machinery, complete certifications, and set up online, dealer, and service channels before launch.
How much does it cost to set up an electric bike manufacturing plant in India?
Investment ranges from about INR 3–8 crore for an assembly unit of 10,000 to 30,000 e-bikes a year to INR 30–80 crore for a plant of 1 to 2 lakh units a year with in-house frames and battery packs, and INR 150–300 crore for a large integrated plant of 5 lakh units or more.
What are the main steps in electric bike manufacturing?
The flow runs from incoming inspection through frame fabrication, heat treatment and alignment, painting, battery pack assembly, wheel building, main assembly, electrical integration, testing, and packing and dispatch.
Which machinery does an electric bike manufacturing plant need?
Key equipment includes tube cutting and mitring machines, welding jigs and TIG welders, a heat treatment furnace, a powder coating line, cell sorting machines, spot or laser welders, battery pack testers, wheel lacing and truing machines, assembly conveyors and tooling, test rigs, and packing and material handling equipment.
Which components go into an electric bike?
The main components are lithium-ion cells or a battery pack, a battery management system, a hub or mid-drive motor, a controller, a pedal-assist or torque sensor, a display, a charger and harness, and a frame, fork, drivetrain, brakes, wheels, tyres, and saddle.
How profitable is electric bike manufacturing in India?
A well-run plant typically earns a 25 to 35% gross margin and a 10 to 20% net margin, with payback in about 3 to 5 years. Profitability depends on component costs, localisation, brand strength, channel mix, and warranty performance.
Which approvals does an electric bike manufacturing plant need in India?
Typical approvals include low-speed vehicle certification, BIS registration for lithium-ion cells, battery EPR registration, pollution control consents, a factory license, Fire NOC, power and water approvals, and GST, IEC, and labour registrations, plus EN 15194 compliance for exports.
How do I get a feasibility study or DPR for an electric bike manufacturing project?
A detailed feasibility study and DPR covers market demand, product and channel strategy, sourcing and localisation, plant design, certification, approvals, and full financials. Investors usually engage an Electric Bike Manufacturing Feasibility Study Consultant with experience in mobility and EV projects to prepare the report and validate it for lenders.
Our Clients










Contact Us
Have a question or need assistance?
Please complete the form with your inquiry or reach out to us at
Phone Number
+91-120-433-0800+1-201-971-6302
+44-113-547-7077
Previous Post

Walk into a modern Indian car parts plant, pharmaceutical packing line, or electronics factory and you will see robots welding and palletising, conveyors moving parts between stations, vision cameras checking quality, and control panels coordinating it all.
Tyres are essential to every vehicle on India's roads, from two-wheelers and three-wheelers to cars, buses, trucks, tractors, and off-highway machines.
If the battery is the heart of an electric vehicle, the wiring harness is its nervous system. Every EV needs low-voltage harnesses for lights, sensors, and controls, plus high-voltage harnesses that carry hundreds of volts and high currents between the battery, inverter, motor, and charging port, and dedicated harnesses inside the battery pack that monitor every cell.
Every electric vehicle needs a brain between the battery and the motor. The motor controller, often called the traction inverter in larger vehicles, converts DC power from the battery into precisely controlled AC power for the motor, manages acceleration, regenerative braking, and efficiency, and protects the whole powertrain from faults.
Every vehicle on the road depends on forged parts. Crankshafts, connecting rods, steering knuckles, axle beams, gears, and hubs are forged because the process gives steel a continuous grain flow and the strength to survive millions of load cycles.
Setting up an Automotive Components Manufacturing Plant in India is a high-potential, export-capable venture, powered by the country's large automobile industry, deep supplier base, and growing role as a global sourcing hub for auto parts.
The global automotive lead-acid battery market reached USD 13.89 Billion in 2025 and is projected to reach USD 16.60 Billion by 2034, growing at a CAGR of 1.94% (2026–2034).
Setting up an Electric Scooter Manufacturing Plant in India is a capital-efficient, high-growth venture, driven by the country's rapid shift to electric mobility, supportive EV policies, and surging demand for affordable, clean urban transport. As two-wheelers dominate Indian roads and buyers move from petrol to battery-powered scooter manufacturing, an EV Scooter Manufacturing Plant is one of the most accessible and strategically timed entry points into the electric vehicle economy.
Capital is flowing into the united states used car market because structural affordability pressure, digital retail maturity, and a record-old national vehicle fleet have converged into a genuinely investable thesis.
The Europe Tire Market reached a volume of 458.89 Million Units in 2025 and is projected to reach 565.69 Million Units by 2034, growing at a CAGR of 2.35% (2026–2034).
A strategic analysis of how PLI policies and localization drive global OEM investments. India’s EV battery market hits USD 15,898.31 Million by 2034 (21.7% CAGR).
A tyre is circular in shape and made of a combination of rubber materials that fit perfectly over a circular rim on a wheel, providing traction, load-carrying capabilities, shock absorption, and directional stability. As such, tyres are engineered materials composed of a combination of natural or synthetic materials. They are composed of a combination of materials such as rubber, a combination of materials such as steel or textile, and various chemical materials, among others.
A tractor is a self-propelled, torque-requiring vehicle intended primarily for pulling power at low speeds for agricultural, industrial, and utility purposes. It functions as a mobile power source that can be used for towing, pushing, lifting, or driving a variety of agricultural implements through mechanical, hydraulic, or power take-off systems. Tractors are designed with powerful propulsion systems, sturdy frames, and versatile coupling systems for use on different terrains and under heavy loads.
The electric boat and ship market size is experiencing unparalleled growth as the marine industry embraces electrification on a large scale across different geographies. As sustainability is becoming a strategic priority, with each passing day, more and more marine operators look to electric propulsion technologies as alternatives aimed at cutting down emissions, improving operational efficiencies, and enabling greener ports.
The GCC car rental market has emerged as a critical component of the region's transportation ecosystem, driven by robust tourism activity, expanding business travel, and a substantial expatriate population. Countries across the Gulf Cooperation Council are witnessing unprecedented demand for flexible mobility solutions that cater to diverse customer segments. The GCC car rental market size was valued at USD 1.65 Billion in 2024 as governments prioritize infrastructure development and sustainable tourism initiatives.
The Indian automotive sector has formed a vital part of the country's industrial and economic development for a long period. Over the years, the industry has transformed significantly, influenced by changes in technology, global trends, and consumer preference. Among the various factors shaping its trajectory, government policies have emerged as a decisive force driving growth, innovation, and competitiveness in the India auto parts manufacturing industry.
The India motorcycle tires market continues to evolve in response to changing mobility preferences, rising urbanization, and the growing significance of two-wheelers as essential transportation assets for millions of riders. As per sources, the India motorcycle tires market size reached USD 933.66 Million in 2024. The market is projected to reach USD 2,419.36 Million by 2033, exhibiting a growth rate (CAGR) of 10.3% during 2025-2033.
The Saudi Arabia tire market is undergoing a significant transformation driven by the nation’s economic diversification, rapid urbanization, and growing vehicle ownership. As one of the largest automotive hubs in the Middle East, Saudi Arabia is witnessing increasing demand for both passenger and commercial vehicle tires across urban and industrial regions.
One of the world's most dynamic and quickly changing markets, India's automotive industry is undergoing revolutionary changes in both the new and used car markets. Despite general economic uncertainty, the used car industry has shown remarkable resilience and growth potential, making it a particularly vibrant part of this ecosystem.
One of the world's most vibrant and quickly growing automobile markets is India's passenger car sector. From technological innovation to economic development, a number of interrelated factors have contributed to the sector's remarkable transformation. For stakeholders looking to take advantage of the enormous opportunities in this dynamic market, it is imperative that they comprehend these growth drivers.
India's truck industry is at a turning point in its development, driven by extensive government policies that are changing the commercial vehicle market. The industry, which is the foundation of the country's logistics ecosystem, is gaining previously unheard-of momentum thanks to smart regulatory frameworks and forward-thinking legislative initiatives. A fundamental change in truck operations on Indian highways is being sparked by government initiatives ranging from infrastructure development to emission standards, digitalization, and financial incentives.
The electric rickshaw sector in India has experienced a significant upheaval in recent years and is now a vital part of the country's sustainable transportation network. Strategic government policies aimed at hastening the adoption of clean mobility solutions have played a major role in orchestrating this evolution. India's larger vision of sustainable urbanization is in line with the electric rickshaw industry, which combines social development objectives, economic opportunities, and environmental imperatives.
Transportation in India is undergoing a spectacular change with the advent of electric two-wheelers that are quite an enticing alternative to traditional fuel-powered ones. This change is not merely an act of technological transformation, but an indication of how millions of Indians will think about city mobility, eco-awareness, and economic effectiveness.
As one of the world's leading industrial powerhouses, Japan has long been recognized for its commitment to technological innovation and manufacturing precision. The industry for industrial automation components—encompassing sensors, controllers, actuators, drives, robotics, and human-machine interfaces—represents the backbone of modern manufacturing infrastructure.
The Australian brakes and clutches industry plays a vital role in ensuring vehicle performance, safety, and efficiency across both automotive and industrial segments. As the nation transitions toward electric mobility and smarter manufacturing systems, the demand for advanced braking and clutch mechanisms is rising significantly.
The Philippines automotive wiring harness industry stands at a transformative juncture, driven by technological innovations that are reshaping vehicle electrical architectures worldwide. As vehicles evolve into sophisticated mobile computing platforms, the wiring harness, the circulatory system transmitting electrical power and data throughout modern automobiles, has become increasingly complex and critical to vehicle performance.
Japan's hybrid vehicles market stands as a global benchmark for sustainable mobility innovation, demonstrating remarkable growth and technological leadership. The market achieved a valuation of USD 33.57 Billion in 2024. Japan's hybrid vehicle (HV) market is one of the most established globally, originating with pioneering models like the Toyota Prius. It currently represents a significant portion of the country's automotive sales.
The Japan warehouse robotics market is a highly dynamic and rapidly expanding segment of the global automation industry. The market, valued at USD 414.0 Million in 2024, is on a sharp growth trajectory. Its growth is fueled by critical domestic factors, including a severe labor shortage, the rapid expansion of e-commerce, and Japan's strategic position as a world-leading robotics manufacturer.
The UK is rapidly evolving into a dynamic hub for autonomous vehicle research, testing, and early-stage deployments. A strong ecosystem comprising academic institutions, technology start-ups, automakers, and mobility service providers fosters continuous innovation. Supported by a skilled workforce specializing in software, sensing, robotics, and transportation systems, the nation has become a fertile ground for experimentation.
Japan’s transportation landscape is on the brink of a major shift, with robo taxis, autonomous, driverless vehicles designed for passenger and goods transport, emerging as a practical mobility solution. The Japan robo taxi market reached USD 83.2 Million in 2024 . This remarkable expansion reflects Japan’s broader move toward smart mobility, sustainability, and automation.
The Japan electric truck market is experiencing transformative growth as the nation accelerates toward sustainable transportation and carbon neutrality. As a leading automotive manufacturing hub, Japan is witnessing unprecedented momentum in commercial vehicle electrification, driven by stringent environmental regulations, technological innovation, and strategic government support. The electric truck industry represents a critical component of Japan's commitment to achieving 100% electrified vehicle sales by 2035 and carbon neutrality by 2050.
An EV charging station represents the necessary main infrastructure that allows electrical energy to be transferred from the power grid into electric vehicles to enable their use for transportation. Unlike conventional fueling stations that offer liquid fuels, EV charging stations provide electric power through the use of standardized connectors and smart control systems. The core components include a power conversion unit, which transforms alternating current from the grid into direct current for the vehicle battery; a charging controller controlling communication between the charger and the EV; and a connector or plug matched to the vehicle's charging interface.
An electric scooter is a two-wheeled vehicle powered by an electric motor and rechargeable battery, aimed at offering the means for efficient, eco-friendly, and cost-effective urban mobility. Apart from the traditional scooters that are powered by internal combustion engines, the electric scooters make use of lithium-ion or lead-acid batteries that feed an electric supply to a BLDC motor, which drives the wheels either directly or via a belt or chain mechanism.
Electric bikes, commonly referred to as e-bikes, are one of the most transformational innovations in modern personal mobility, combining conventional bicycle mechanics with advanced electric propulsion technology. At the heart of e-bikes are an electric motor, a rechargeable battery, and a control system that add assistance to the rider while pedaling, making cycling easier, faster, and more accessible across varied terrains. Based on their design, they can be further categorized into pedal-assist, throttle-controlled, or hybrid models, each providing different levels of rider control and engagement of the motor.
The micro-mobility industry has emerged as a transformative force in urban transportation, revolutionizing how people navigate cities worldwide. According to IMARC, the global micro-mobility market size was valued at USD 63.10 Billion in 2024. Looking forward, IMARC Group estimates the market to reach USD 204.83 Billion by 2033, exhibiting a CAGR of 12.86% from 2025-2033.
India's electric vehicle (EV) revolution is accelerating at a breakneck speed, powered by a strategic combination of government incentives, infrastructure investments, and manufacturing policies that are transforming the automotive landscape. The IMARC Group forecasts that the Indian electric car market reached USD 963 Million in 2024.
The diesel engine industry is standing at a transformative crossroads. As global markets are pushing for sustainability, stricter emissions compliance, and cutting-edge innovations, diesel powertrains are facing both immense pressure and promising potential.
The global tire market is a multi-billion-dollar industry, driven by the growing demand for vehicles across emerging economies and the replacement tire segment in developed countries. The global tire market is expected to grow at a compound annual growth rate (CAGR) of 4.70% between 2025 and 2033. The industry is heavily influenced by factors such as technological advancements, raw material prices, environmental regulations, and consumer preferences.
Australia's electric vehicle (EV) sector is experiencing swift expansion, fueled by increasing interest in eco-friendly transportation alternatives. In 2024, sales of battery electric and plug-in hybrid vehicles hit an all-time high, totaling around 114,000 units.
The electric bus industry is the part of the transportation sector that deals with the production and installation of buses that run completely or partially on electricity, employing battery packs or fuel cells in place of conventional diesel or gasoline engines. The buses deliver lower greenhouse gas emissions, lesser noise levels, and enhanced energy efficiency, and thus they are a prime solution for environmentally friendly public transport.
India's electric vehicle market is undergoing a profound transformation, impelled by green priorities, economic imperatives, and changing consumer trends. With rising concerns about air pollution and fossil fuel dependence, electric mobility has become a strategic option for India's transport industry. Policy clarity, technology development, and an emerging ecosystem of makers and suppliers are driving this market shift.
The global electric vehicle market size was valued at USD 755 Billion in 2024. The global EV market is rapidly expanding, driven by technological advancements, government incentives, stricter emission regulations, rising fuel costs, extended battery range, growing environmental consciousness, and significant investments in charging and production infrastructure.
Electric Vehicles, or EVs, are vehicles operated partially or wholly by electrical power, generally with rechargeable battery packs as their fuel. In contrast to conventional internal combustion engine cars, EVs emit no tailpipe emissions, making them a cleaner, environmentally friendly transportation choice. EVs comprise Battery Electric Vehicles (BEVs), Plug-in Hybrid Electric Vehicles (PHEVs), and Hybrid Electric Vehicles (HEVs), and are gaining ground in passenger, commercial, and two-wheeler segments owing to developments in battery technology, charging infrastructure, and policy support.
Aluminum alloy wheels are high-performance, lightweight, and durable components widely used in the automotive industry. Their superior strength-to-weight ratio enhances vehicle efficiency, fuel economy, and handling, making them a preferred choice for both passenger and commercial vehicles. Beyond their functional benefits, aluminum alloy wheels contribute to vehicle aesthetics, offering sleek designs and customization options that appeal to consumers. Their corrosion resistance and thermal conductivity further enhance braking performance and longevity. With increasing demand for fuel-efficient and stylish vehicles, aluminum alloy wheels play a crucial role in the global automotive sector, catering to OEMs, aftermarket suppliers, and performance vehicle manufacturers.
A tyre is a crucial component of a vehicle, serving as the outer covering of a wheel. Its main purposes are to support the vehicle's weight, provide traction for movement, and act as a flexible cushion that absorbs shocks from the road. Usually composed of rubber, tires are strengthened with steel and cloth. Tires for cars, trucks, motorbikes, bicycles, and other vehicles have different designs and compositions depending on the vehicle type and its intended usage. To improve stability and grip, they have a tread pattern on the outside.
Electric kick scooters are small, battery-operated personal transportation vehicles intended for short-distance and urban movement. They offer an economical and environmentally responsible substitute for conventional modes of mobility thanks to their electric engine, rechargeable battery, and lightweight frame. The need for sustainable transportation options, traffic congestion, and growing urbanisation have all contributed to their rise in popularity. Electric kick scooters are now the go-to option for last-mile connectivity and personal commuting because to developments in battery technology, connectivity features, and government programs encouraging micro-mobility.
An automotive wiring harness is an organized assembly of electrical wires, connectors, and terminals that transmit power and signals across a vehicle’s electrical system. It guarantees effective communication between several parts, including the engine control unit, lighting, and sensors. Wiring harnesses are intended to increase vehicle performance and safety by lowering the possibility of short circuits. By maximising electrical connectivity and lowering wire complexity, they are utilised in both conventional and electric automobiles and are essential to contemporary automotive technology.
In an automotive braking system, brake pads are the most important parts since they are engineered to contact the brake rotor to produce friction, thus stopping or slowing down a vehicle in virtually any driving condition safely and efficiently. The key way of classifying these pads is according to their material types: low metallic, ceramic, organic, and semi-metallic.
Tires are essential components of vehicles designed to provide traction, support, and absorb road shocks. Primarily made of rubber, tires consist of treads, belts, and sidewalls that work together to offer grip, stability, and durability. Modern tires come in various types – such as all-season, winter, and performance tires – each engineered for specific driving conditions. The two major tire categories are radial and bias tires, and they are available in different sizes to suit various vehicle types, including passenger cars, light commercial vehicles, medium and heavy commercial vehicles, two-wheelers, and off-road vehicles.
Electric Vehicles (EVs) are powered by electric motors instead of traditional internal combustion engines (ICEs). Electric motors propel EVs by utilizing electricity stored in rechargeable batteries or other energy storage systems. They produce lower or zero tailpipe emissions, reduce air pollution and greenhouse gas (GHG) emissions, and help in mitigating climate change. Electric vehicles consist of various components, such as battery cells and packs, reducers, fuel stacks, power control units, power conditioners, air compressors, humidifiers, motors, on-board chargers, battery management systems, and others. EVs are classified into four types based on propulsion, outlined below.
Saudi Arabia is the second-largest producer and exporter of crude oil and holds the second-largest proven oil reserves in the world, with around 267 billion barrels. The country's oil sector is a significant part of its economy, accounting for 75% of government revenue and approximately 90% of exports. However, due to the volatility of oil prices and the potential for economic instability, Saudi Arabia is increasingly focusing on non-oil activities to reduce its dependency on the oil sector. Non-oil commodities tend to have more stable prices, providing protection against these fluctuations and strengthening the country's social, economic, and financial sectors.