How Technology Is Driving Innovation in the Retail Automation Market
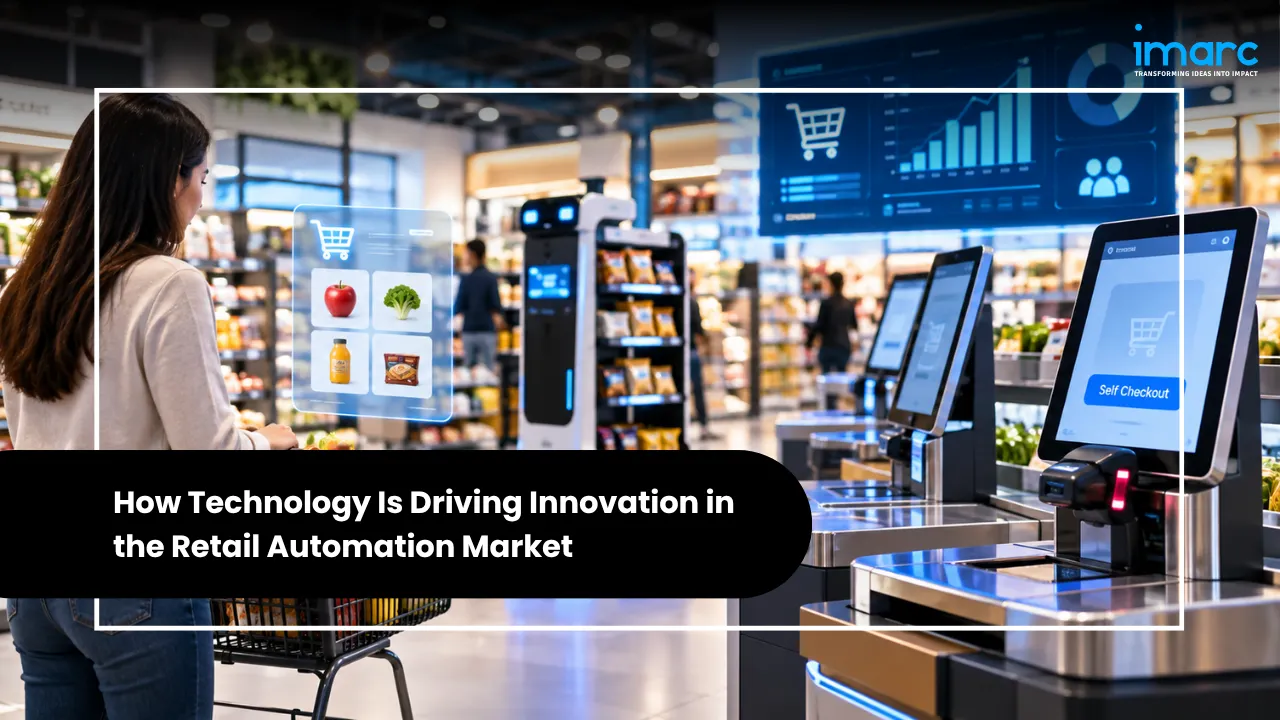
Introduction: Technologies Reshaping Retail Automation
The retail automation market sits at the centre of a structural shift in how goods are sold, priced, moved and paid for. According to IMARC Group, The global retail automation market size reached USD 21.2 Billion in 2025. Looking forward, IMARC Group expects the market to reach USD 40.9 Billion by 2034, exhibiting a growth rate (CAGR) of 7.34% during 2026-2034. That trajectory is not the product of one breakthrough. It reflects the compounding effect of several maturing technologies, from point of sale software and electronic shelf labels to computer vision and warehouse robotics, being deployed together inside the same store network.
The growth drivers are operational as much as technological. Retailers operate on thin margins, face persistent wage pressure, and compete against e-commerce platforms that have normalised same-day delivery and personalised recommendations. Automation answers these pressures directly: it reduces manual handling, improves inventory accuracy, and releases store staff for customer-facing work. IMARC Group identifies significant technological advancement, rising labour costs and demand for better consumer experience as the primary drivers, while cost reduction and operational efficiency remain the clearest return on investment for most deployments.
The defining theme is convergence. Artificial intelligence, machine learning, computer vision and the Internet of Things are being layered onto hardware that already exists in stores and distribution centres, which is why adoption is scaling without a full replacement of legacy systems. A representative example is Zebra Technologies, which introduced the TC22/TC27 mobile computer in June 2023 to improve productivity and manageability, targeting small and medium-sized businesses in retail and utilities. Similar momentum is visible in autonomous shelf-scanning robots from Simbe Robotics and in the AI-driven shopping and spatial computing applications retailers began deploying during 2025.
This blog examines the technologies driving innovation in the market, the segments and regions leading adoption, the competitive and policy context, and where the opportunity sits through 2034.
Key Takeaways
- The global retail automation market size reached USD 21.2 Billion in 2025. Looking forward, IMARC Group expects the market to reach USD 40.9 Billion by 2034, exhibiting a growth rate (CAGR) of 7.34% during 2026-2034, according to IMARC Group.
- Point-of-Sale (POS) is the leading type segment, warehouse leads on implementation, and supermarkets and hypermarkets form the largest end-user group, because these are the points where transaction volume, inventory turnover and labour intensity are highest.
- North America accounts for the largest regional share, supported by advanced technology infrastructure, high disposable incomes, early technology adoption and the presence of large retail chains, with Asia Pacific and Europe following.
- The most notable recent development is the broadening of AI and robotics deployment during 2025, with retailers piloting delivery robots, drone deliveries, AI-driven shopping assistants and spatial computing in stores and fulfilment operations.
- The key trend is the convergence of AI, computer vision, RFID and cloud platforms into integrated omnichannel systems, which lifts shopper experience while improving back-end inventory accuracy.
Retail Automation Market Size, Share & Growth Outlook
According to IMARC Group, The global retail automation market size reached USD 21.2 Billion in 2025. Looking forward, IMARC Group expects the market to reach USD 40.9 Billion by 2034, exhibiting a growth rate (CAGR) of 7.34% during 2026-2034. A question that retailers, technology vendors and investors ask repeatedly is which segments are leading the Retail Automation Market and why. The answer lies in where transaction volume, inventory complexity and labour intensity are concentrated, and the segment data points to three consistent leaders across type, implementation and end user. The leading segments are:
- Type: Point-of-Sale (POS) holds the largest share by type, reflecting its role in processing transactions, enabling customer interaction and managing inventory. As omnichannel strategies spread, POS systems have evolved into integrated platforms that connect physical and digital sales channels rather than standalone terminals. IMARC Group notes that The global Point of Sale (POS) software market size reached USD 13.6 Billion in 2025. Looking forward, IMARC Group expects the market to reach USD 25.3 Billion by 2034, exhibiting a growth rate (CAGR) of 6.91% during 2026-2034. Barcode and RFID systems, electronic shelf labels, cameras and autonomous guided vehicles follow, with adoption rising as store-level data capture improves.
- Implementation: Warehouse accounts for the largest share by implementation, because order fulfilment, inventory management and logistics carry the heaviest automation workload in an e-commerce-led retail economy. Automated storage and retrieval systems, robotic picking and conveyor automation improve accuracy and scalability at exactly the point where manual processes fail under volume. IMARC Group projects the The global warehouse robotics market size reached USD 7.6 Billion in 2025. Looking forward, IMARC Group expects the market to reach USD 16.9 Billion by 2034, exhibiting a growth rate (CAGR) of 8.96% during 2026-2034, a rate well above the overall market average and a clear signal of where capital is flowing fastest. In-store implementations follow, spanning self-checkout lanes, digital signage, shelf-scanning robots and electronic shelf labels.
- End User: Supermarkets and hypermarkets represent the largest end-user segment, given their large-format footprints and high throughput. IMARC Group cites reporting by the Economic Times that retail chains are seeking space across multiple cities with the intent of opening 300 supermarkets and hypermarkets over the next three years. These formats adopt automation to streamline operations, improve customer experience and tighten inventory control, which makes them the primary volume channel for checkout, labelling and analytics hardware. Single item stores, fuel stations and retail pharmacies are smaller contributors but are adopting self-service kiosks, automated vending and automated dispensing systems.
- Region: North America leads the market, supported by high technology infrastructure, rising disposable incomes and early technology adoption, combined with a preemptive approach to innovation across a mature retail sector. The United States anchors the region, where retail e-commerce sales reached USD 285.2 Billion in the fourth quarter of 2023, an increase of 0.8% over the third quarter, according to the Census Bureau of the Department of Commerce. Europe, Asia Pacific, Latin America and the Middle East and Africa follow, with Asia Pacific expanding as organised retail chains scale across China, India and Southeast Asia.
Taken together, these segments show that automation spending follows transaction density and fulfilment complexity rather than novelty, which explains why POS, warehouse systems and large-format grocery have led every recent adoption cycle.
Recent News & Mega Announcements
Investment and product activity from mid-2023 through early 2026 shows where the industry believes the next wave of value sits: artificial intelligence, robotics and connected store infrastructure. The developments below illustrate what is driving the growth of the Retail Automation Market, and each one maps to a specific capability gap retailers are trying to close.
- Retailers scale AI, robotics and spatial computing (August 2025): Industry coverage of retail technology adoption in 2025 identified four fast-moving deployment areas: delivery robots, drone deliveries, AI-driven shopping and spatial computing. Retailers are investing heavily in artificial intelligence, robotics and interactive technologies to bridge gaps between digital and physical shopping, and each category shifts labour away from repetitive tasks while adding service capacity.
- AI takes the spotlight at the NRF retail technology showcase: Reporting from the retail technology industry noted that AI dominated the NRF showcase, while innovation award categories were expanded to cover retail media and RFID. That expansion matters because it treats item-level tagging and in-store media as core automation infrastructure rather than marketing add-ons, which raises the strategic profile of hardware such as RFID readers and electronic shelf labels.
- Cloud spending doubles as the platform layer (2025): Analysis of technology spending found that outlays on public cloud services more than doubled from USD 332 Billion in 2021 to USD 723.4 Billion in 2025. Retail automation depends on this layer because AI-based forecasting, computer vision and unified commerce platforms all require elastic compute and centralised data, and cloud economics increasingly determine whether a mid-sized chain can afford advanced analytics.
- Zebra Technologies expands its mobile computing line (June 2023): Zebra Technologies introduced the TC22/TC27 mobile computer, positioned for organisations seeking improved productivity and manageability and particularly suited to small and medium-sized businesses across retail and utilities. Handheld devices remain the most widely deployed automation tool at store level because they connect shelf-edge activity to inventory and pricing systems in real time, and they lower the entry cost of digitisation for independent retailers.
- Payment terminal refresh cycles continue: Contactless, mobile wallet and tokenised card acceptance have become baseline requirements at checkout, which keeps replacement demand steady for terminal hardware and pushes software-defined payment acceptance into self-service formats. This is a lower-profile but highly predictable source of demand in the market.
Industry Trends Shaping the Retail Automation Market in 2026
Three technology themes explain most of the near-term change in this market. Each is already commercially deployed; what shifts during 2026 is scale, integration and the sophistication of the data layer behind the hardware.
1. AI, Computer Vision and Edge Analytics
Artificial intelligence has moved from pilot to production in store operations, and computer vision is the primary sensing technology behind that shift. Cameras mounted on shelves, ceilings and autonomous robots now detect out-of-stock positions, mispriced labels, planogram deviations and shrink events without requiring staff to walk the aisle with a clipboard. Edge processing keeps much of the inference local, which reduces bandwidth cost and latency, and allows a store to keep functioning when connectivity degrades.
The commercial logic is straightforward. Personalisation drives loyalty behaviour: IMARC Group cites Forbes reporting that 91% of individuals stated there is a high chance they will shop with brands that provide offers and recommendations relevant to them. To act on that expectation, retailers need clean, real-time data about what is on the shelf and what the shopper has previously bought, which is precisely what computer vision and AI-driven recommendation engines supply.
The practical effect is that analytics has become a hardware purchase decision. Retailers evaluating shelf-scanning robots or smart cameras are effectively buying the accuracy of their demand forecasting and replenishment cycle, which is why these systems now sit alongside inventory planning and loyalty platforms rather than inside a separate innovation budget.
2. Frictionless Checkout, Electronic Shelf Labels and RFID
Checkout remains the most visible automation battleground. Self-checkout lanes, scan-and-go applications and computer-vision based checkout systems all aim at the same outcome: shorter queues, fewer staffed lanes and a more predictable transaction. As POS software becomes cloud-connected, transaction data feeds pricing, promotions and inventory systems automatically, which turns the terminal into a data collection point rather than only a payment device.
Electronic shelf labels and RFID are the quieter half of the same story. Electronic shelf labels remove the labour and error associated with manual price changes and support dynamic pricing at the shelf edge. Item-level RFID tagging delivers inventory accuracy that barcode scanning cannot match, particularly for apparel and general merchandise where a single scan can reconcile an entire stack of goods. The decision to expand retail technology innovation awards into retail media and RFID reflects how central this capability has become to omnichannel promises such as buy online, pick up in store.
Combined, these technologies address the operational gap that most damages shopper trust: the difference between what a retailer's systems say is available and what is actually on the shelf.
3. Warehouse Robotics and Automated Fulfilment
Behind every storefront promise sits a fulfilment operation, and this is where automation intensity is highest. Automated storage and retrieval systems, autonomous guided vehicles, autonomous mobile robots and robotic picking arms now handle the repetitive movement that previously consumed most warehouse labour hours. Retailers adopt them because accuracy and throughput scale more reliably with robots than with headcount during peak trading periods.
The adjacent software layer is expanding just as quickly. Robotic process automation now handles back-end tasks such as invoicing, data entry and inventory tracking. IMARC Group reports that the The global robotic process automation market size reached USD 6.3 Billion in 2025. Looking forward, IMARC Group expects the market to reach USD 42.7 Billion by 2034, exhibiting a growth rate (CAGR) of 22.94% during 2026-2034. That growth rate indicates how quickly retailers are willing to automate administrative workflows once the physical operation is mechanised.
Last-mile innovation is the newest extension of this trend. Delivery robots and drone delivery trials, which featured prominently among retail technology deployments during 2025, move automation beyond the four walls of the store and into the customer's street. They remain geographically limited, but they extend the market for routing software, sensors and fleet management into retail operations.
.webp)
Geographic Hotspots
North America leads the retail automation market on account of high technology infrastructure, rising disposable incomes and an early technology adoption rate, reinforced by a preemptive approach to innovation across large retail chains. The region's advantage is less about any single technology than about the density of large-format retail and the willingness of operators to fund multi-year modernisation programmes. United States chains have been the earliest adopters of self-checkout at scale, electronic shelf labels in grocery, and shelf-scanning robotics, and Canadian retailers typically follow within a short window. Strong e-commerce penetration also means that store automation and fulfilment automation are planned together rather than separately.
Asia Pacific is the most diverse regional landscape in the market. China combines large-scale unmanned retail formats, advanced mobile payment infrastructure and substantial robotics manufacturing capacity, which shortens the path from prototype to deployed unit. Japan faces acute labour shortages in convenience retail and has responded with automated payment, self-service kiosks and back-office automation, while South Korea has moved quickly on contactless formats. India is expanding organised retail rapidly, with chains investing in POS systems, self-checkout and warehouse automation as larger store formats spread across tier one and tier two cities. Australia and Indonesia contribute through grocery modernisation and digital payment adoption respectively. The result is a region where the automation mix differs country by country but the direction of travel is consistent.
Europe presents a mature but regulation-shaped market. Germany, France, the United Kingdom, Italy, Spain and Russia all have significant installed bases of POS, electronic shelf labels and warehouse automation, and European grocery chains have been among the most aggressive adopters of electronic shelf labels for labour cost reasons. Data protection obligations under the General Data Protection Regulation and the European Accessibility Act influence how self-service terminals and camera-based analytics are specified, which raises compliance cost but also standardises deployment quality.
Latin America and the Middle East and Africa are smaller today but expanding from a low base. Brazil and Mexico lead Latin America through grocery and pharmacy retailing, while Gulf Cooperation Council markets have invested heavily in shopping destination infrastructure and integrated payment systems. In these regions, mobile-first retail behaviour means that automation investments often skip intermediate technology generations, moving directly to cloud-connected and contactless formats.
Competitive Landscape & Key Players' Strategies
The competitive landscape is moderately fragmented and organised around capability rather than a single product category. Very few vendors supply everything a retailer needs, so the market is shaped by bundling, partnership and platform strategy. The most consistent strategic pattern is the shift from selling hardware to selling an outcome: terminals are increasingly priced with software subscriptions, analytics and managed services attached, because the retailer's decision criterion is inventory accuracy, shrink reduction and labour hours saved rather than device specification. Key players in the market include:
- AGS Transact Technologies Ltd.: An India-based provider of payment solutions and managed services, including ATM and cash-management services, digital payments and transaction-processing infrastructure. Its strength lies in serving banks, retailers and public-sector clients in a fast-growing digital payments market.
- Diebold Nixdorf Incorporated: A global supplier of banking and retail technology, including self-checkout systems, point-of-sale terminals, ATMs, software and lifecycle services. Its positioning combines installed hardware with services and software that support the checkout and store-operations shift.
- Fiserv Inc.: A major payments and financial-technology company whose merchant offerings include the Clover point-of-sale platform. Its role in retail automation centres on integrating payment acceptance, commerce software and business-management tools.
- Fujitsu Limited: A Japanese IT and systems-integration group with retail offerings that include POS, self-service and unattended checkout solutions. It competes through integration capability and large-scale technology deployment for retail clients.
- Honeywell International Inc.: A diversified industrial technology company supplying barcode scanners, mobile computers, sensing devices and warehouse automation solutions. Its relevance to retail automation lies in connecting store, supply-chain and fulfilment operations.
- NCR Corporation: A long-established vendor of self-checkout, POS, software and managed services for retailers. It is a leading name in checkout automation, with an emphasis on commerce platforms and recurring software and service revenue.
- Olea Kiosks Inc: A kiosk specialist that designs and manufactures custom self-service kiosks and enclosures. It addresses retailers that need tailored form factors for ordering, information and payment applications.
- Posiflex Technology Inc.: A Taiwan-headquartered manufacturer of POS terminals, kiosks and related peripherals. It serves retail and hospitality customers with configurable hardware, often through channel partners and system integrators.
- Probiz Technologies Pvt: A technology provider active in retail and point-of-sale solutions, typically serving regional customers. It competes through localised solutions and service support rather than global scale.
- Sea Point China Limited: A regional participant in the retail automation and self-service equipment market. It adds to the competitive depth of the Asia-Pacific supply base, particularly in hardware-oriented offerings.
- Simbe Robotics Inc.: A robotics company known for its Tally shelf-scanning robot, which supports inventory visibility and shelf monitoring. It reflects the move toward automation that targets inventory accuracy and on-shelf availability directly.
- Zebra Technologies Corporation: A leading supplier of barcode scanners, mobile computers, printers, RFID solutions and workflow software. It is central to store-level data capture and inventory-management automation, with a growing mix of software and analytics.
Two competitive dynamics deserve attention. First, RFID and electronic shelf labels are becoming attach-rate businesses, where the vendor that wins the checkout or inventory platform also wins the tag and label contract, so the award-category focus on retail media and RFID is commercially significant. Second, the cloud spending surge, with public cloud outlays rising from USD 332 Billion in 2021 to USD 723.4 Billion in 2025, has lowered the cost of deploying AI at chain scale, which shifts competitive advantage toward vendors with strong data platforms rather than the broadest hardware catalogue.
Policy & Regulatory Landscape, Challenges & Risks
Regulation in this market operates less as a barrier to entry and more as a design constraint that shapes product specification and deployment timelines. The most material policy and risk factors are:
- Data Protection and Consumer Privacy: Camera-based analytics, loyalty data and personalised offers fall under the General Data Protection Regulation in Europe, the Personal Information Protection Law in China and state privacy statutes such as the California Consumer Privacy Act. Retailers must document lawful basis, retention and consent, which adds compliance cost and slows deployment in jurisdictions with stricter interpretation.
- Payment Security Standards: Point-of-sale terminals, self-checkout systems and payment applications must comply with the PCI Data Security Standard, and the transition to newer versions imposes recertification work. Non-compliance risk is financial and reputational, and it makes security architecture a procurement criterion rather than an afterthought.
- Accessibility Requirements: The Americans with Disabilities Act in the United States and the European Accessibility Act establish accessibility expectations for consumer self-service terminals. Retailers deploying self-checkout and kiosks must provide accessible alternatives, such as staffed lanes or assistive interfaces, which directly affects store layout design.
- Radio, Labelling and Type Approval Rules: RFID and wireless store devices require type approval and spectrum compliance, with differences between jurisdictions, and packaging and product labelling rules add further complexity for chains operating across borders.
On the constraining side, several structural risks persist:
- High Implementation Costs: Significant upfront investment in automation hardware, software, and system integration can limit adoption, particularly among small and medium-sized retailers.
- Integration Complexities: Integrating automation solutions with legacy POS systems, inventory platforms, and existing retail infrastructure can increase deployment time and operational costs.
- Workforce Skill Gaps: Shortages of skilled professionals to manage, maintain, and optimize automated retail systems can hinder implementation and long-term operational efficiency.
- Data Security and System Reliability: Cybersecurity threats, customer data privacy concerns, and technical disruptions can undermine retailer confidence and affect business continuity.
Forecast 2026-2034
IMARC Group projects the market to grow from USD 21.2 Billion in 2025 to USD 40.9 Billion by 2034, a CAGR of 7.34% during 2026-2034. For stakeholders across the retail automation market, the significance of that number lies less in its size than in its composition: mid-single-digit to high-single-digit annual growth on a large base indicates steady replacement demand layered with genuine new capability spending, rather than a short-lived capital cycle.
Three factors support the forecast. The first is the installed base. Every supermarket, hypermarket, fuel station and pharmacy that already runs POS, barcode or electronic shelf label infrastructure will eventually refresh that hardware, and each refresh now ships with more software, sensing and connectivity than the generation it replaces. The second is the fulfilment imperative, where warehouse automation carries a growth rate above the market average because e-commerce order profiles require it. The third is the falling cost of intelligence, where cloud capacity and open AI tooling allow mid-sized chains to adopt forecasting, vision and personalisation that were previously affordable only to the largest operators.
The forecast is not without constraints. Integration cost, payback period and the availability of skilled staff to run automated systems will determine how quickly the lower end of the retail market converts from interest to purchase. On balance, the direction is clear: automation is moving from a competitive differentiator to a baseline operating requirement across grocery, convenience, fuel and pharmacy retail.
Opportunities for Stakeholders
- Retail Chains and Franchise Operators: The clearest opportunity is labour redeployment rather than pure headcount reduction. Automating replenishment checks, price changes and routine transactions allows staff to shift to service, fulfilment and upselling, and IMARC Group identifies better consumer insights and online-to-offline integration as two of the most significant opportunities in the market.
- Technology Vendors and System Integrators: The shift from device sales to bundled software, analytics and managed services creates recurring revenue and raises switching costs. Vendors that can connect POS, RFID, electronic shelf labels and camera analytics into one data model will capture a disproportionate share of chain-level contracts.
- Payment Processors and Fintechs: Unified commerce, tokenisation and embedded payment acceptance across self-service formats represent a durable growth area, particularly in fuel, pharmacy and quick service, where unattended transactions dominate.
- Logistics and Fulfilment Operators: Warehouse robotics, automated storage and retrieval and robotic process automation address the highest-labour-cost activity in the value chain, and demand is reinforced by continued e-commerce volume growth.
- Robotics and Computer Vision Suppliers: Autonomous shelf scanning, shrink detection and in-store analytics remain underpenetrated in mid-sized chains. Partnering with a retail media network can offset the cost of sensing hardware by monetising the data and screen inventory it generates.
- Retail Media and Data Monetisation Teams: As RFID and in-store digital signage become standard, the store itself becomes a measurable media channel, and the expanded award categories for retail media and RFID reflect that commercial reality.
- Investors and Private Equity: Recurring software and service revenue attached to essential store infrastructure produces predictable cash flows, and the gap between early adopters and the long tail of independent retailers represents a consolidation and roll-up opportunity.
- Governments and Workforce Programmes: Public support for small retailer digitisation and for reskilling displaced retail workers addresses the two social risks most associated with automation, labour displacement and capital access, while accelerating adoption across the SME segment.
Automation as the Retail Baseline
Innovation in this market is not being driven by a single technology but by the deliberate combination of several. Point of sale software, RFID and electronic shelf labels capture what happens at the shelf and the checkout. Computer vision, AI and edge analytics interpret that data and turn it into replenishment, pricing and personalisation decisions. Warehouse robotics, autonomous guided vehicles and robotic process automation execute the physical and administrative consequences of those decisions. Cloud infrastructure supplies the compute and the centralised data model that holds the whole system together, and public cloud spending rising from USD 332 Billion in 2021 to USD 723.4 Billion in 2025 shows how much more affordable that foundation has become.
The market outlook supports that reading. Growth from USD 21.2 Billion in 2025 to USD 40.9 Billion by 2034, a CAGR of 7.34% during 2026-2034, is consistent with a technology class that has moved past experimentation into mainstream capital planning. North America will continue to set the pace given its infrastructure, income levels and adoption culture, while Asia Pacific supplies the fastest-changing competitive environment as organised retail scales. The practical message for retailers, vendors and investors is that the differentiator is no longer whether to automate, but how well the automated systems are integrated with one another.
Our Clients










Contact Us
Have a question or need assistance?
Please complete the form with your inquiry or reach out to us at
Phone Number
+91-120-433-0800+1-201-971-6302
+44-113-547-7077
Previous Post

CCTV cameras now watch over homes, shops, offices, factories, highways, railway stations, and entire cities, and India has become one of the fastest-growing surveillance markets in the world.
The Wireless Charging Market is rapidly transitioning from a convenience feature to a foundational technology layer across consumer electronics, electric vehicles, healthcare devices, and industrial automation.
Artificial intelligence has changed what a data center needs. GPU clusters draw several times more power per rack than traditional servers and produce far more heat, so operators need heavier racks, higher-capacity power distribution, larger UPS systems, and liquid cooling that was rare only a few years ago.
Mexico has become one of Latin America's most active data center destinations, as hyperscalers build cloud regions, manufacturers relocate supply chains, and enterprises move workloads off their own premises.
Japan built the world's deepest robotics ecosystem, and it is now rebuilding that ecosystem around artificial intelligence. According to IMARC Group, the Japan Industrial Robotics Market was valued at USD 1,285.76 Million in 2025 and is projected to reach USD 2,864.83 Million by 2034, growing at a CAGR of 9.31% (2026–2034).
The Japan HR Tech Market grew from USD 2.16 Billion in 2025 to USD 2.31 Billion in 2026 and is projected to reach USD 3.93 Billion by 2034, at a CAGR of 6.87% (2026–2034). Rapid AI and machine learning integration across HR processes, stringent labor compliance requirements, and accelerating digital transformation of enterprise HR operations are the key growth catalysts driving Japan Human Resource Technology adoption.
The Japan Digital Printing Market reached USD 1.46 Billion in 2025 and is projected to reach USD 2.51 Billion by 2034, growing at a CAGR of 6.24% (2026–2034). Digital printing transfers digital files directly onto substrates such as paper, fabric, plastic, glass, and ceramic without traditional printing plates, and Japan Digital Printing Industry is undergoing a genuine technology transformation as AI, cloud workflows, and sustainable ink chemistry converge.
Europe's data center sector is drawing renewed investor attention because AI compute demand, digital sovereignty regulation, and renewable-energy siting economics have converged into a single, unusually large capital cycle.
The Japan Supply Chain Management Software Market reached USD 1,194.5 Million in 2025 and is projected to reach USD 1,616.7 Million by 2034, growing at a CAGR of 3.42% (2026–2034), as manufacturers and logistics operators across the country replace manual, spreadsheet-driven planning with connected digital platforms.
The Japan In-App Advertising Market is evolving rapidly as brand budgets shift decisively toward mobile-first channels. The market reached USD 9.21 Billion in 2025 and is projected to reach USD 30.30 Billion by 2034, growing at a CAGR of 14.16% (2026–2034), making this one of the fastest-growing segments within the broader Japan Mobile Advertising Market.
India’s data center sector is entering a defining growth phase. From a handful of facilities concentrated in Mumbai and Bengaluru a decade ago, the India data center industry has evolved into a continental-scale infrastructure ecosystem attracting billions of dollars in global investment.
As the Kingdom advances its economic diversification and technological development agenda, smart city development has emerged as a cornerstone of national strategy. This analysis explores the multifaceted dimensions of smart city initiatives, examining how digital innovation reshapes urban landscapes across Saudi Arabia.
The network security industry stands at the forefront of modern enterprise defense strategies, as organizations worldwide are confronting an increasingly hostile digital landscape. With cyber threats evolving in sophistication and frequency, businesses across every sector recognize that robust network protection is no longer optional but essential for operational continuity and stakeholder trust.
India has emerged as a global powerhouse in technology services, transforming from a back-office support destination to a strategic innovation hub. The nation's technology sector represents a cornerstone of economic development, driving substantial contributions to GDP while creating millions of employment opportunities across urban and rural landscapes.
The process of digital transformation in India has become an extremely fast one in the last several years, and cloud computing has become a foundation of the revolution. The India cloud computing market is experiencing an unprecedented growth as organizations in various sectors come to the realization of the strategic value of cloud infrastructure.
The Kingdom of Saudi Arabia stands at the forefront of a remarkable digital transformation that is fundamentally reshaping its economic landscape and technological capabilities. The data center market research in the country reveals a sector experiencing unprecedented momentum, driven by the nation's ambitious modernization agenda and its strategic positioning as a regional technology hub.
The global sports management software market represents a dynamic and promptly evolving industry that rests at the intersection of technology innovation and the multibillion-dollar sports industry. As organizations across amateur leagues, professional clubs, sports associations, and entertainment venues seek competitive advantages in an increasingly digital landscape, sophisticated software platforms have emerged as essential infrastructure.
Saudi Arabia's corporate training market is experiencing a profound transformation, driven by an ambitious national agenda focused on economic diversification, digital innovation, and workforce empowerment.
The Gulf Cooperation Council (GCC) region continues to position itself as one of the fastest-evolving markets for packaged beverages, with bottled water standing at the forefront of this transformation. The GCC bottled water market size has expanded steadily in recent years, supported by a strong shift toward health-driven consumption, improved hydration awareness, and evolving lifestyle patterns across the member countries.
The digital health market in Saudi Arabia has been undergoing a phenomenal transformation through convergence, where healthcare providers, government agencies, and technology innovators join forces to create more accessible, efficient, and patient-centered ecosystems in healthcare.
The market represents one of the most dynamic segments within the region's rapidly evolving entertainment landscape. The GCC anime market size reached USD 644 Million in 2024 as per IMARC Group and is projected to grow to USD 1,265 Million by 2033 at a CAGR of 7.8% during 2025-2033.
The UK quantum computing industry has emerged as a critical frontier in the global race toward next-generation computing capabilities. Britain's ecosystem brings together world-class universities, pioneering research institutions, and ambitious commercial ventures working to harness quantum mechanics for computational advantage.
The Australia smart homes Industry has emerged as one of the most dynamic sectors within the global connected living ecosystem. Valued at USD 4.29 Billion in 2025, the market is projected to reach USD 11.54 Billion by 2034, according to IMARC Group.
India is undergoing an accelerated digital transformation, a systemic shift that is dependent on robust, high-performance digital infrastructure. At the very core of this paradigm is the surge in demand for facilities that can reliably store, process, and manage the nation’s exploding data volumes.
Over the last decade, digital payment systems in India have undergone a significant transformation, and credit cards have emerged as one of the major components of this financial revolution. Driven by increasing financial literacy, deeper penetration of digital banking, and a gradual shift towards cashless transactions, the Indian credit card market is growing at a rapid pace.
The Saudi Arabia industrial safety equipment market size reached USD 38.70 Million in 2024, experiencing a transformative phase as the Kingdom intensifies its focus on workplace protection and regulatory compliance across diverse industrial sectors. Industrial safety equipment is playing an increasingly vital role in safeguarding workers and assets throughout the oil and gas, construction, manufacturing, mining, and chemical processing industries that form the backbone of Saudi Arabia's economy.
The Germany smart cities market stands as one of Europe’s most advanced models of urban innovation, driven by sustainability, digitalization, and citizen-focused design. Germany’s smart city vision emphasizes balancing efficiency with inclusivity, integrating technology seamlessly into everyday urban life.
The IoT market of Saudi Arabia is seeing unprecedented growth as the Kingdom speeds up its journey toward comprehensive digital transformation. This is a growth trajectory that reflects commitment to modern infrastructure, increasing operational efficiency, and positioning Saudi Arabia as the regional technology hub.
The Brazil C4ISR market forms a vital part of the modernization agenda for the nation's defense, entailing sophisticated systems for command, control, communications, computers, intelligence, surveillance, and reconnaissance. As South America's largest economy and military force, Brazil has always taken the lead in developing advanced defense IT infrastructure to address regional security challenges and emphasize its strategic autonomy.
The data center market in Brazil has emerged as a vital cog in Latin America's wheel of digital transformation. With the increasing adoption of digital technologies, the need for reliable, secure, and scalable data storage and processing infrastructures is rapidly rising among enterprises, governments, and consumers.
The Saudi Arabia e-commerce market is undergoing a major transformation, becoming one of the fastest-growing digital economies in the Middle East. It reached a value of USD 222.9 Billion in 2024 on account of the rapidly expanding digital landscape, government initiatives like Vision 2030, and the increasing adoption of mobile commerce (m-commerce) and digital payment solutions.
The Saudi Arabia telecom market is undergoing rapid transformation mainly driven by accelerated digitalization, robust policy support, and growing consumer connectivity needs. The industry serves as a critical pillar of the Kingdom’s Vision 2030 strategy which aims to diversify the economy and establish Saudi Arabia as a digital hub in the Middle East.
The Australia legal services industry is undergoing rapid change driven by growing demand, technological advancement, and evolving regulation. Firms that are innovating while upholding quality, ethics, and client trust are succeeding. Regulatory complexity is fueling advisory work, technology is reshaping service delivery, and Australia’s position is enabling regional growth.
The Latin America carbon footprint management market represents a critical frontier in the global transition toward sustainable business practices and environmental accountability. As organizations across the region confront mounting pressure from stakeholders, investors, and regulatory bodies, the demand for sophisticated carbon emission tracking systems has intensified dramatically.
The UK's ATM market, therefore, stands as an important pillar in its financial ecosystem for the benefit of millions of consumers and businesses who rely on timely, convenient, and secure ways of accessing cash. However, despite the rapid acceleration of contactless payments and digital banking, ATMs remain indispensable across the urban and rural areas.
The India smartphone industry has cemented its position as one of the world's most critical and dynamic technology markets, undergoing a profound transformation driven by consumer aspiration and technological advancement. Far from merely being a volume-driven segment, the market is experiencing a significant value premiumisation trend, where consumers are increasingly upgrading to feature-rich and higher-priced devices.
India is now undergoing a transformative phase of the Internet of Things (IoT) industry, as it solidifies its role as a key facilitator of the ambitions of the Indian economy to become digital. IoT, which was initially viewed as a futuristic idea, has quickly become a baseline technology in the consumer, enterprise, and public infrastructure domains.
As banks and startups embrace modernization, secure and efficient digital platforms are attracting strong local and global investment. Artificial intelligence (AI), automation, and predictive analytics are redefining how finance works in Australia. These tools make transactions faster, decisions sharper, and client experiences more intuitive. From fraud detection to personalized banking, technology is transforming every corner of the market.
The Europe artificial intelligence market stands at a pivotal juncture, balancing unprecedented technological advancement with complex regulatory frameworks and strategic imperatives. As businesses across the continent accelerate their AI adoption Europe initiatives, the region emerges as a distinctive force in global artificial intelligence development, characterized by its commitment to ethical innovation and human-centric technologies.
India’s rapid digitalization has transformed the way organizations operate, connect, and deliver services. However, this digital shift has also exposed enterprises to a surge in cyber threats, ranging from ransomware and phishing to sophisticated data breaches and identity theft. As companies across sectors increase their reliance on digital platforms, the frequency and complexity of cyberattacks have intensified, forcing both public and private institutions to prioritize cybersecurity investments.
The Europe drones market has evolved into an indispensable aspect of the continent's operational and technological environment. Drones are now sequentially incorporated into sectors that rely on precision, real-time monitoring, and safe performance of field operations. Their capacity for aerial monitoring, environmental condition evaluation, and real-time observation allows companies to achieve greater accuracy in decision-making while reducing reliance on human intervention in hazardous areas.
The 3D printing industry is currently experiencing a revolutionary growth that has had a radical change on the manufacturing operations within the industries of the world. The technology is also referred to as additive manufacturing (AM), and it is the way to create three-dimensional objects by adding layers to the digital model, thereby providing unprecedented flexibility in both design and production. The 3D printing sector of the world has become a pivotal source of innovation enabler, efficiency, supply chain resilience, and competitive edges to organizations as small-and-medium-sized as small businesses to Fortune 500 organizations.
The education sector in India is witnessing a sea change with digital learning becoming integral to both formal and informal education. The rapid rise of online education platforms has reshaped the way schools, coaching institutes, and higher education centers impart learning experiences, accelerated by pandemic-driven digital acceleration. And today, technology-enabled education is no longer confined to urban centers; it is reaching Tier-2 and Tier-3 cities, democratizing access to quality learning resources for millions of students.
India’s healthcare sector is undergoing a technological transformation, with artificial intelligence positioned as a central driver of change. With a population exceeding 146.39 crore and a system challenged by issues of accessibility, affordability, and quality, AI is no longer optional but essential for building sustainable healthcare solutions.
India health and wellness market is on a fast track, with more people paying attention to preventive care and overall well-being. IMARC Group stated that the market hit USD 156.01 Billion in 2024, owing to the boom in nutraceuticals, fitness, and digital health platforms. Artificial intelligence (AI) is bringing a fresh wave of innovation to health and wellness, enhancing personalized fitness routines, predictive health insights, and more efficient wellness tracking.
Japan's ecotourism industry is experiencing a remarkable transformation, positioning the country as Asia's leading destination for sustainable travel experiences. The market, which is reaching unprecedented valuations of USD 12,999.78 Million in 2024, is demonstrating exceptional growth momentum with projections indicating an expansion to USD 34,542.85 Million by 2033, representing a robust compound annual growth rate (CAGR) of 11.47% during the 2025-2033 period.
The United Kingdom is currently establishing itself as one of Europe's most dynamic blockchain innovation hubs, demonstrating remarkable resilience and growth despite global economic uncertainties. The UK blockchain market reached a valuation of USD 0.66 Billion in 2024 and is projecting explosive growth toward USD 54.63 Billion by 2033, exhibiting a compound annual growth rate (CAGR) of 63.26% during the forecast period. This extraordinary trajectory is placing the nation at the forefront of distributed ledger technology adoption and development.
Japan has been a world leader in robotics, especially industrial, for decades. The nation's unflinching faith in technology development, precision manufacturing, and automation has made it a world leader in industrial robotics. Industrial robots have transformed the manufacturing process to become necessary equipment in today's manufacturing, helping companies increase productivity, retain quality, decrease errors in operations, and enhance efficiency in processes.
The Europe 3D printing market stands at the forefront of a manufacturing revolution that is reshaping industries across the continent. As additive manufacturing technologies mature and expand beyond prototyping into full-scale production, European manufacturers, healthcare providers, and aerospace companies are increasingly embracing these transformative solutions. With substantial government backing, strategic industry collaborations, and breakthrough material innovations, the European 3D printing landscape is positioned for remarkable expansion through 2033.
The Philippines gaming industry has emerged as Southeast Asia's fastest-rising digital entertainment powerhouse, achieving USD 4,822.00 Million in gross gaming revenue for 2024. This explosive growth signals a fundamental transformation in how Filipinos engage with interactive entertainment, driven by the rapid adoption of augmented reality (AR) and virtual reality (VR) technologies.
The data monetization market has emerged as a critical pillar of the modern digital economy, transforming how organizations create value from their information assets. As businesses recognize data as a strategic asset, the ability to extract financial value has become a competitive imperative. The global data monetization industry encompasses diverse approaches, ranging from direct data sales to indirect monetization through enhanced decision-making. According to IMARC Group, the industry reached USD 4.1 Billion in 2024. It is projected to reach USD 16.1 Billion by 2033, at a CAGR of 15.76% during 2025-2033.
The global access control market is entering a phase of serious expansion and transformation. In 2024, IMARC placed its value at USD 10.6 Billion, with a forecast of USD 18.8 Billion by 2033 (CAGR of 6.5 %). This reflects how rapidly the underlying technologies, threat landscape, and regulatory regimes are shifting. Across enterprises, campuses, infrastructure sites, and smart buildings, access control is evolving from door-level locks to identity, context, behavior, and integration. In many markets, access control is becoming an essential bridge between physical security and cybersecurity.
The media consumption landscape in Japan is in the midst of a revolutionary change with over-the-top (OTT) services as a leading force behind the way viewers are consuming entertainment content. OTT services, which provide video content directly on the internet and not via conventional cable or satellite television, are fast becoming a standard in Japanese homes. The growth of the Japanese OTT industry has been shaped by various factors, from technological innovations to changing consumer tastes.
The e-commerce market in Mexico is thriving, driven by increased internet access, mobile shopping, and smooth digital payment options. IMARC Group estimated that the market reached an impressive USD 47.52 Billion in 2024, signifying a distinct transition towards online shopping.
The global Industry 4.0 market is experiencing strong momentum, propelled by the integration of smart technologies across manufacturing, logistics, and energy sectors. With automation, connectivity, and data intelligence at its core, Industry 4.0 is reshaping how enterprises design, produce, and deliver products.
The global soft skills training market size was valued at USD 33.39 Billion in 2024. Looking forward, IMARC Group estimates the market to reach USD 92.59 Billion by 2033, exhibiting a CAGR of 11.40% during 2025-2033. This substantial growth reflects a fundamental shift in how organizations approach workforce development, as the recognition of soft skills as strategic assets rather than supplementary competencies becomes universal across industries.
The global Wi-Fi infrastructure market is experiencing unprecedented expansion, fundamentally reshaping how organizations operate and consumers interact with technology. According to Wi-Fi Alliance, the official industry certification body, 4.1 Billion Wi-Fi devices are forecast to ship in 2024, contributing to 45.9 Billion cumulative Wi-Fi shipments over the technology's 25-year lifetime.
Australia's mobile money industry is experiencing unprecedented transformation as artificial intelligence reshapes the landscape of digital payments, mobile wallets, and financial services. The integration of sophisticated AI technologies has revolutionized how Australians conduct transactions, manage their finances, and interact with digital payment platforms. From smartphone-based payment solutions to advanced fraud detection systems, AI is driving innovation across every facet of the mobile money ecosystem.
India vehicle tracking market is undergoing a significant transformation, with artificial intelligence emerging as a central driver of innovation. According to the IMARC Group’s report, the market size reached USD 0.90 Billion in 2024.
India stands at a decisive stage where economic growth must advance in parallel with environmental sustainability. According to an IMARC Group report, the Indian green technology and sustainability market reached USD 837.2 Million in 2024, reflecting the nation’s growing commitment to sustainable development.
Closed-Circuit Television (CCTV) cameras are electronic monitoring systems that are used to watch, record, and send video images for security and observational reasons. Unlike television broadcasting, CCTV signals are sent to selected monitors or recording devices, and hence they are the backbone of contemporary security infrastructure.
India's educational technology sector stands at the precipice of a transformative revolution, with artificial intelligence (AI) emerging as the primary catalyst driving unprecedented growth and innovation. The convergence of AI technologies with educational platforms is fundamentally reshaping how millions of Indian students access, consume, and engage with learning content, creating an ecosystem that democratizes access to quality education across the country’s diverse linguistic and socioeconomic groups.
Japan’s higher education sector is at a major turning point as demographic and economic pressures converge with technological disruption. One of the major trends in the Japan higher education market include the number of students entering universities has been shrinking for decades due to the country’s aging population, creating structural challenges for institutions that once relied on a stable or growing pool of applicants.
Japan, a global leader in technological innovation, is at the forefront of a new digital revolution in its satellite communication sector. As the nation pushes toward a more connected and resilient future, the integration of Artificial Intelligence (AI) is proving to be a critical catalyst. From enhancing network performance to automating complex operations AI is not just an add-on it is a foundational technology reshaping the very fabric of satellite communication.
Generative artificial intelligence (AI) is rapidly becoming one of the most influential technologies of the decade, and its global footprint is continuously expanding. Nations across the world are exploring its transformative potential, with Japan emerging as a unique hub where technological innovation, traditional industries, and forward-looking government policies are converging.
A battery charger is a piece of electrical equipment that is used to recharge a rechargeable battery by imposing an electric current upon it. The main purpose of a charger is to transfer alternating current (AC) from the power source into an appropriate direct current (DC) that has the required voltage and current for the particular type of battery. Battery chargers play a vital role in a broad variety of applications, from consumer devices and electric vehicles (EVs) to industrial equipment and renewable energy systems.
Indian manufacturing continues to grapple with significant losses caused by defects, rework, and product returns, which weaken profitability and competitiveness. As per an industry report, in FY22, the total return order volume in India stood at 14.86%. Furthermore, high-volume industries such as automotive, FMCG packaging, textiles, and electronics are particularly exposed, where even a small defect rate can translate into substantial financial setbacks. Industry research states that in mature operations, the Cost of Poor Quality (COPQ) can account for as much as 15–20% of total sales. Moreover, Return Prime’s recent report shows that returns remain a major challenge in e-commerce sales, with 17.6% of all orders being sent back.
Industry 4.0 has been a defining milestone in the advancement of manufacturing. It is responsible for introducing automation, digitization, and data-driven processes that significantly enhanced productivity and precision. Presently, India is moving into the next phase of manufacturing, that is, autonomous factories. Here, artificial intelligence (AI) goes beyond simple automation, enabling systems to render decisions, learn from changing conditions, and continuously improve operations. This shift has the potential to reshape industrial growth in the country and establish new standards for smart manufacturing.
Indian manufacturers are facing difficulties due to rising input costs, shortages of skilled labour, unplanned machine downtime, and inconsistent product quality. According to an industry report, during the July–September quarter of FY25, raw material expenses for 1,679 listed non-financial manufacturing companies increased by 5.1%, outpacing sales growth, which rose by only 3.3%. Similarly, the Global Talent Shortage Survey 2025 reported that 80% of Indian employers report difficulty finding skilled talent, compared to the global average of 74%, highlighting a severe talent crunch.
According to the International Energy Agency (IEA), global energy-related CO2 emissions grew by 0.8% in 2024 to a record 37.8 gigatonnes, driving atmospheric concentrations to an unprecedented 422.5 ppm. This has led to an increased urgency in addressing climate change. Similarly, the industries are facing unprecedented pressure to rethink their operations due to the energy demand rising by 2.2% in 2024, which is faster than the annual average of 1.3% witnessed between 2013 and 2023.
India is among the fastest-growing economies globally. The nation is currently the fourth-largest economy in the world and is on its way to becoming the third-largest, with an estimated GDP of USD 7.3 Trillion by 2030. This momentum is not only strengthening India’s economic resilience but also opening lucrative opportunities for businesses, investors, and technology providers aligned with the country’s growth vision.
The role of artificial intelligence (AI) in modern project management has transitioned from a theoretical concept to a strategic imperative. As businesses navigate increasingly complex projects in a data-driven world, AI is emerging as a powerful force for efficiency, accuracy, and innovation.
The artificial intelligence market is no longer niche. Current projections value the market at a significant level today, with strong growth expected as generative AI matures, computing costs decline, and enterprise pilots scale into full production.
The data center sector in Japan is at the epicenter of a tech revolution, wherein artificial intelligence (AI) is fundamentally redefining how digital infrastructure manages, scales, and adapts. With the country progressing toward digital transformation in various industries, AI has been the force behind unprecedented innovation in the design, management, and optimization of data centers.
In the modern era, the global video streaming market is fundamentally reshaping the entertainment landscape, driven by the dual forces of digitalization and the escalating demand for on-demand content. Artificial intelligence (AI) also serves as a pivotal catalyst for this growth, enabling the personalization of user experiences through tailored recommendations, improved content discovery, and enhanced audience engagement.
The global gaming console market is undergoing a significant transformation, fueled by the adoption of artificial intelligence (AI) and an increasing demand for interactive entertainment.
For decades, call centers have played a central role in customer service. Traditionally staffed with large teams of agents, they operated as cost-heavy units designed to handle inquiries, complaints, and service requests. While essential, this model was often associated with inefficiencies, long wait times, and high employee turnover.
According to IMARC Group, the global identity verification market was valued at USD 13.8 Billion in 2024 and is projected to reach USD 46.4 Billion by 2030, expanding at a CAGR of 14.4% during 2023–2030. This strong growth is being fueled by the increasing adoption of artificial intelligence (AI) and machine learning (ML), which are enabling higher levels of automation, fraud detection, and real-time authentication.
Japan is a leader in digital transformation, known for being one of the most advanced nations in technology globally. Artificial Intelligence (AI) is becoming an integral force across various sectors, and the telecom industry is no exception.
Generative AI is revolutionizing industries by bringing fresh, game-changing solutions that boost creativity and streamline workflows. Whether it’s automating content creation or optimizing complex processes in fields like healthcare and finance, AI is opening doors to exciting new possibilities.
The e-commerce market has undergone a seismic shift in the past twenty years. What started as simple, text-based product pages has grown into a complex web of intelligent platforms capable of customizing experiences for every individual user. At the core of this evolution is Artificial Intelligence (AI).
The global laptop and tablet market includes portable computing devices for both personal and commercial use, providing mobility, flexibility, and connectivity. Laptops extend desktop computers' power and functionality in a portable package, while tablets provide light-touch screen interfaces for consumption of media, creative work, and on-the-go productivity.
The global cloud gaming industry is experiencing an unprecedented surge, driven by technological advancements and evolving consumer preferences. As the market expands, Artificial Intelligence (AI) stands out as a pivotal force, reshaping every facet of the cloud gaming landscape, from infrastructure to player experience. It enables smarter resource allocation, real-time content personalization, latency reduction, and advanced game logic.
The global power bank market is experiencing steady growth as digital lifestyles become more integrated into everyday routines. With rising dependence on smartphones, tablets, laptops, and wearables, power banks have shifted from being simple backup batteries to versatile, feature-rich accessories that fulfill the needs of a wide range of users. Consumers now prefer power banks with fast-charging capabilities, higher battery capacity, and environmentally responsible designs.
The hybrid cloud market across the world has been changing at a very fast rate, with companies globally adopting the mix of on-premises and cloud-based infrastructures to fuel innovation and operational effectiveness.
Japan’s artificial intelligence (AI)-driven three-dimensional (3D) printing startups are redefining manufacturing by merging speed, sustainability, and precision. Japan’s additive manufacturing scene is moving beyond prototypes—it's rewriting how industries build, design, and innovate.
As a global leader in technology and innovation, Japan has increasingly recognized the critical importance of cybersecurity to protect its digital infrastructure.
Electric cables or power cables are the fundamental parts employed for the transfer of electrical power or signals over short and long distances. They generally comprise one or more conductors, typically composed of copper or aluminum, covered with insulating materials and protective sheaths. Electric cables, based on their use, differ in structure, including low-voltage, medium-voltage, and high-voltage power cables, control cables, instrumentation cables, or data transfer cables like fiber optics.
Smart Factory and Industry 4.0 Integration is a comprehensive set of services that helps firms overhaul their manufacturing processes by embracing new technologies such as the Internet of Things (IoT), Artificial Intelligence (AI), robotics, big data analytics, and cloud computing.
Digitalization is reshaping the very essence of travel, transforming it into a more personalized, convenient, and efficient experience than ever before. With the growing popularity of travel platforms, travelers now have the power to plan and book their entire journey with just a few taps on their smartphones.
Product and facility certification support offers professional assistance to companies in resolving complicated processes of product certification and facility certification. Our services facilitate adherence to global standards and regulatory guidelines to ensure hassle-free market entry and operational continuity across global markets.
The global e-commerce landscape is rapidly transforming, propelled by several evolving e-commerce industry trends. These fundamental shifts encompass changes in consumer behavior, rapid technological advancements, and increasing internet accessibility worldwide. As a direct result, brands are now prioritizing quick delivery, mobile-centric platforms, and deeply customized digital experiences.
Setting up a drone manufacturing plant with a step-by-step business plan covering setup, costs, equipment, compliance, and market strategy.
India’s textile industry is undergoing a transformative shift led by the government’s visionary PM MITRA (Mega Integrated Textile Region and Apparel) Parks initiative. With a mission to establish India as a worldwide leader in textiles, this program is creating world-class integrated manufacturing zones that drive innovation, reduce production costs, and boost sustainability.
India’s sports technology sector is gaining extraordinary momentum, driven by the digitalization of sports leagues, enhanced fan engagement, and increasing investments in athletic performance solutions. With the Indian Premier League (IPL) 2025 poised to become the most tech-driven tournament to date, the market is no longer restricted to wearables and broadcasting; it now powers every aspect of sports, from grassroots training to AI-based strategic decision-making.
India is becoming a popular location for foreign manufacturers because of its quickly expanding economy, affordable labour costs, and consistent government support. For businesses looking to establish manufacturing facilities in the nation, the Government's "Make in India" incentive program offers an alluring alternative. This guide will assist in comprehending the crucial requirements for setting up a manufacturing facility in India.
Factory audits are important for companies that intend to ensure compliance and quality in operations as well as supply chain efficiency. India is experiencing unparalleled growth in manufacturing. The skills to perform factory audits effectively can be used to counter most risks related to Indian supplier relationships. This blog gives a complete step-by-step guide on how to perform factory audits in India, including a complete checklist.
Establishing a manufacturing plant is a major investment that requires meticulous planning and a thorough understanding of the associated costs. Whether a seasoned entrepreneur or an industrial novice, understanding the "cost equation" is vital for making informed financial decisions and ensuring the long-term profitability of the operations. This blog will break down the various expenses associated with establishing a manufacturing facility in India.
Setting up a manufacturing plant is a significant milestone for any business, but it comes with complexities that require careful planning, research, and execution. From selecting the right location to ensuring regulatory compliance and operational efficiency, every aspect needs expert attention to guarantee success. This is where IMARC Group steps in, offering comprehensive pre-feasibility studies and consultation services to help businesses establish manufacturing plants seamlessly.
The manufacturing sector is a cornerstone of India's economy. It accounted for about 14% of the overall GDP of the nation in 2024 and has employed millions of people across the country. India has been a rising manufacturing powerhouse globally and 2025 is expected to be a turning point. Given the better government focus and strong labor force, along with the increasingly effective infrastructure, India is likely to be sealed as a prime destination for global manufacturers.
Many have encountered this scenario: visiting a website with enthusiasm to purchase a product seen in an advertisement, only to face challenges such as navigating a complex interface, unresponsive customer service, and a cumbersome checkout process.
The OTT industry is experiencing a pivotal transformation, signaling the advent of a new digital entertainment era. Consumers are increasingly demanding convenience and personalized experiences on OTT platforms. As a result, platforms are investing massively in technologies such as AI to enhance the recommendations of content and improve user experience.
From established giants in the United States and Europe to fast-paced markets in Asia, the e-commerce revolution is creating a competitive marketplace that transcends geographical boundaries. Vietnam stands out as a key force in this global trend, showcasing the potential of e-commerce to drive national economic transformation. The country’s e-commerce industry is witnessing tremendous growth, driven by new markets and growth opportunities in established markets.
Head-mounted displays consist of small displays with in-built sensors and optics that project images directly onto the user's eyes. They provide a virtual reality (VR) or augmented reality (AR) experience that allows users to interact with digital objects or environments. They resemble glasses or goggles and are designed to be worn on the head. They comprise many components, such as a controller, sensor, camera, lens, goggles, head tracker, case, connector, display, battery, processor, memory, pico projector, and accessories. Tracking systems and sensors detect the user's head movements and adjust the displayed content accordingly, offering the user a more realistic, immersive, and interactive experience.
5G technology or fifth-generation wireless technology is the latest advancement in mobile communication systems that provides enhanced data transfer speeds, reduces latency rates, improves reliability, and increases network capacity. This technology operates in the mm-wave spectrum, the spectrum band ranging from 30 to 300 gigahertz (GHz), which facilitates high-speed networks and faster data delivery. 5G technology supports the growth of emerging technologies like artificial intelligence (AI), machine learning (ML), and edge computing, enabling new business models and unlocking economic potential. It enhances the performance of business applications and digital experiences, such as video conferencing, online gaming, live streaming media, and self-driving cars. The components included in 5G technology are hardware, software, and services, and it is utilized in a wide range of applications, such as automation, video services, connected vehicles, smart homes, virtual & augmented reality, and monitoring & tracking. For better connectivity of networks, various industries, such as manufacturing, automotive, transportation & logistics, media & entertainment, energy & utilities, healthcare, government, and others, have deployed 5G technology extensively.
Robotics is the branch of engineering that deals with designing, constructing, and operating robots. Robots are programmable machines capable of carrying out tasks autonomously or semi-autonomously. Major types of robotics include industrial and service robots, combining elements of mechanical engineering, electrical engineering, computer science, and artificial intelligence (AI). Industrial robots encompass articulated, Cartesian, SCARA, and cylindrical robots. Service robots serve personal, domestic, and professional purposes, used in various applications, such as household tasks, entertainment, defense, fieldwork, logistics, healthcare, infrastructure, mobile platforms, and cleaning, and more. Robotics can efficiently and accurately perform tasks in environments that may be hazardous or challenging for humans. Robots reduce human labor, enhance production efficiency, lower costs, and improve product quality in various industries. Robotics is further categorized into types such as industrial robotics, food robotics, warehouse robotics, smart robotics, automotive robotics, agriculture robotics, logistics robotics, construction robotics, space robotics, and others. Nowadays, robotics has become an important part of many industries, even being used to explore deep oceans and space. Additionally, it is employed in creating autonomous vehicles, performing surgery, and conducting medical diagnoses.
Artificial Intelligence (AI) chips are designed to accelerate and optimize AI and Machine Learning (ML) workloads. The field of AI involves tasks such as pattern recognition, data analysis, and decision-making, which often require massive parallel processing. AI chips perform various tasks like deep learning, neural network processing, and other computationally intensive operations. These chips are tailored to support the parallel computing needs of AI workloads, making them well-suited for these tasks.
Oman is situated on the southeastern coast of the Arabian Peninsula. It boasts a rich cultural heritage, stunning landscapes, and a diverse range of attractions, making it an emerging destination in the tourism market. The country offers a wide array of tourist activities, including sunbathing, swimming, kitesurfing, diving, snorkeling, boating, among many others. Beach activities and kite surfing are popular in Muscat, Al Sawadi Beach, Alzaiba Beach, and Masirah Island, while desert safaris are a highlight in Wahiba Sands. Oman's rich historical heritage includes numerous UNESCO World Heritage Sites, ancient temples, forts, and palaces, such as Bahla Fort and the Archaeological Sites of Bat, Al-Khutm, and Al-Ayn.
Virtual reality (VR) gaming represents a new generation of computer games that leverage VR technology to provide high-definition visuals, spatial audio, and precise motion tracking, creating a sense of presence and immersion. VR gaming offers a 360-degree view of the virtual environment, keeping players engaged for longer periods compared to traditional gaming. Additionally, VR gaming is used in rehabilitation and the treatment of phobias, anxiety disorders, and other psychological conditions. It is also employed to train soldiers in combat scenarios, strategy, and decision-making.
Cloud computing delivers computing services over the internet, including servers, storage, databases, networking, software, analytics, and intelligence. It promotes faster innovation, flexible resource allocation, and economies of scale. Moreover, it offers numerous advantages, such as cost efficiency, mobility, scalability, reliability, and automatic software updates, among others.